2013 NCAA Football Standings
Updated September 23, 2013
|
Cheers.
2013 NCAA Football Standings
Updated September 23, 2013
|
Cheers.
Back in March, several dozen websites, written by either professionals, bloggers, or, in some cases, professional bloggers, came out with predicted MLB win totals.
A predicted win total represents the number of wins this website or individual predicted for each major league team. These numbers can be easily compared to the Las Vegas line for each team (I used the one set by the Hilton) to determine if these predictions are worth our time, and, in some cases, our money.
Here are the sites I used:
O/U: The Hilton’s over/under for each team
BP: Baseball prospectus
TR: Team Rankings (caveat on the linked page: the site stresses their MLB predictions are a work in progress)
DP: Davenport
Zips: ZIPS projection system (espn.com)
PM: Prediction Machine
TB: Trading Bases, an avid blogger and book-writer
Here are my metrics
MSE: Averaged squared error between the prediction and the win totals*
MAE: Averaged absolute error between the prediction and the win totals*
Corr: Correlation between the predicted and the win totals*
*For win totals, I’m use each team’s estimated win totals from here (I’m too excited to wait until the end of the season!)
Results
| O/U | BP | TR | DP | Zips | PM | TB | |
| MSE | 68.59 | 62.50 | 84.56 | 70.47 | 75.37 | 79.76 | 61.04 |
| MAE | 6.65 | 6.75 | 7.73 | 6.75 | 7.01 | 7.22 | 6.53 |
| Corr | 0.68 | 0.71 | 0.59 | 0.67 | 0.66 | 0.61 | 0.72 |
Baseball prospectus appears to offer the only clear advantage over the Las Vegas line, at least among these predictions, as judged by a higher correlation and a lower MSE between observed and predicted values. As for team rankings & prediction machine, their results were both disappointingly bad. (Note: Trading Bases came into the picture after the initial post, and also appears to be a clear winner).
TeamRankings does offer this disclaimer about their projections:
A word of caution — while our preseason projections for other sports have proven to be useful indicators of where values may lie among the various full season futures bets, we’re not nearly as confident in our MLB preseason ratings. We’re publishing these in the interest of full disclosure, so that you know what the initial rating in our projection system was for each team. We’re most definitely not recommending that you use these ratings and forecasts to go place preseason bets.
Here’s the table of predicted wins for each site.
| Team | O/U | BP | TR | DP | Zips | PM | TB | Simulated Wins |
| Diamondbacks | 82.5 | 85 | 83 | 81 | 85 | 76.8 | 80 | 82.5 |
| Braves | 86.5 | 83 | 85 | 85 | 91 | 86.6 | 82 | 95.8 |
| Orioles | 78.5 | 75 | 81 | 75 | 82 | 79.2 | 76 | 86.2 |
| Red Sox | 82.5 | 85 | 79 | 85 | 84 | 80.5 | 83 | 97.2 |
| Cubs | 72.5 | 77 | 73 | 76 | 74 | 75.8 | 69 | 67.5 |
| White Sox | 80.5 | 76 | 83 | 76 | 80 | 85 | 78 | 64.2 |
| Reds | 90.5 | 92 | 84 | 86 | 90 | 91.1 | 84 | 92 |
| Indians | 78.5 | 80 | 74 | 79 | 80 | 76.8 | 85 | 87.9 |
| Rockies | 71.5 | 71 | 75 | 74 | 70 | 77.5 | 70 | 72.9 |
| Tigers | 92.5 | 91 | 86 | 95 | 91 | 89.7 | 95 | 94.5 |
| Marlins | 63.5 | 67 | 75 | 65 | 65 | 65.3 | 64 | 60.1 |
| Astros | 58.5 | 63 | 67 | 72 | 57 | 62.5 | 66 | 54.9 |
| Royals | 78.5 | 76 | 78 | 80 | 79 | 75 | 77 | 85.1 |
| Angels | 91.5 | 91 | 86 | 91 | 93 | 93.3 | 88 | 79 |
| Dodgers | 91.5 | 91 | 83 | 88 | 90 | 90.6 | 91 | 92.5 |
| Brewers | 81.5 | 78 | 83 | 78 | 81 | 77.6 | 78 | 73.3 |
| Twins | 68.5 | 65 | 74 | 69 | 66 | 70.9 | 66 | 69.6 |
| Mets | 75.5 | 80 | 78 | 76 | 66 | 76.8 | 74 | 73 |
| Yankees | 86.5 | 91 | 90 | 86 | 83 | 84.7 | 87 | 84.9 |
| Athletics | 84.5 | 83 | 86 | 84 | 78 | 85.3 | 85 | 94.6 |
| Phillies | 85.5 | 81 | 84 | 81 | 82 | 81 | 86 | 75.7 |
| Pirates | 77.5 | 80 | 77 | 81 | 77 | 74.8 | 79 | 92.1 |
| Padres | 73.5 | 76 | 78 | 76 | 73 | 72.7 | 81 | 76.1 |
| Giants | 87.5 | 85 | 85 | 92 | 87 | 85.1 | 88 | 75.2 |
| Cardinals | 82.5 | 85 | 86 | 83 | 85 | 85.1 | 90 | 94.6 |
| Rays | 86.5 | 87 | 88 | 86 | 88 | 89.5 | 93 | 89.2 |
| Rangers | 86.5 | 89 | 88 | 85 | 91 | 86.8 | 85 | 88.1 |
| Blue Jays | 88.5 | 84 | 78 | 86 | 94 | 87.5 | 82 | 73.8 |
| Nationals | 91.5 | 87 | 86 | 85 | 94 | 92.5 | 90 | 86.3 |
| Mariners | 77.5 | 78 | 79 | 73 | 74 | 74 | 78 | 71.4 |
ESPN’s Jim Caple just posted an article about the win statistic. This seems to be a response to Brian Kenny’s all-out assault on the win. Kenny is attacking the old stat as a grossly misleading, if not useless, statistic in measuring how good a pitcher is. I don’t really care if Kenny’s “kill the win” campaign gains steam or not; frankly, I don’t really care about wins (outside of my fantasy leagues where they count). I do think it’s outdated and doesn’t tell us much of anything. Matt Harvey has nine measly wins while having (pre-injury, obviously) a rookie season for the ages. Harvey still ranks second in pitcher WAR on Fangraphs (as of September 18- Kershaw, at least, will eclipse him before season’s end). Of course, it’s not Harvey’s fault he plays for the Mets (I suppose he could have refused to sign, like Elway and Baltimore or Cushman and Denver) but poor Harvey was enjoying the 13th lowest run support of all NL starters.
Caple admits to some shortcomings, but comes to the defense of the win:
Perhaps stat-heads would appreciate the win more if it was something else, though, something much more complicated and mathematically challenging. Maybe they would like it more if it included complex calculations that account for run support, adjusted ERA, advanced fielding analytics, WAR, stadium factors and humidity and was called tWIN.
I do love the idea that the win is simple and other sabermetric stats are, by definition, not. Caple talks about the “uncomplicated” win in an article that also discusses how on September 13, Cleveland starter Danny Salazar struck out 9 in 3.2 innings, but couldn’t get the win, because he didn’t go the required five innings. He talked about Drew Smyly vulturing Max Scherzer’s 20th win, after Smyly blew the lead. The rules on how wins are awards are full of inane loophools and requirements. Caple doesn’t even mention my favorite part of the win rule, which I’ll quote right out of the official MLB rules:
Rule 10.17(b) Comment: It is the intent of Rule 10.17(b) that a relief pitcher pitch at least one complete inning or pitch when a crucial out is made, within the context of the game (including the score), in order to be credited as the winning pitcher. If the first relief pitcher pitches effectively, the official scorer should not presumptively credit that pitcher with the win, because the rule requires that the win be credited to the pitcher who was the most effective, and a subsequent relief pitcher may have been most effective. The official scorer, in determining which relief pitcher was the most effective, should consider the number of runs, earned runs and base runners given up by each relief pitcher and the context of the game at the time of each relief pitcher’s appearance. If two or more relief pitchers were similarly effective, the official scorer should give the presumption to the earlier pitcher as the winning pitcher. [emphasis added]
The win isn’t a simple statistic just because it doesn’t have a mathematical formula. Like the RBI, there’s so many things that the player collecting it doesn’t control. That alone is why its value is so limited.
Caple boils down his argument to this with this:
Could the win be better? Sure. But one of the reasons I like the win is its simplicity. Despite its clear limitations, the win is a long-established and fun statistic that quickly tells us something about a pitcher — how many bad pitchers win 18 games in a season or 200 games in a career? — though by no means everything. Nobody is saying the win is the ultimate arbiter of anything for a pitcher. It’s just one of many stats for your consideration.
As I’ve already said, the win is not simple, and Caple makes the point himself. And he’s right, it’s one of many stats for you consideration, like paying $3 for a tin of Pringles on your next US Air flight is a food option; it’s not necessarily the best option for you to take.
As for players who accumulate big single season win totals or lots of wins over a career- does this mean much? In the days of complete games, when pitchers would rarely be lifted, the win meant something though still less than it seems lots of folks want it to. These days, with increased specialization and pitch counts and so on, it means even less. Christy Mathewson, to pick a random old-timey pitcher with longevity, averaged 8.67 innings per start for his ENTIRE 552-start, 17-year-long career. Mike Mussina is the closest modern starter in terms of games started to Mathewson, as Moose started 536 games. For his career, Mussina averaged 6.67 innings per start. Mathewson would need one out from a reliever, but he still needed the run support. Moose needed two innings and an out plus run support. To turn this a different way, Curt Schilling and Mike Mussina were both terrific pitchers in a big offensive era. Both were regular starters from 1992 until 2007. Schilling started 569 games to Moose’s 536, but Moose threw almost exactly 300 more innings (Schilling averaged 5.7 innings per start.) Schilling ended up with 54 fewer wins. Why? Mussina played for the generally good 90s Orioles while Schilling was pitching for the generally bad 90s Phillies. Similar service time, huge difference in win totals. Incidentally, Mussina is at 83.0 in rWAR and 82.3 in fWAR, while Schilling is 79.9 and 83.5. What seems like the better comparison? Wins, where Schilling is only 80% the pitcher Mussina was or WAR where they were equally good?
As for the specific win-totals Caple mentions, to counter that point I do need some fancy sabermetric, context-controlled stats, specifically FIP- and ERA- (each stat takes into account park factors and the league average numbers and compares them to other pitchers of that specific era; 100 is average, and the lower the number, the better. Someone who has an FIP- of 80 is 20% better than their peers) Lew Burdette was a solid pitcher from 1950 to 1967, mostly for the Braves. He collected 203 wins. He had a career ERA- of 101 and a career FIP- 103, both slightly below average. Denny McClain in 1966 won 20 games, and had an ERA 13% worse than the AL average and a FIP 23% worse. It’s actually not hard to find other examples of pitchers who were average or worse and managed to still win 18 or more games (here’s the custom search) but I suppose I can be discounted because I used ERA- and FIP-. Are any of these pitchers bad? No, none of them were Jose Lima for the Royals bad (incidentally, Lima had a 21 win season for the Astros in 1999. He was pretty good that year. I’m pretty sure there were a dozen or two pitchers in 1999 that weren’t named Jose Lima you’d have preferred on your team.)
I understand a desire for a simple number that can be understood quickly and tells us who was a good pitcher and who wasn’t. What escapes my understanding is this luddite position that Caple and others like him take, where they run towards this an archaic stat. I suppose there’s a bit of “it’s always been there.” But it strikes me a bit like someone in 1920 saying “we can’t get rid of the guys making horseshoes.” Horseshoes might be interesting, and occasionally might be useful, but they’re not longer a critical part of our world.
See more from this Tim guy at his blog or at Saturday Morning Deathgrip.
Every Monday, Ph.D. students in the public health program at Brown gather to eat pizza, rearrange some unappetizing caesar salad around on our plates, and discuss a recent manuscript in different fields in an entertaining hour known as JournalClub.
Today’s article of choice was written in American Journal of Health Promotion, linked here, which promoted the idea that short bouts of moderate to vigorous exercise each day were successful in reductions of BMI. The article was titled “Moderate to Vigorous Physical Activity and Weight Outcomes: Does Every Minute Count?”
Methods, covariates, and study population limitations aside, what struck me as uncomfortable was how, despite the author’s self-admittance that this manuscript did not show causes and effects, the journal still placesets the following highlighted box.

In other words, “we can’t claim causation with our exercise exposure, but we urge you to change your lifestyle anyways.” Is that…
View original post 93 more words
Updated: September 15, 2013
|
Prediction: Patriots win 34-19
Pick: Patriots -12
OU: Over 44
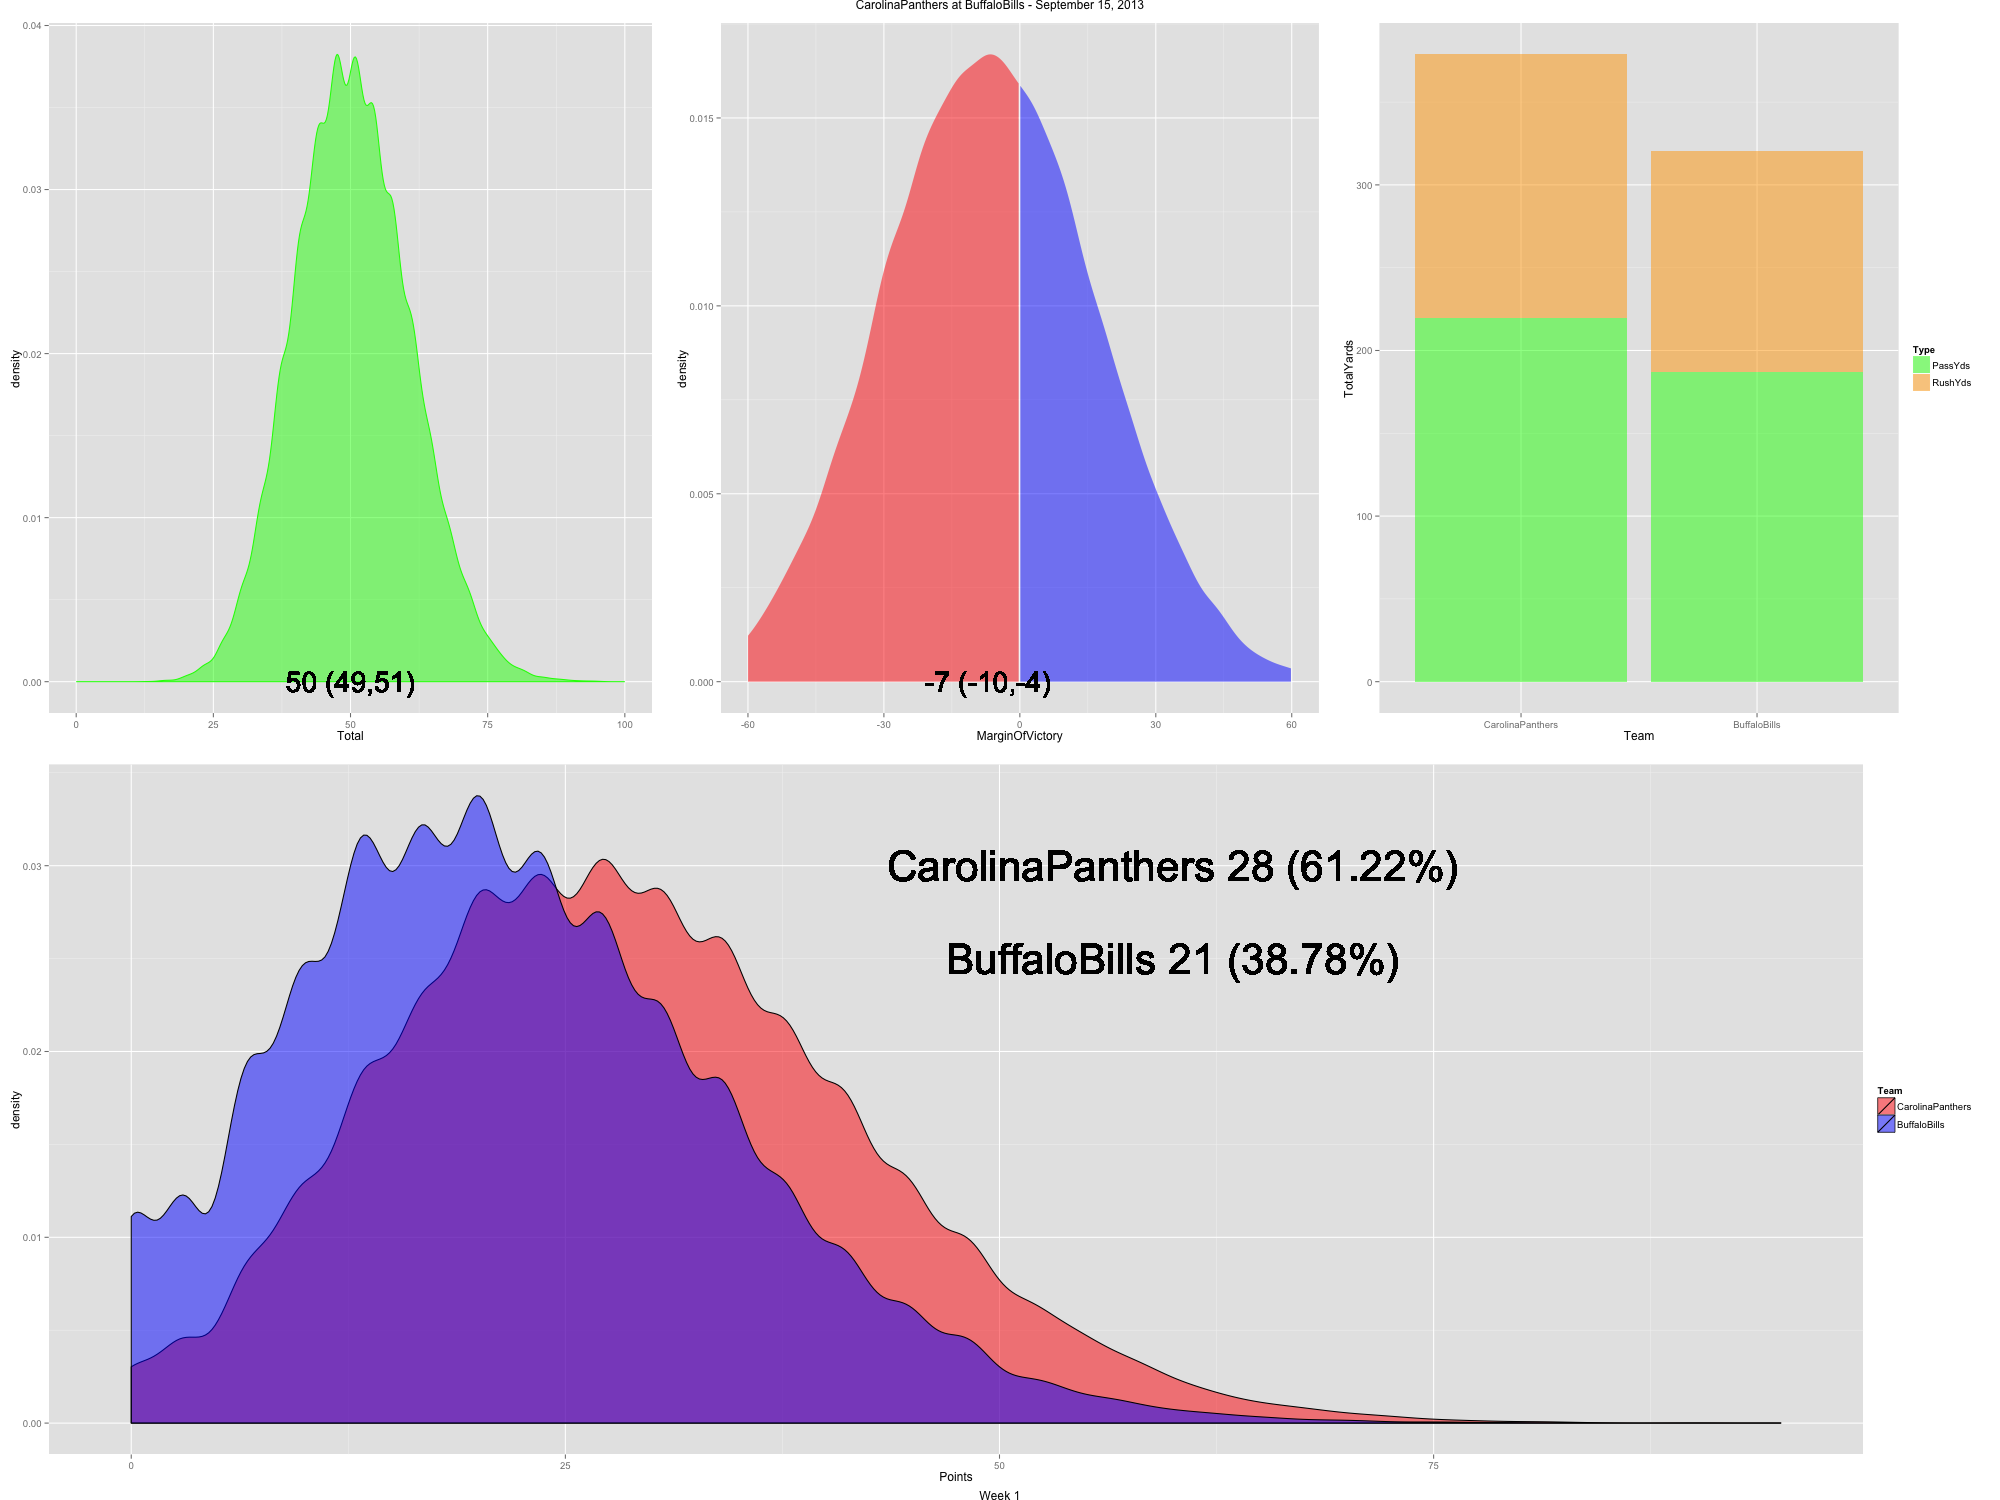
Prediction: Panthers win 28-21
Pick: Panthers -3
OU: Over 44
Prediction: Ravens win 26-19
Pick: Ravens -7
OU: Over 43.5
Prediction: Cowboys win 26-19
Pick: Cowboys -2.5
OU: Under 47
Prediction: Dolphins win 21-20
Pick: Dolphins +3
OU: Over 43
Prediction: Bears win 22-19
Pick: Viking +6.5
OU: Over 42
Prediction: Chargers win 24-20
Pick: Chargers +9
OU: Under 54.5
Prediction: Packers win 27-26
Pick: Redskins +7.5
OU: Over 50
Prediction: Falcons win 24-19
Pick: Rams +7
OU: Under 48
Prediction: Texans win 30-17
Pick: Houston -9
OU: Over 43
Prediction: Saints win 28-27
Pick: Buccaneers +4
OU: Over 48
Prediction: Lions win 24-21
Pick: Lions -2.5
OU: Under 48
Prediction: Broncos win 24-23
Pick: Giants +5.5
OU: Under 56
Prediction: Raiders win 24-23
Pick: Jaguars +6
OU: Over 40
Prediction: 49ers win 21-20
Pick: 49ers +2.5
OU: Under 45
Prediction: Bengals win 20-19
Pick: Steelers +7
OU: Under 41
September 7, 2013
|
Prediction: Boston College 22-16
Prediction: LSU 32-13
Prediction: Mississippi State 39-6
Prediction: Arizona 38-21
Prediction: Arkansas State 24-19
Prediction: Ball State 31-28
Prediction: Vanderbilt 32-7
Prediction: Kent State 19-18
Prediction: Baylor 40-24
Prediction: Fresno State 31-20
Prediction: Nevada 44-17
Prediction: Central Arkansas 27-24
Prediction: Central Florida 25-14
Prediction: Georgia State 23-20
Prediction: Cincinnati 24-13
Prediction: Tulsa 31-16
Prediction: Duke 33-23
Prediction: Louisville 33-12
Prediction: Penn State 35-10
Prediction: East Carolina 26-22
Prediction: Marshall 38-20
Prediction: Louisiana-Monroe 35-13
Prediction: Oregon State 31-12
Prediction: Temple 28-24
Prediction: Wyoming 33-18
Prediction: Purdue 23-13
Prediction: James Madison 27-26
Prediction: Louisiana Tech 43-14
Prediction: Kansas State 28-20
Prediction: Maine 22-21
Prediction: North Carolina 34-17
Prediction: Minnesota 26-14
Prediction: Iowa 28-12
Prediction: Navy 31-27
Prediction: Central Michigan 27-20
Prediction: New Mexico 26-23
Prediction: Western Michigan 30-16
Prediction: Rutgers 27-9
Prediction: Ohio 28-20
Prediction: Notre Dame 22-14
Prediction: Oklahoma State 37-17
Prediction: Old Dominion 20-18
Prediction: Oregon 36-16
Prediction: California 36-14
Prediction: North Carolina State 28-14
Prediction: Arizona State 34-14
Prediction: Texas A&M 42-16
Prediction: Arkansas 31-13
Prediction: Ohio State 27-17
Prediction: Stanford 23-16
Prediction: Troy 39-13
Prediction: South Alabama 26-20
Prediction: Georgia 20-17
Prediction: Clemson 45-7
Prediction: Kansas 27-20
Prediction: Michigan State 17-13
Prediction: Mississippi 40-12
Prediction: TCU 37-6
Prediction: Nebraska 34-13
Prediction: Texas Tech 41-21
Prediction: Northwestern 26-23
Prediction: Wisconsin 35-7
Prediction: Boise State 34-12
Prediction: BYU 19-18
Prediction: Missouri 28-21
Prediction: Utah 27-20
Prediction: USC 31-14
Prediction: Utah 30-14
Prediction: Oklahoma 31-24
Prediction: Virginia Tech 28-9
Prediction: Tennessee 30-23
Prediction: Broncos win 24-23
Pick: Ravens +8.5
OU: Over 47.5
Prediction: Patriots win 38-21
Pick: Patriots -7
OU: Over 51
Prediction: Steelers win 25-17
Pick: Steelers -7
OU: Over 42
Prediction: Falcons win 30-24
Pick: Falcons +3
OU: Over 53.5
Prediction: Buccaneers win 24-20
Pick: Buccaneers -2.5
OU: Over 40.5
Prediction: Chiefs win 23-20
Pick: Jaguars +3.5
OU: Over 41
Prediction: Bears win 21-17
Pick: Bengals +3.5
OU: Under 43.5
Prediction: Dolphins 20-19
Pick: Browns +1.5
OU: Under 41
Prediction: Seahawks win 26-17
Pick: Seahawks -2.5
OU: Under 45.5
Prediction: Vikings win 27-24
Pick: Vikings +3.5
OU: Over 46
Prediction: Colts win 27-22
Pick: Raiders +7
OU: over 47.5
Rams win 21-16
Pick: Cardinals +6
OU: Under 41.5
Prediction: 49ers win 26-20
Pick: 49ers -4
OU: Under 48
Prediction: Giants win 27-21
Pick: Giants +2.5
OU: Over 47.5
Prediction: Redskins win 31-21
Pick: Redskins -4.5
OU: Over 47.5
Prediction: Texans win 25-19
Pick: Texans -3
OU: Over 44.5
New England – (11-5) 10.588
Miami – (8-8) 7.57
NY Jets (7-9) 6.843
Buffalo – (7-9) 6.634
Baltimore (9-7) 8.816
Cincinnati – (8-8) 8.179
Pittsburgh – (8-8) 8.135
Cleveland – (7-9) 7.282
Houston (9-7) 9.448
Indianapolis – (8-8) 7.698
Tennessee (6-10) 6.226
Jacksonville (6-10) 5.814
Denver – (10-6) 10.082
San Diego – (8-8) 7.864
Kansas City – (7-9) 6.655
Oakland – (6-10) 6.33
NY Giants (9-7) 9.238
Washington (9-7) 8.772
Dallas (8-8) 7.771
Philadelphia (6-10) 6.367
Chicago (9-7) 8.978
Green Bay (8-8) 8.439
Minnesota (8-8) 8.078
Detroit (7-9) 7.365
Atlanta (9-7) 9.205
Carolina (8-8) 7.820
New Orleans (8-8) 7.677
Tampa Bay (7-9) 7.516
San Francisco (10-6) 10.150
Seattle (10-6) 10.071
St. Louis (8-8) 7.735
Arizona (7-9) 6.612
1. New England
2. Denver
3. Houston
4. Baltimore
5. Cincinnati
6. Pittsburgh
1. San Francisco
2. NY Giants
3. Atlanta
4. Chicago
5. Seattle
6. Washington
Houston beats Pittsburgh 23-19
Baltimore beats Cincinnati 23-20
Atlanta beats Washington 27-24
Seattle beats Chicago 21-17
New England beats Baltimore 31-26
Denver beats Houston 24-23
San Francisco beats Seattle 21-20
Atlanta beats NY Giants 24-22
New England beats Denver 30-26
San Francisco beats Atlanta 24-21
New England beats San Francisco 28-27