• First of all, I stand by everything I said in my previous post about Football Outsiders, but I guess there is more to add.  Turns out that there is a student here who used to intern for Football Outsiders, and he pointed me to the methods section on their website where they say this:

    Field goal kicking is measured differently. Measuring kickers by field goal percentage is a bit absurd, as it assumes that all field goals are of equal difficulty. In our metric, each field goal is compared to the average number of points scored on all field goal attempts from that distance over the past 15 years. The value of a field goal increases as distance from the goal line increases.

    I agree completely with this.  But you need to mention this fact or at least link to it even when you are describing the basics.  Schatz tweeted this, among other things, to me (thanks for the mention):

    Screen Shot 2013-10-07 at 3.32.12 PM

    That’s not it at all.  There is a difference between simplifying your explanation of a complex statistical concept to a non-expert lay audience and simplifying your analysis to a point that renders your conclusions meaningless.  Leaving out the fact that you are controlling for the distance of the field goal shouldn’t disappear when they are trying to write a simple summary.  It’s an essential piece of the analysis, without which, renders all of your conclusions about place kicking meaningless.  And in reading just the FO Basics it’s not clear at all that they are actually controlling for distance or anything else.

    Maybe this is my fault for not reading more about the methods, but I tend to think that the onus is on Football Outsiders to make it clear, even in their simple summary, that they are controlling for field goal distance.  But there is still the issue of why this wasn’t mentioned in the NY Times article either.

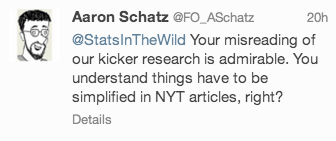
    Schatz argues that they left the fact that they were controlling for field goal distance out of the NY times article for the purpose of simplicity.  Or in his tweeted words:
    Screen Shot 2013-10-08 at 8.49.20 AM

    Sure, I understand that things have to be simplified for a larger audience, but this is the NY Times.  They published this article, for example, in 2007 about statistics that are misleading when you don’t properly control for explanatory variables.  So, I think it would have been alright to explain in the NY Times that kicking distance is controlled for because without controlling for kicking distance, the conclusions are meaningless.  We’re also talking about the same NY Times that hosted Nate Silver’s blog until recently!

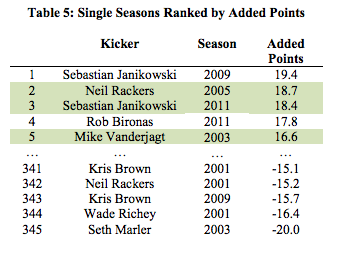
    Finally, even when controlling for field goal distance (and possibly other factors), I’m still not convinced that the ability of a place kicker varies randomly from year to year, though I don’t have any hard analysis (right now) to back this up.  Though, Mike Lopez pointed me to this article from Sloan analyzing field goal kicking, and if you look at Table 5 there is some evidence that kickers’ abilities, at least some kickers’ abilities, are consistent from year you year.  If kicker ability was changing dramatically from year you year we wouldn’t expect to see Janikowski twice in the top five best seasons or see Kris Brown twice in the bottom five seasons.  This is certainly not proof that kicker’s performance from year to year is highly variable, but it also doesn’t support that argument either.
    Screen Shot 2013-10-08 at 8.36.38 AM

    I would be very interested to see the full analysis that Football Outsiders performed to reach this conclusion, as I think it would be interesting to try and reproduce this.

    Cheers.

    P.S. I will once again state for the record, that I enjoy Football Outsiders and read it regularly.

  • (Update: October 13, 2013 – See the full analysis here)

    I was reading the Football Outsiders basics, and I got to this part about field goal kickers:

    Field-goal percentage is almost entirely random from season to season, while kickoff distance is one of the most consistent statistics in football.

    This theory, which originally appeared in the New York Times in October 2006, is one of our most controversial, but it is hard to argue against the evidence. Measuring every kicker from 1999 to 2006 who had at least ten field goal attempts in each of two consecutive years, the year-to-year correlation coefficient for field-goal percentage was an insignificant .05. Mike Vanderjagt didn’t miss a single field goal in 2003, but his percentage was a below-average 74 percent the year before and 80 percent the year after. Adam Vinatieri has long been considered the best kicker in the game. But even he had never enjoyed two straight seasons with accuracy better than the NFL average of 85 percent until 2011, when he followed up his 26-for-28 2010 campaign by going 23-for-27 (85.2 percent).

    On the other hand, the year-to-year correlation coefficient for kickoff distance, over the same period as our measurement of field-goal percentage and with the same minimum of ten kicks per year, is .61. The same players consistently lead the league in kickoff distance, particularly Billy Cundiff, Olindo Mare, and Stephen Gostkowski.

    In the New York Times article that they cite, “NFL Kickers Are Judgers on the Wrong Criteria”, they say:

    There is effectively no correlation between a kicker’s field-goal percentage one season and his field-goal percentage the next. But average kickoff distance shows more consistency from season to season than almost any other individual statistic in the N.F.L.

    So, let’s sum this up.  Football Outsiders is saying that they have discovered that field goal percentage from year to year is incredibly inconsistent, that this “theory” is “controversial”, and that kick-off distance “shows more consistency from season to season than almost any other individual statistic in the N.F.L.”

    I wouldn’t describe this as either a “theory” or “controversial”.  If you’ve taken any statistics class beyond Intro Stat, this should be totally expected.  It would be strange if this wasn’t the case, and the explanation is incredibly simple.  Field goals are attempted from different distances at different angles with 11 300+ pound men trying to kill you.  There are many variables.  Kick-offs are are taken from the same spot every time and no one is trying to kill you.  Less variables.

    In general, you shouldn’t compare rates like this when you aren’t controlling for other factors that may affect the rates.  I’ve written about this before in response to former Football Outsiders writer Bill Barnwell’s “study” of mortality rates of football players versus baseball players.   He shows, correctly, that baseball players have a higher mortality rate than football players, however, he failed to control for age.  The cohort of baseball players that he considered was on average older than the football players.  So, essentially what Barnwell (who is still blocking me on Twitter) demonstrated is that older people die more often than younger people.  (And of course this isn’t even considering the fact that he should have been using survival analysis techniques and looking at survival times rather than comparing mortality rates, which is usually not advisable.)

    Football Outsiders seems to be making the same mistake with their field goal “theory” (and since Barnwell used to write for FO, I suppose it could just be Barnwell making the same mistake.)  Let’s take a look at the variability of field goal attempts for kickers from year to year.  To do this, I’ve created a Shiny app displaying boxplots of field goals attempts for NFL kickers with green dots for distances of made field goals and Red dots for misses.  Take a look at Mike Vanderjagt below:

    Screen Shot 2013-09-23 at 11.46.09 PM

    Recall, that this is what FO says about Vanderjagt in support of their argument that field goal percentage is inconsistent from year to year.

    Mike Vanderjagt didn’t miss a single field goal in 2003, but his percentage was a below-average 74 percent the year before and 80 percent the year after.

    You’ll notice in the graph that in 2003, Vanderjagt’s median distance of a field goal attempt was 31 yards the year that he made all of his kicks.  In the previous year, 2002, his median kick distance was 9 yards longer and in 2004 his median kick distance was 34 yards.  By directly comparing rates, without considering distance of the kicks, the comparison is completely meaningless.

    Football outsiders says, in their FAQ:

    Q: What are we talking about here?

    Football Outsiders brings you a series of brand new, in-depth statistics you can’t find anywhere else.

    I don’t quite know what is meant by “in-depth statistics”, but between this kicking “theory” and former FO writer Barnwell’s mortality “study” at Grantland, I don’t really have much faith in Football Outsiders’ ability to correctly apply introductory/intermediate statistical concepts to football data.  Now, everyone makes mistakes, but these seem like unbelievable simply ones to make for a website whose major selling point is applying statistical concepts to football.

    Cheers.

    P.S.

    All this being said, I do read Football Outsiders, and I enjoy their writing. But I am highly skeptical of all of their statistical analysis.

  • I’ve recently converted to R Studio for R package development and I love it.  As someone who doesn’t really understand the details of git, it makes git incredibly easy to use (And git is DEFINITELY worth using!)  However, when you check a package in R for upload to CRAN, you need to use the –as-cran option, which R studio does not use by default.  Though you can set it to be your default.  The screen shots of how to do this are below.  Cheers.

    Screen Shot 2013-09-27 at 2.20.28 PM

    Screen Shot 2013-09-27 at 2.20.50 PM

  • Deadspin announced today on their website that they are starting something called “Regressing“.  They describe it as “Deadspin in a lab coat.”  This sounds awesome.

    Cheers.

  • The NFL sent out this memo to its fans this morning. It’s too much to take.  Here, I dive in.

    The NFL season is off to another exciting and competitive start.

    Well, not quite. The Jaguars measure as the worst team through four games in recent NFL history, and the Broncos have been so good that Yahoo! contemplated what the point-spread were to be if they were to play Alabama.  Let’s move on.

    As a league, we have an unwavering commitment to player health and making our game safer at all levels.

    Notice the phrase used here (“we have”) instead of the the phrase which should’ve been used but can’t be used because it’d be a lie (“we have always had”)

    We hope that our commitment to safety will set an example for all sports.

    Yup. Hard not to see David Stern, Bud Selig, and Gary Bettman with their notebooks and #2 pencils out, truly impressed with how the NFL has handled things.

    There have been numerous safety-related rules changes going back decades: from the 
    1970s when we eliminated the head slap

    That must’ve been a tough call. Although, to the NFL’s credit, baseball may still be having this issue. 

    to the 80s when we eliminated clubbing

    Pretty sure this isn’t out of the game. Just ask Jacoby Jones.

    ...to the 90s when we increased protection for defenseless players, to the 2000s when the horse collar 
    tackle was made illegal.

    The same 1990’s when you hired a rheumatologist to lead your concussion panel? And the same 2000s when that rheumatologist published bogus crap after bogus crap in Neurology?  Quite committed, NFL!

    We will continue to find ways to protect players so they can enjoy longer careers on the field and 
    healthier lives off the field.

    Which of course is why you’re quitly pushing an 18-game schedule.

    Recently, Hall of Fame coach John Madden, who co-chairs our Player Safety Advisory Committee, told me 
    that players and coaches have truly adjusted to the new, safer rules. Coach Madden said the players 
    are back to the fundamentals of blocking and tackling, using the shoulder rather than the head. As a 
    result, the game is safer.

    This is my favorite part. Like I read it and thought I had misread it. Who better to comment on NFL player safety than a 77 year-old who retired from the sport four years ago and probably watches a game a week from his television. Like someone in the NFL office said “you know what, we could really convince people that there’s nothing to see here if we get John Madden to say there’s nothing to see here. HE HAS A VIDEO GAME!!!”

    We work closely with the NFL Players Association to ensure our players have access to the finest 
    doctors and most cutting edge technology.

    This must be a new practice. Again, the NFL investigated concussions as far back as the mid 1990’s. Unfortunately, their finest concussion doctor was a rheumatologist who was employed by an NFL organization (the Jets), and their investigation was entirely based on saving its own ass. Quoting the new book, “League of Denial,” the investigation dismissed the matter as a “pack journalism issue” and claimed that the NFL experienced “one concussion every three or four games,” which he said came out to 2.5 concussions for every “22,000 players engaged.”

    We have supported youth concussion laws that have now been adopted in 49 states.

    Two things here. First, obviously the league is going to support youth concussion policies. Not really that incredible. Second, what one state is behind the 8-ball here?

    We have pledged more than $100 million to medical research over the next decade.

    You pledged money already. But the research wasn’t impartial.

    Including $30 million to the National Institutes of Health for independent research to advance the 
    understanding of concussions.

    All of the money should be going to independent research, not a third of it. Also, not a great time to be citing the NIH.

    We have also embarked on a $60 million partnership with GE and Under Armour to accelerate the 
    development of advanced diagnostic tools and protective materials for head injuries.

    This research endeavor is surprising, because If the NFL was that serious about its helmets, the league could start by making players wear safest ones. Instead, it doesn’t.  Quoting from the New York Times, even as head injuries have become a major concern, the N.F.L. has neither mandated nor officially recommended the helmet models that have tested as the top performers in protecting against collisions believed to be linked to concussions. Some players choose a helmet based on how it looks on television, or they simply wear the brand they have been using their whole career, even if its technology is antiquated. 

    That’s amazing. Players can choose their own helmets based on how they look, not based on safety. But hey, who cares, the league outlawed clubbing in the 1980’s!  And why worry about player safety when real safety DeAngelo Hall is sporting Lacoste during an interview!

    The future of football is brighter, bigger, better, and more exciting than ever.

    I’m not sure. One study in the Washington Post, cited a study which found an 11 percent decline in tackle football’s “core” participation the past three years.

    For more information on our health and safety work, go to www.nflevolution.com

    Love this website choice. For any fans of “The Office,” this reminds me of Dunder Mifflin Infinity: take the same name as the original product, and add on a fancy word (evolution or infinity)…it’s a can’t miss!

    My conclusions? The NFL is covering its own negligence. I’d just appreciate it if the league flat-out admitted that it was wrong.

    Why do I seem to care so much?  Well, for starters, I played four years of college football (this is me, a few pounds ago). Across football, and not just the NFL, players just went back in after getting concussions. You were kind of essentially considered to be a frisbee player if you didn’t. And I can’t help but think that if the league had properly conducted its research when in pretended to in the 1990’s, the game wouldn’t have had to wait to 2013 to invoke the rule and safety changes necessary to the game safer.

    Moreover, I love the scientific research (or lack thereof) which is intertwined in league policy. The efforts the league made in the 90’s and 2000’s were embarrassing. From a statistics standpoint, their examples of “the players went back in, so there must be no long term concussion effects” are great for showing how not to do science. Why did the players go back in? Because they thought they had to!

    Further, for all researchers, the negligence shown by the journal Radiology (for more info, click on this book excerpt…but the bottom line is that the journal wanted readership so it allowed terrible research to be published) and the bias shown by the NFL’s investigators, each of whom had a vested interest in proving that concussions were not causing long-term damage, is a reminder to us all about the importance of those conflict of interest forms that keep popping up, and that the peer-review process, while important, isn’t always perfect.

  •  


    One of my students tweeted this at me today.  I think it is awesome.  But I suppose this also means they aren’t paying attention to me.  But still, this is awesome.  So I guess it’s ok that they aren’t paying attention if they are creating brilliant images like this.

    GregPirate


    Argggghhhhhhh and Cheers.

  • About two weeks ago, I used some familiar metrics to analyze how analytics-based websites performed as far as predicting MLB win totals. With the regular season now complete, winning bets have been cashed, and the official performance for each site is listed below:

    O/U: The Hilton’s over/under for each team

    BP: Baseball prospectus

    TR: Team Rankings (caveat on the linked page: the site stresses their MLB predictions are a work in progress)

    DP: Davenport

    Zips: ZIPS projection system (espn.com)

    PM: Prediction Machine

    TB: Trading bases, an avid blogger and book-writer

    Here are my metrics

    MSE: Averaged squared error between the prediction and the win totals (lower is better)

    MAE: Averaged absolute error between the prediction and the win totals (lower is better)

    Corr: Correlation between the predicted and the win totals (higher is better)

    Results

    O/U BP TR DP Zips PM TB
    MSE 82.65 74.40 98.60 85.43 87.53 94.27 71.53
    MAE 7.37 7.33 8.40 7.37 7.40 7.86 6.93
    Corr 0.66 0.70 0.58 0.64 0.64 0.59 0.71

    Baseball Prospectus and Trading Bases appear to offer the only clear advantage over the Las Vegas line, at least among these predictions, as judged by a higher correlation and a lower MSE between observed and predicted values. On average, TB was the only prediction site to finish, on average, within seven wins of the actual results.

    A savvy bettor would’ve finished 12-9 on bets where BP differed by the Las Vegas O/U by more than two wins, and 10-6 using the same cutoff for TB. Picks that BP and TB agreed (by more than 2 predicted wins) on finished 7-4

    Here are the Vegas lines and each site’s picks. In some cases, the projected total wins might not add up to 82 per team, most likely due to rounding errors.

    Team O/U BP TR DP Zips PM TB Actual
    Diamondbacks 82.5 85 83 81 85 76.8 80 81
    Braves 86.5 83 85 85 91 86.6 82 96
    Orioles 78.5 75 81 75 82 79.2 76 85
    Red Sox 82.5 85 79 85 84 80.5 83 97
    Cubs 72.5 77 73 76 74 75.8 69 66
    White Sox 80.5 76 83 76 80 85 78 63
    Reds 90.5 92 84 86 90 91.1 84 90
    Indians 78.5 80 74 79 80 76.8 85 92
    Rockies 71.5 71 75 74 70 77.5 70 74
    Tigers 92.5 91 86 95 91 89.7 95 93
    Marlins 63.5 67 75 65 65 65.3 64 62
    Astros 58.5 63 67 72 57 62.5 66 51
    Royals 78.5 76 78 80 79 75 77 86
    Angels 91.5 91 86 91 93 93.3 88 78
    Dodgers 91.5 91 83 88 90 90.6 91 92
    Brewers 81.5 78 83 78 81 77.6 78 74
    Twins 68.5 65 74 69 66 70.9 66 66
    Mets 75.5 80 78 76 66 76.8 74 74
    Yankees 86.5 91 90 86 83 84.7 87 85
    Athletics 84.5 83 86 84 78 85.3 85 96
    Phillies 85.5 81 84 81 82 81 86 73
    Pirates 77.5 80 77 81 77 74.8 79 94
    Padres 73.5 76 78 76 73 72.7 81 76
    Giants 87.5 85 85 92 87 85.1 88 76
    Cardinals 82.5 85 86 83 85 85.1 90 97
    Rays 86.5 87 88 86 88 89.5 93 91
    Rangers 86.5 89 88 85 91 86.8 85 91
    Blue Jays 88.5 84 78 86 94 87.5 82 74
    Nationals 91.5 87 86 85 94 92.5 90 86
    Mariners 77.5 78 79 73 74 74 78 71
  •  


    Check out this graphic from the New York Times.  Eli Manning has now started 150 games in a row for the Giants.  That’s pretty hard to grasp.

    Screen Shot 2013-09-30 at 2.55.56 PM


    Cheers.


  • I attended the New England Symposium of Statistics in Sports (NESSIS) last Saturday at Harvard Science Center (See the sweet logo below) where I presented a poster.  The conference was organized by Mark Glickman and Scott Evans Scott Evans

    NESSIS Logo

    My poster (see below) was about openWAR, which is  a project I am working on with Ben Baumer and Shane Jensen.  Our goal is to create a completely open source version of wins above replacement (WAR) based entirely on publicly available data.  We’ve implemented openWAR in R and the package is currently available on github here: openWAR.  When we think it’s ready for primetime, we’ll be putting in on CRAN.

    poster

    I missed the first featured session because it was at 9:30am, and that’s not how I roll on Satudays.  During the parallel sessions at 11:30am, I decided to attend the non-NBA series of talks.  The first talk was by Robert Carver and he talked about R.A. Dickey and the curveball.  He was followed by Stephanie Kovalchik who gave an interesting talk about trends in tennis intensity.  She had a lot of really interesting data visualizations of tennis trends over the past few decades, but I can’t seem to find them online.  If anyone knows where I can find there, please point me in the right direction.  After her, Dennis Lock gave a talk about using random forests to estimate win probability.  At the end of the day I was trying to explain random forests to someone from ESPN (how awesome is that sentence), and I knew that random forests were essentially regression trees based on bootstrapped samples.  When I went to look this up to make sure I wasn’t lying about random forests, I found out that at each step the set of predictors in the regression tree is randomly chosen.  I did not realize this, but makes total sense.  Otherwise, the trees in the forest would all be very similar. So I learned something, and isn’t that the whole point of these conferences?

    The final talk in this session was by Michael Pane who was attempting to cluster pitches based on pitch F/X data and improve classification of MLB pitches.  They call their procedure CLUMPD and they made a sweet interactive shiny app.  But I didn’t write down the URL,  and I can’t seem to find it by googling it.  Hopefully when they post the slides, the link will be in there.

    Following the session I ate lunch with Ben Baumer, Mike Lopez, and one of Mike’s friends from UMass on the rocks outside of the Harvard science center.  After lunch I mean to go the the afternoon featured speaker, but I ended up talking to two San Francisco fans about my poster.  I asked them if they were presenting at the conference, and they told me that they didn’t even know the conference was going to be there.  They were just baseball fans in town to see a few Red Sox games and they apparently just stumbled across NESSIS and my poster.  After talking to the two guys from San Francisco, I talked to one of the members of the Tuft’s SABR club about openWAR for the rest of the time allotted for the featured speakers.  After we finished talking the actual poster session started at 3:30.  I met and spoke with a ton of interesting people.

    Here’s a list of some of the interesting people that I talked to while at my poster:

    • Vince Gennaro – Author of Diamond Dollars: The Economics of Winning in Baseball, President of SABR, consultant to MLB teams, all around baseball fanatic
    • Eric Van – Former consultant for the Boston Red Sox
    • Michael Humphries – Author of “Wizardry: Baseball’s All-Time Greatest Fielders Revealed”
    • James O’ Malley – Professor at Dartmouth
    • Andy Andres – Teacher SABR 101 at Tufts
    • Doug Noe –  Professor at Miami (OH) (This was my favorite meeting because I had never met him before, but he told me that he really liked my blog and that I had actually written about him before.)

    Right at the end of the poster session, Eric Van came over to my openWAR poster and criticized our definition of replacement player.  The way that we have defined it, about half of the players we have defined as being in the replacement group are below the average replacement player.  While I’m not sure that this isn’t ok technically, it’s a huge success for our larger idea.  By making openWAR completely transparent people are free to criticize, critique, and complement every single piece of our procedure (and we definitely welcome constructive criticism), rather than gues at what’s going on inside the black boxes of baseball reference and fan graphs WAR.

    NESSIS then closed with a panel discussion.  The panel consisted of Ben Baumer, Eric Van, and Vince Gennaro.  The picture below is the panel, with Carl Morris (you know he’s a big deal cause he’s got a Wikipedia page) saying some words before the discussion began.  The panel was ultimately moderated by Andy Andres.

    One of the interesting points the panel made was that in the beginning of SABRmetrics, a lot of the most interesting work was being done by fans and not necessarily the teams themselves.  This has entirely changed today due to the fact that baseball teams have access to mountains and mountains of data that are simply not available to the public or the public can’t afford.

    Van also pointed out that the numbers don’t tell you everything.  You can’t just view numbers and ignore the personality of players.  For instance, if the numbers say that a guy should hit 6th instead of 2nd, you have to weigh the improvement your team will gain against the psychology of moving a guy from 2nd to 6th in the line-up.  In his words:

    The numbers are just sign posts. You have to actually watch the game to see if you’re onto something. -Eric Van

    The whole discussion was fantastic, and it was really interesting to hear the perspective of three people who have actually worked in baseball as statistical analysts.

    BaumerPanel

    Fantastic overall conference.  See you in 2015!

    Cheers.