This post was written by Tim.
Note- I have decided to make this a two-parter, which is always a great sign. Like that episode of Magnum PI that was continued into an episode of Murder, She Wrote (I hope no one thinks I’m kidding. It happened, and it was terrific.) Part one is mainly a critical look at the article sparking this issue and part two will be my analysis of the situation, because I know where my bread is buttered- the top, duh. Anywho, on to part one.
Dave Cameron is a terrific baseball writer and analyst. I love Dave Cameron. If Dave Cameron was a flavor of ice cream, he’d be Hood’s Green Monster Mint. Dave Cameron does good work, writes in an engaging manner and runs USS Mariner, which is his blog about a shipwreck. He’s also a frequent contributor to David Cone’s favorite website, Fangraphs.com.
Last month, Cameron posted an article entitled “Robinson Cano and Second Base Aging Curves.” The point of the article is that despite lots of anecdotal evidence of second basemen falling off a cliff in their early- to mid-thirties, the evidence is scant and Cano, as an elite player, should age just fine so the Yanks should make him as rich as a king of Europe. Cano will finally be able to afford a computer.
As a side note, I once listened to the ESPN “Baseball Today” podcast, which featured Keith Law (he’d be Phish Food) among others, and was heavy on analysis. ESPN in their unending quest to be the most mediocre sports outlet possible, changed the podcast to “Baseball Tonight” and Buster Olney is the host, and it’s now a bunch of writers telling us the same boring things professional baseball writers tell us, interviewing players who say the same boring things baseball players say and not doing a lick of analysis. During Spring Training, Olney and one of my least favorite Tims, Tim Kurkjian spoke at length about the Cano contract extension situation, and they agreed that the Yankees should go Monty Brewster on him, and just dump all of the money on him. All of it.
But let’s focus on Cameron’s argument, here. Cameron starts by saying that there are number of good, productive second basemen who suddenly stopped being good, productive second basemen. He lists Edgardo Alfonso, Carlos Baerga, Marcus Giles, Chuck Knoblauch, Roberto Alomar and Chase Utley as our anecdotal reference group. And it’s true, these guys all played (or play, for Utley) second, and they all had a precipitous decline. But like Cameron says, it’s anecdotal. And do you know what anecdotes are worth? Not a darned lot. Sorry about my language there, but I get riled up. So let’s get quantifying.
First, Cameron posits that all those guys, your Baergas, your Alfonsos, your Gileses (or maybe that’s a plurale tantum?), were good but not as Cano. Cameron suggests using wRC+ as a measuring stick to find Cano’s peers through age 29 (Cano was 29 years old for most of the 2012 season) and then see how those peers aged out; from there we will see if Cano is a worthy gamble for a contract that would let him finance the John Carter sequel; Cano loved the first movie [citation needed]. For the uninitiated, wRC+ stands for “weighted runs created plus” and a thorough explanation can be found here. The stat accounts for park and league adjustments. It’s a nifty tool to see in one number how good of a batter someone is (it’s worth noting that Cameron is totally avoiding discussion of defense, and I suppose it’s fair. But it’s worth noting it. Much like it’s worth noting that in 2005 he said, of Cano, “In his prime, I think he could hit .280/.320/.400 while playing awful defense. Yipee.” I like the sarcastic Yipee. And, like Fred Dobbs can tell you, figuring out prospects is a tough job.
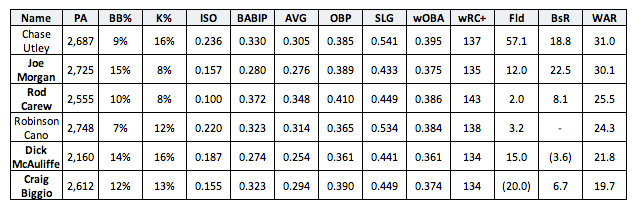
Anywho, Cameron doesn’says, “Over the last 50 years, there have been six second baseman (Cano included) who have put up a 130 wRC+ or better from ages 26 to 29.” That list is:
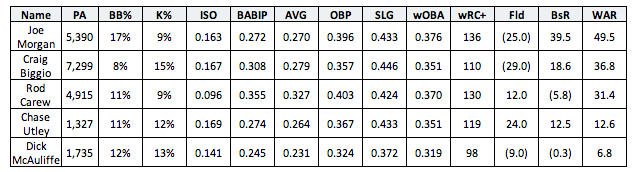
And here are the same players from age 31 on, which are the seasons Cano’s next contract will cover
And here are the trends of those players:
Cameron notes that McAuliffe had the steepest decline, and was cooked at age 34. Cameron goes on to note, “[e]ven including McAuliffe, these five players averaged 3.5 WAR per season after they turned 31. Hardly a group that just fell apart after their prime was over.” Which is fair. Likewise, Cameron is fair by saying Utley, since he’s still active and is 34 in 2013, will likely see a bigger decline in his WAR. Fair all around. And based on what he’s seeing, even if we regress Cano, he expects him to produce 30 WAR for his career after he turns 31, and with inflation and the price of a win, Cano should be worth $210m or more. So go ahead Robbie, buy that superyacht. You’ve earned it via prediction.
Well, let’s actually think about this. First look at that list of CanoComps™. Those are some not-too-shabby folks to hang around. I’d hang around with those guys, if they’d have me. I don’t know what we’d talk about, but we could eat ice cream (real ice cream, not analogue ice cream that is actually baseball writers). I could probably bait Joe into talking about that terrible book Billy Beane wrote. But here’s the thing: I expected more players with some other criteria to show up (in Cameron’s article, not with my second baseman caucus), but this was the whole list. Five dudes.
Even deeper, though, are his criteria to form this five man list: ages 26-29 seasons with a wRC+ of 130 or higher. I think it’s totally fair to say that Robinson Cano has been an elite secondbaseman. Over the time period Cameron is looking at, 2009 to 2013, Cano had the sixth best wRC+ in all of baseball (by the by, Ben Zobrist, incidentally toes the line as number two, following the 2012 AL MVP. Zobrist is criminally underrated.) My issues with the set though are a) Cano had his only below-average year as a major leaguer in 2008, the year before the cutoff and b) wRC+ of 130 is elite, but it’s also extremely exclusive. Additionally, based on Cameron’s criteria we have what I call the “Carew Issue” (it rhymes, which makes it fun. If you don’t find it fun to say “Carew Issue,” I feel like you need to lighten up.) Through age 29, his Rodness was indeed an other-worldly hitter as second basemen. But time played some jokes on Rod Carew; not only is he probably now best known as a line in an Adam Sandler novelty song, he also only played 30 innings at second in the remaining 8797.2 innings of his career. Biggio (whose name does NOT rhyme with “issue,” for the record) is a little more defensible, though he did play 3491 innings at catcher before he switched to second at age 26, he also played his age 37 and 38 seasons in the OF. The problem here is that, if we’re trying to test if second base causes inherent problems for the men who play it, shouldn’t we try to have only second basemen?
And, finally, on our final analysis, Cameron switches from wRC+ to WAR. Both are good options for measuring performances, as far as I’m concerned, but they’re measuring different things. Runs Created, in any of its permutations, measures offensive production; WAR (what is it good for? ISN’T THAT JOKE ALWAYS HILARIOUS? No. it was never funny in any way) measures total production- offense, defense, baserunning (but not grittiness, sorry Justin Upton). Why’s that an issue? Well, if you look at WAR per 600 plate appearances (and I prefer WAR as a rate, rather than WAR, since it is a counting stat), using the same age range for second baseman, my 2B Ice Cream Social has a longer evite list:
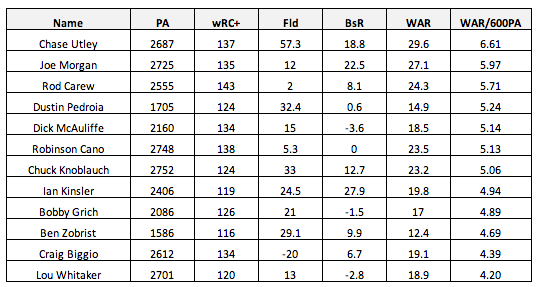
I made my cut off 4 WAR/600PA. Lou Whitaker’s WAR/600PA is about 82% of Cano’s (incidentally, Cano’s is 77% of Utley’s.) So why is this problem matic? Well, outside of having more people, you can see how baserunning and fielding affect the WAR. Cano’s WAR is almost exclusively his offense; his defense is slightly above average (that’s the Fld score, in runs above average, of 5.3) and his baserunning is indeed perfectly average (BsR of 0). Pedroia , a good but not elite offensive player, has the second highest fielding score on the list, after only Utley. Utley, for his part, until age 29, was elite as a hitter, fielder and baserunner (I guess someone was practicing baseball instead of making runs to the White House in AC. That’s what we in the business call local color. Also, maybe I’ll get a free sandwich for the shout out. ) I personally don’t like measuring performance by one metric, and then making our prediction based on another. It’s not unlike having some sort of spaceship race and then measuring performance in how many parsecs it took.
I guess, in the end, there are some issues I have with how Cameron has put together his analysis. I think it’s great to look at comparable players to figure out overall trends, but if we’re so limited by our criteria, we will get almost no meaningful information. His conclusion is based on the careers of five men, one of whom fits the anecdote we’re trying to test, one who’s still in the midst his career (and has thus far actually kinda proved the anecdote), one who’s a first baseman, one who split time between second and center, and the best second baseman of all time. By our highly restrictive criteria, Cameron immediately (and admittedly) eliminated a larger number of guys who played well above average, but sub-elite baseball before they turned 30. If I’m the considering signing Cano, (which I am not, since I’m just a dude not a baseball team) I definitely want to see a great analysis to figure out the risk of drops in performance. Because, sometimes even if the player looks like an all-time great, a gigantic contract can still become something you regret.
I was talking about A-rod there, in case you didn’t catch it.
Also, remember, I really do like and respect Dave Cameron. Heckuva writer.