• Someone recently mentioned to me that strikeouts in the major leagues were at an all time high.  So I did what anyone would naturally do: Write some R code to scrape baseball-reference.com, collect team data for every team over the past 112 years, and plot it.  The results are below:

    Things to notice:

    • The strikeout rate for the first 15 years of the 20th century was relatively flat at around 10%.
    • There have been two major drops in strikeout rates.  The first was from about 1915 through 1920, the second was between the late 1970s through 1980.
    • The first drop in strikeout rates was around the beginning of Babe Ruth’s when power hitting became a more prominent part of the game.
    • The second major drop followed a rules change where the mound was lowered from 15 inches to 10 inches for the 1969 season.
    • These two small periods of rapid decline were both followed by long stretches of slowly increasing strikeout rates.  Strikeout rates steadily climbed from about 1920 through the mid-1960s, and then again from 1980 to present.
    • In 1973 the American League introduced the designated hitter (DH).  Before 1973, the American and National leagues had very similar strikeout rates.  After 1973, one can see a clear separation of the leagues as the National league, not surprisingly, has had a higher strikeout rate than the American league every year since the beginning of the DH era.
    • The team with the highest strikeout rate in the last 112 years was the 2010 Arizona Diamondback who finished 65-97 with a strikeout rate of nearly 25%.  Before 1980, the team with the highest strikeout rate was the 1968 New York Mets.
    • The team with the lowest strikeout rate of the last 20 years was the 2002 Anaheim Angels who won the World Series that year.  Since the mound was lowered, the 1980 Texas Rangers have the distinction of having the lowest strikeout rate for a season.  The lowest strikeout rate for any team since 1901 was the 1901 Boston Americans with a strike out rate just over 5%

    Cheers.

  • Here is an excerpt from Slate.com‘s lexicon valley:

    Is it possible that your writing style is identifiably unique? In the late 1800s, a Polish philosopher named Wincenty Lutosławski imagined a “future science of stylometry,” whereby the singular style of an author could be quite literally measured. In such a future, controversies over authorship would be resolved not by literary scholars but by statisticians, and data would provide the answer. Sounds like pie in the sky, right? But it turns out that Lutosławski was right. Over the past 50 years, stylometrists have fashioned a promising way to identify authorial signatures using something called “lexical glue.” Listen as Bob Garfield and I talk about how a bunch of seemingly inconspicuous words actually stand out.

    It’s almost as if statistics is everywhere.  Oh wait.  It is…

    Cheers.

  • xi'an's avatarXi'an's Og

    Last night, my dear friend George Casella passed away, after a long illness he had fought with his usual determination and optimism. Having known George for 25 years, I am devastated… He was a great father / friend / collaborator / researcher / teacher / editor / runner, and, above all, a great and unique person. The loss is profound, the loss is significant, for me and for us… My thoughts go out to his wife, Anne, and children, Benjamin and Sarah, who are the ones to feel this loss the most keenly.

    (The following is adapted from a recommendation letter George asked me to write when he was considering moving to the University of Florida, Gainesville, from Cornell, a task for which I considered myself completely inadequate. I just hope it carries some of the love and admiration I felt for George.)

    To me, George was the…

    View original post 518 more words

  • R.A. Dickey just pitched his second consecutive one-hitter, which is just the latest feat in what is rapidly becoming the season of the pitchers.  So far this season 9 guys other than Dickey have pitched a one-hittter (E.Santana, Cain, Verlander, Moore, Hammel, CJ Wilson, Vogelsong, Duffy, Felix Hernandez), which brings the total to 11 one-hitters so far this season as of June 19.  This season has also featured 3 no-hitters (Jered Weaver, Johan Santana, and Millwood et al.) and 2 perfect games (Phil Humber and Matt Cain).  So far, in total, there has been 16 games with one or fewer hits.  (Let me remind you that it’s June 19).  To compare, here is a list of complete seasons that had fewer than 16 low hit games: 2008 (15), 2007 (12), 2005 (10), 2004 (11), 2003 (10), 2002 (15), 2000 (11), 1999 (11), 1998 (10), 1996 (10), 1995 (13).  That’s 11 out of the last 17 seasons.  To re-iterate, in 7 of the last 11 completed seasons, their were fewer one hit or fewer games pitched during the entire season than have already been pitched so far in 2012.

    Here is an updated graph for June 19th to include the latest one-hitters by Hammel and Dickey.

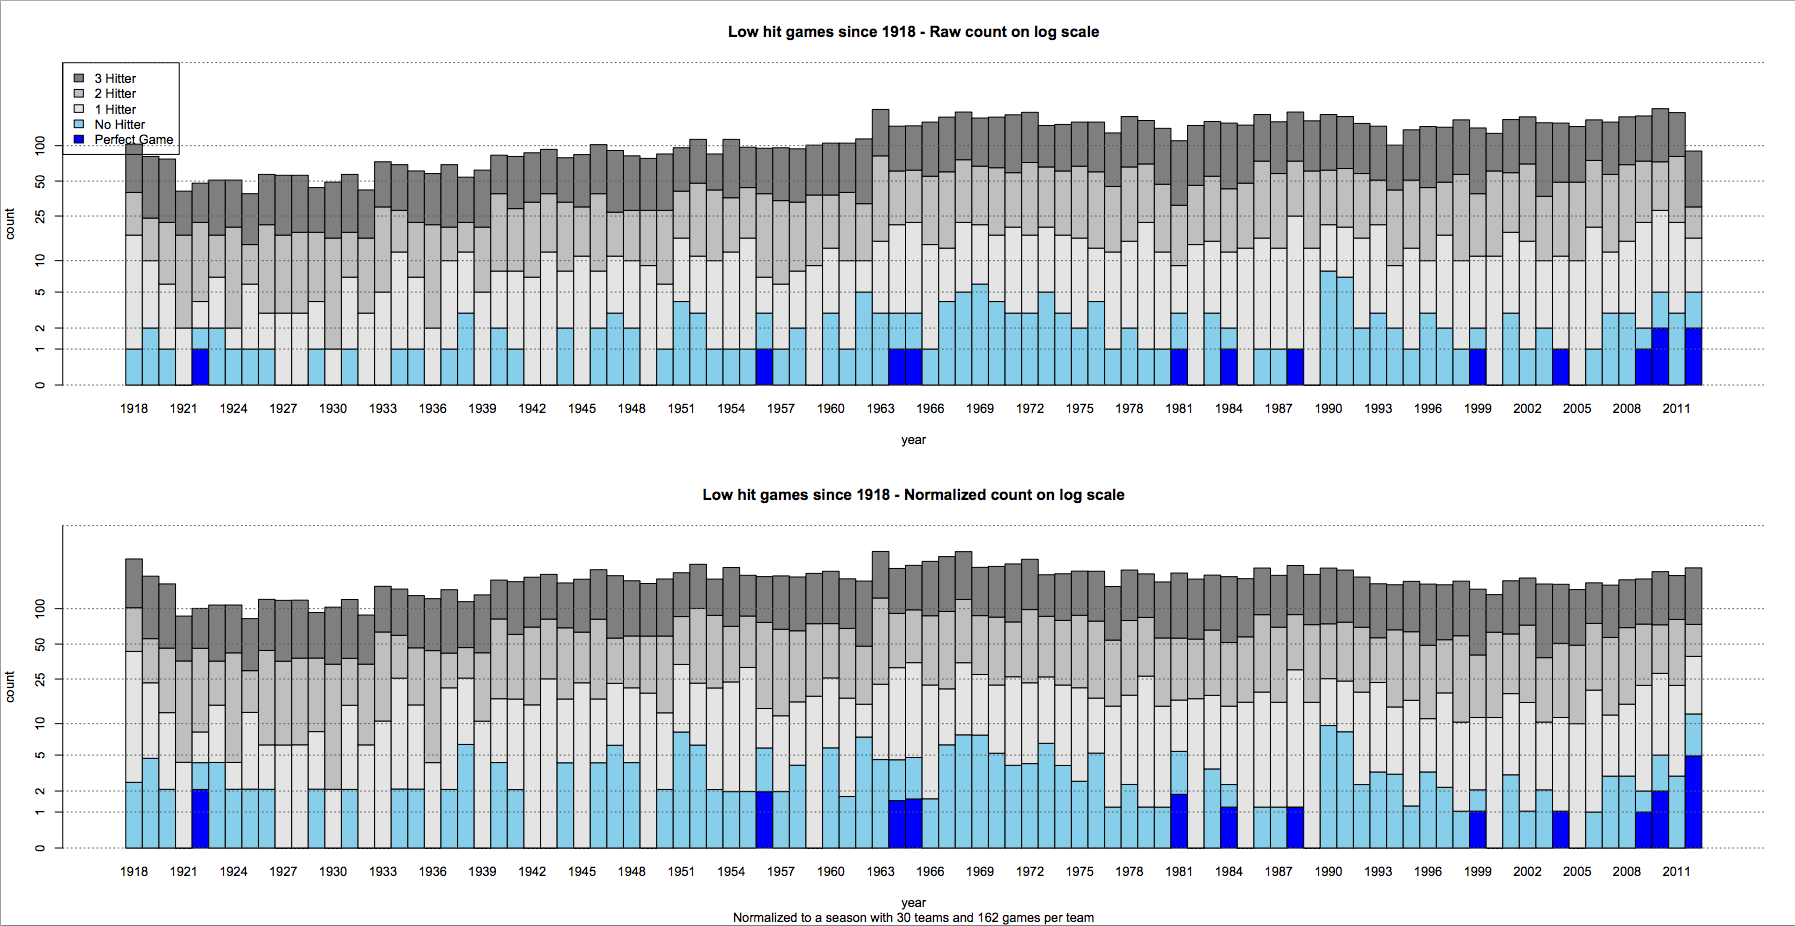
    I’ve also created a graph looking at all games with fewer than 4 hits since 1918 (Note that this graph is on a log-scale).

    Cheers.

  • StatsInTheWild MLB rankings as of June 19, 2012 at 10:37am.  SOS=strength of schedule

    Team Rank Change Record ESPN TR SOS
    NYY 1 ↑1 41-25 2 1 5
    Texas 2 ↓1 41-27 4 3 13
    Tampa Bay 3 – 37-29 7 4 2
    Baltimore 4 ↑4 39-28 18 2 3
    Toronto 5 ↓1 34-33 15 8 1
    Boston 6 ↓1
    33-33 17 10 4
    LA Angels 7 ↑4 36-32 10 9 8
    LA Dodgers 8 ↑1 42-25 1 7 29
    Washington 9 ↓3 38-26 3 5 20
    ChiSox 10 ↓3
    35-32 11 13 14
    Cincinnati 11 ↑2 38-28 6 6 30
    Oakland 12 ↑8 31-36 21 21 28
    Detroit 13 ↑8 32-34 20 17 11
    Atlanta 14 ↓4
    35-32 9 11 17
    St. Louis 15 ↓3
    34-33 12 18 28
    SF 16 ↑2 38-30 8 15 27
    NY Mets 17 ↓1 36-32 13 12 16
    Cleveland 18 ↓4 34-32 14 16 12
    Seattle 19 ↓4
    29-40 25 24 6
    Arizona 20 ↑2 33-34 19 19 24
    Kansas City 21 ↑2 29-36 24 22 10
    Philadelphia 22 ↓3
    31-37 22 23 18
    Pittsburgh 23 ↑1 34-31 16 14 26
    Miami 24 ↓7 33-33 18 20 15
    Milwaukee 25 – 31-36 23 25 25
    Minnesota 26 ↑2
    26-39 27 27 9
    Houston 27 ↓1 28-39 26 26 23
    Colorado 28 ↓1 25-40 28 28 21
    Chic Cubs 29 – 23-44 30 30 22
    San Diego 30 – 24-44 29 29 19

    Past Rankings:

    6/9/2012

    5/28/2012

    5/23/2012

    5/14/2012

    5/7/2012

    4/30/2012

    4/23/2012

    4/16/2012

    4/13/2012

    Cheers.

  • On April 21, 2012 Phil Humber threw a perfect game.  A few days later this was followed up by a no-hitter by Jered Weaver.  Then nearly an entire month passed before we saw another no-hitter thrown by Johan Santana, the first in Mets history.  7 days later, Kevin Millowd and 5 other guys I’ve never heard of combined for one of the more bizarre no-hitters in history. Then less than a week after that Matt Cain pitches the second perfect game of the season.  For those scoring at home, that’s five no-hitters so far this season, two of which were perfect games.  And it’s only June 15.  The seems like a lot.  (NPR agreed and they discussed “Why Are Baseball’s No-Hitters No Longer Rare?” with Stefan Fatsis.)

    So, I wrote some R code and scraped box scores for all games from 1918 through 2012 that are available on baseball-reference.com.  I pulled out all of the perfect, no-hitter, and one hitter games and plotted than by year.  (Note: My graph doesn’t exactly match with the official MLB record of no-hitters.)

    The graph shows two plots.  The top plot consists of the raw counts of perfect games, no-hitters, and one-hit games by year.  However, since fewer games were played in the early part of the 1900s, it’s not a fiar comparison  to compare 1920 to 2012.  The bottom graph attempts to correct this.  Using the rate at which the rare pitching feats were occurring, the bottom half of the graph displays how many of the games there would have been over a 162 games season with 30 teams at the rate for each year.

    You can notice at the far left of the graph their were the most one-hit games in any year over the time period plotted.  This was considered the end of the dead ball era and you can see as the 1920s rolled around many fewer low hit games were pitched over the decade.  You can also see in the 1990s and 2000s that there is a big drop in these low hit games, probably as a result of the steroids era.

    Now it might seem like we are entering a golden age of pitching as.  In the last three years, their have been 5 perfect games (Not even counting Armando Galaraga).  A total of only 22 have ever been thrown and only 20 of those were in the modern era.  At this rate of no-hitters and perfect games so far this season, we are on pace for over 10 no-hitters and about 5 perfect games, both of which would be unprecedented.  The most no-hitters in a season, according to MLB, is 7, which occurred in both 1990 and 1991.  The most perfect games in a season is 2, which happened in 2010 and 2012.

    What strikes me as most interesting about the graph is that if you compare the number of one-hitters projected this season, it is high, but certainly not the most ever.  8 seasons have produced more one-hitters of better than this season is projected to produce when controlling to season length and the number of teams.  What seems to be happening is that the rate of these great pitching outings actually being converted to no-hitters or perfect games seems to be at a very high rate.  I don’t have a reason why this might be happening, but let me throw this idea out there: Do you think that if a game gets to the ninth inning and the pitcher has a no-hitter or perfect game going that umpires are reluctant to make a call that would jeopardize the pitcher’s feat lest they be remembered in the same way as Jim Joyce?  This might explain at least some part the high rate of converting a near no-hitter or perfect game to an actual no-hitter or perfect game this year.  Of course, it’s possible that we’ve seen all of the no-hitters and perfect games that we’ll see this year, and when we look back, it will just be another regular year with an anomalous few months to start the season.

    UPDATE: Jason Hammel just added another 1-hitter tonight taking a no-hitter into the 7th inning where it was broken up by Jason Heyward.

    UPDATE: Dickey just added another 1-hitter.  I’ve updated the graph to reflect this here.

    Cheers.

  • Here is my updated tennis plot of all of the number 1’s post-French Open: The 19 number 1’s.

    Cheers.

  • I was going to write a post about increasing the number of judges in a boxing match to cut down on crazy decisions like what we saw last Saturday, but Ken Pomeroy has already suggested it here: How Crazy Was The Pacquaio-Bradley Decision? Bradley Had A 0.03 Percent Chance Of Being Randomly Judged The Winner.

    Cheers.