• StatsInTheWild MLB rankings as of July 2, 2012 at 10:37am.  SOS=strength of schedule

    The last rankings came out on June 25, and since then the Dodgers have gone 1-6.  Going back two weeks, to June 19, they are 2-11.  As a result of this they fall 8 spots this week, landing them at number 18 in my rankings.  TeamRankings.com has them even lower at 19, and, for some reason, ESPN has them ranked number 4 in their June 25 power rankings.  (I’ll update the ESPN rankings as soon as they are posted.)

    Team Rank Change Record ESPN TeamRankings.com SOS Run Diff
    Texas 1 – 50-30 1 2 13 +100
    NYY 2 – 48-30 2 1 5 +61
    Boston 3 ↑2 42-37 10 6 6 +57
    LA Angels 4 ↑3 44-35 6 4 8 +44
    Toronto 5 ↓1 40-39 17 8 3 +29
    ChiSox 6 ↑2 42-37 13 10 14 +42
    Washington 7 ↑2 45-32 3 3 21 +48
    TampaBay 8 ↓5 41-38 7 9 2 -1
    Baltimore 9 ↓3 42-36 8 5 1 -26
    Oakland 10 ↑1 38-42 20 18 7 -2
    Detroit 11 ↑4 39-40 18 16 11 -7
    Cincinnati 12 ↑1 43-32 5 7 30 +33
    NY Mets 13 ↑3 43-37 11 12 17 +22
    Atlanta 14 – 41-37 12 11 16 +21
    St. Louis 15 ↓3
    41-38 16 17 28 +57
    SF 16 ↑3 45-35 9 14 29 +16
    Cleveland 17 ↑1 40-38 15 15 12 -37
    LA Dodgers 18 ↓8 44-36 4 19 26 +18
    Pittsburgh 19 ↑2
    42-36 14 13 27 +6
    Arizona 20 ↓3 39-39 19 20 25 +13
    Seattle 21 ↓1 34-47 25 23 4 -30
    Kansas City 22 –
    35-42 24 21 10 -37
    Miami 23 ↑1 38-40 21 22 15 -58
    Philadelphia 24 ↓1 36-45 22 26 18 -15
    Milwaukee 25 – 36-42 23 25 24 -11
    Minnesota 26 –
    33-45 27 24 9 -85
    Houston 27 – 32-47 26 27 20 -53
    Colorado 28 – 30-48 28 28 23 -56
    Chic Cubs 29 – 29-49 29 29 19 -71
    San Diego 30 – 30-50 30 30 22 -78

    Past Rankings:

    6/25/2012

    6/19/2012

    6/9/2012

    5/28/2012

    5/23/2012

    5/14/2012

    5/7/2012

    4/30/2012

    4/23/2012

    4/16/2012

    4/13/2012

    Cheers.

  • Here is what I said about the LA Dodgers on May 28, 2012:

    Some comments: ESPN ranking the Dodgers number 1 is an absolute joke.  Yeah, they have the best record in baseball, but they also have the weakest schedule in baseball.  38 of their 47 games so far, almost 81%, have been against teams with a losing record.  That is astonishing.  Ranking the Dodgers number 1 is just one more reason why I don’t trust the “experts” at ESPN.

    The Dodgers built the best record in baseball over the first part of the season by playing teams like Colorado and San Diego.  They are currently 1-11 in their last 12 games in series against Oakland, LA Angels, San Francisco, and NY Mets.  I guess it’s a lot harder to win when you not playing teams that are absolutely terrible.

    Cheers.

  • I was recently reading Gelman’s blog, and he wrote a post about this: Patents Aren’t Only for Engineers.  Apparently, some actuary received a patent for statistical sampling.  The author (is that what they are called?) of the patent, Jay Vadiveloo, is a mathematics professor in residence at the University of Connecticut, and he is quoted in the article as saying:

    To me, the results were astounding: statistical sampling worked.

    At this point, I thought I got the joke and I went to check the date that the article was published expecting to see April 1.  Nope.  May 12 actually.   So, this is serious?  If this is serious, this is — how can I say this nicely — astonishingly…..I have nothing nice to say here.  So I will say nothing.  Congratulations, professor Vadiveloo.

    Gelman goes on to write:

    P.S. Mendelssohn writes: “Yes, I felt it was a heartwarming story also. Perhaps we can get a patent for regression.”

    I say, forget a patent for regression. I want a patent for the sample mean. That’s where the real money is. You can’t charge a lot for each use, but consider the volume!

    This reminded of a conversation I had with a fellow graduate student in statistics who had done an internship at an insurance company over the course of a summer.  They explained to me that someone in the insurance industry had either tried to patent or already had a patent for multiple regression for use in insurance.  Now, I wasn’t sure how true the story was when I heard it, and I’m still not sure how true the story is, but if you can get a patent on sampling, I suppose anything is possible.

    Question for a lawyer:  If someone can get a patent on sampling after it has been around in the statistics literature for a very, very long time, can I just go through more recent statistics literature and just start filing patents on other people’s ideas?

    I’m not actually going to do that, but that is a serious question.  What is preventing me from doing that?

    Cheers.


  • StatsInTheWild MLB rankings as of June 25, 2012 at 4:37pm.  SOS=strength of schedule

    Team Rank Change Record ESPN TeamRankings.com SOS
    Texas 1 ↑1 45-28 1 2 13
    NYY 2 ↓1 43-28 2 1 4
    Tampa Bay 3 – 40-32 7 4 3
    Toronto 4 ↑1 37-35 17 8 1
    Boston 5 ↑1 38-34 10 7 5
    Baltimore 6 ↓2
    41-31 8 3 2
    LA Angels 7 – 40-33 6 6 8
    ChiSox 8 ↑2 38-34 13 14 14
    Washington 9 – 41-29 3 5 21
    LA Dodgers 10 ↓2
    43-30 4 12 28
    Oakland 11 ↑1 35-38 20 18 7
    St. Louis 12 ↑3 38-35 16 17 29
    Cincinnati 13 ↓2 39-32 5 9 30
    Atlanta 14 – 38-34 12 10 17
    Detroit 15 ↓2
    35-37 18 20 11
    NY Mets 16 ↑1 39-34 11 11 16
    Arizona 17 ↑3 37-35 19 19 26
    Cleveland 18 – 37-34 15 16 12
    SF  19 ↓3
    40-33 9 15 25
    Seattle 20 ↓1 31-43 25 24 6
    Pittsburgh 21 ↑2 38-33 14 13 27
    Kansas City 22 ↓1
    31-39 24 21 10
    Philadelphia 23 ↓1 34-40 22 23 18
    Miami 24 – 34-38 21 22 15
    Milwaukee 25 – 33-39 23 26 24
    Minnesota 26 –
    29-42 27 25 9
    Houston 27 – 30-42 26 27 23
    Colorado 28 – 27-44 28 28 22
    Chic Cubs 29 – 24-48 29 30 20
    San Diego 30 – 26-47 30 29 19

    Past Rankings:

    6/19/2012

    6/9/2012

    5/28/2012

    5/23/2012

    5/14/2012

    5/7/2012

    4/30/2012

    4/23/2012

    4/16/2012

    4/13/2012

    Cheers.

  • Simon Raper's avatarDrunks&Lampposts

    If you are interested in this data set you might like my latest post where I use it to make book recommendations.

    This one came about because I was searching for a data set on horror films (don’t ask) and ended up with one describing the links between philosophers.

    To cut a long story very short I’ve extracted the information in the influenced by section for every philosopher on Wikipedia and used it to construct a network which I’ve then visualised using gephi

    It’s an easy process to repeat. It could be done for any area within Wikipedia where the information forms a network. I chose philosophy because firstly the influences section is very well maintained and secondly I know a little bit about it. At the bottom of this post I’ve described how I got there.

    First I’ll show why I think it’s worked as a visualisation. Here’s the…

    View original post 1,003 more words

  • Unfortunately, I missed it, but StatsInTheWild officially hit the 20,000 views all-time three days ago on June 17, 2012.  Congratulations to me.

    Cheers.

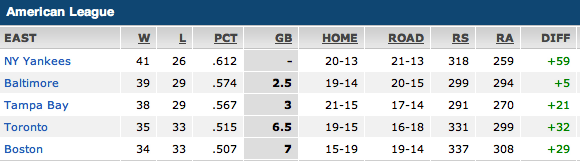
  • Just a reminder that all five of the teams in the American League East have positive run differentials.  That’s one of many reasons why it’s insane that ESPN has Toronto and Boston ranked 15 and 17 in their power rankings.


    I like my rankings or these rankings much better because it appears that some actual thought was put into them beyond just “put the team with the most wins at the top”.  Do you really think the Pirates are better than the Red Sox?

    Cheers.

  • So I had lunch today with two stats post-docs, and the R package ggplot2 came up.  So I started dabbling and here is my first graph.  It’s the same as my one-hitter graph, but instead it was made with ggplot2.  I think it looks a bit more professional.

    Cheers.