Coronavirus and Exponential Growth
I’m continuing to marvel at just how well an exponential model fits the number of confirmed cases of coronavirus. The plot below shows the real number of confirmed cases (on a log10 scale) for Italy, US, Spain, and France to the left of the black vertical line. It’s nearly perfectly linear! To the right of the vertical black line we have the projections should this exponential growth continue. I’ve also provided some basic output from the models for each country, including estimated regression coefficients, R^2 (i.e. how close to exponential is it), and when each country is expect to hit certain number of cases if the current trend were to continue.

Here is what is looks like on the raw scale:
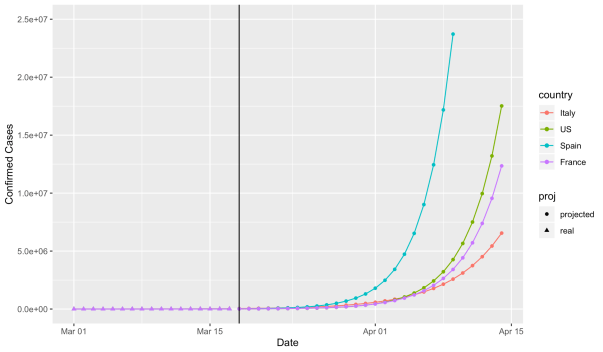
All models are simple linear regression with log(confirmed cases) as the response and time since March 1 as a predictor (i.e. March 1 is 1, March 2 is 2, etc.). Projections are based on the assumption that exponential growth continues as current rates (hopefully this turns out to be a bad assumption!)
United States
Current number of confirmed cases (as of March 17): 6,421
beta = .283 (.275, .290)
growth rate = exp(.283) = 1.327 (1.317, 1.336)
R^2 = .9978 (!!! That’s so exponential!!!!)
Expected to be at X cases:
X = 10,000: March 19
X = 100,000: March 27
X = 1,000,000: April 4
X = 10,000,000: April 13
France
Current number of confirmed cases (as of March 17): 7,699
beta = .257 (.239, .275)
growth rate = exp(.257) = 1.293 (1.270, 1.316)
R^2 = .9846
Expected to be at X cases:
X = 10,000: March 18
X = 100,000: March 27
X = 1,000,000: April 5
X = 10,000,000: April 14
Spain
Current number of confirmed cases (as of March 17): 11,748
beta = .322 (.308, .337)
growth rate = exp(.322) = 1.380 (1.360, 1.401)
R^2 = .9931
Expected (or actual date) to be at X cases:
X = 10,000: March 17 (Actual Date)
X = 100,000: March 24
X = 1,000,000: March 31
X = 10,000,000: April 7
Italy
Current number of confirmed cases (as of March 17): 31,506
beta = .186 (.178, .194)
growth rate = exp(.186) = 1.204 (1.195, 1.214)
R^2 = .9939
Expected to be at X cases:
X = 10,000: March 10 (Actual Date)
X = 100,000: March 23
X = 1,000,000: April 4
X = 10,000,000: April 17
________________________________________________________________
Code can be found here.
Follow me coding on Twitch here.
________________________________________________________________
Cheers!
Posted on March 18, 2020, in Uncategorized. Bookmark the permalink. 2 Comments.

Thank you for posting this, the linear plot tells me almost nothing about the progression. I hope you continue to update this now and then.
Cheers? Well no, but the log plot is welcome, easier to see the progression. I commented once, this may be redundant or not depending on what buttons I did or did not push the first time. Maybe there is just some delay somehow. Please continue to include new data.