I don’t follow soccer/futbol too closely, but I love the World Cup (USA! USA! USA!). I’ve been watching quite a bit of it, and there are two things that are standing out to me.
- It seems like there are a ton of goals being scored
- It seems like there are fewer draws than usual
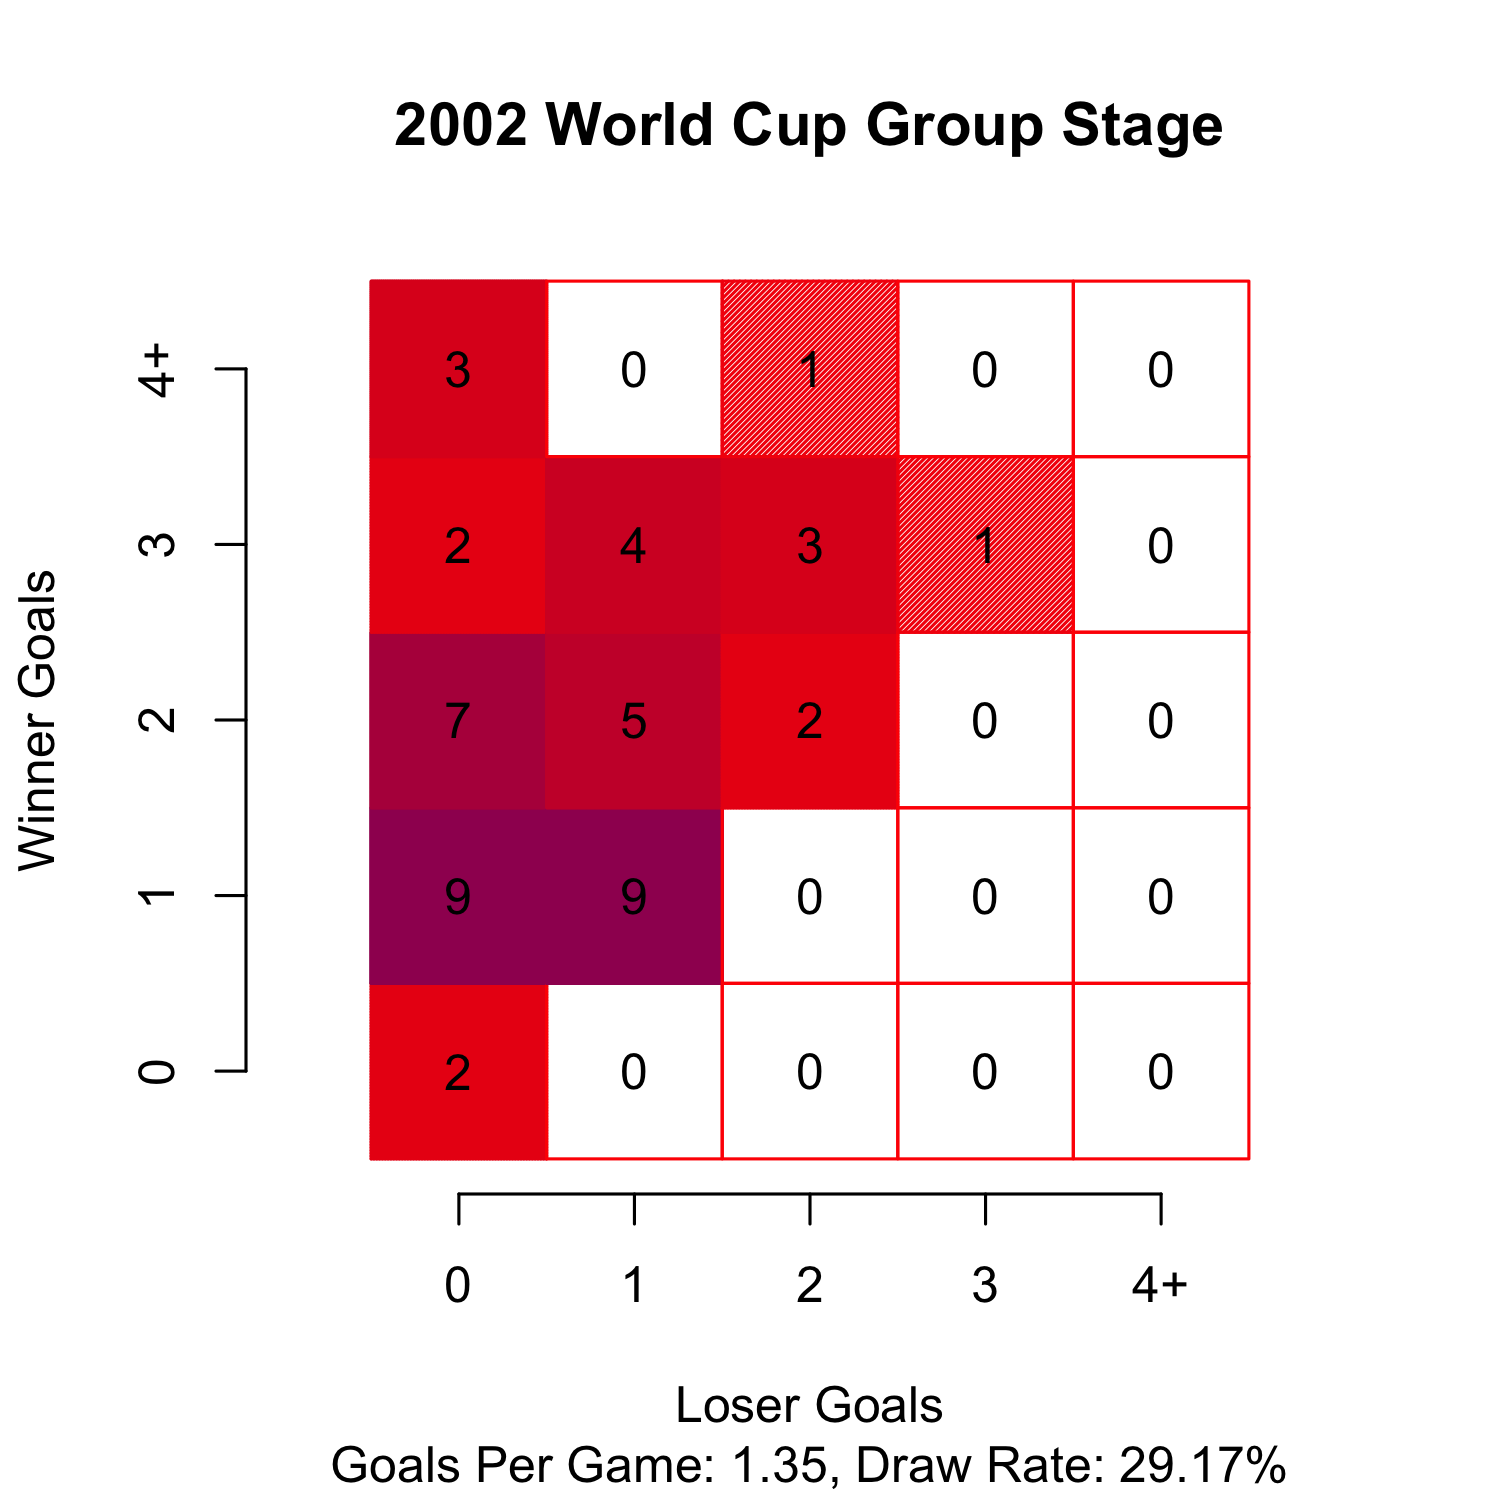
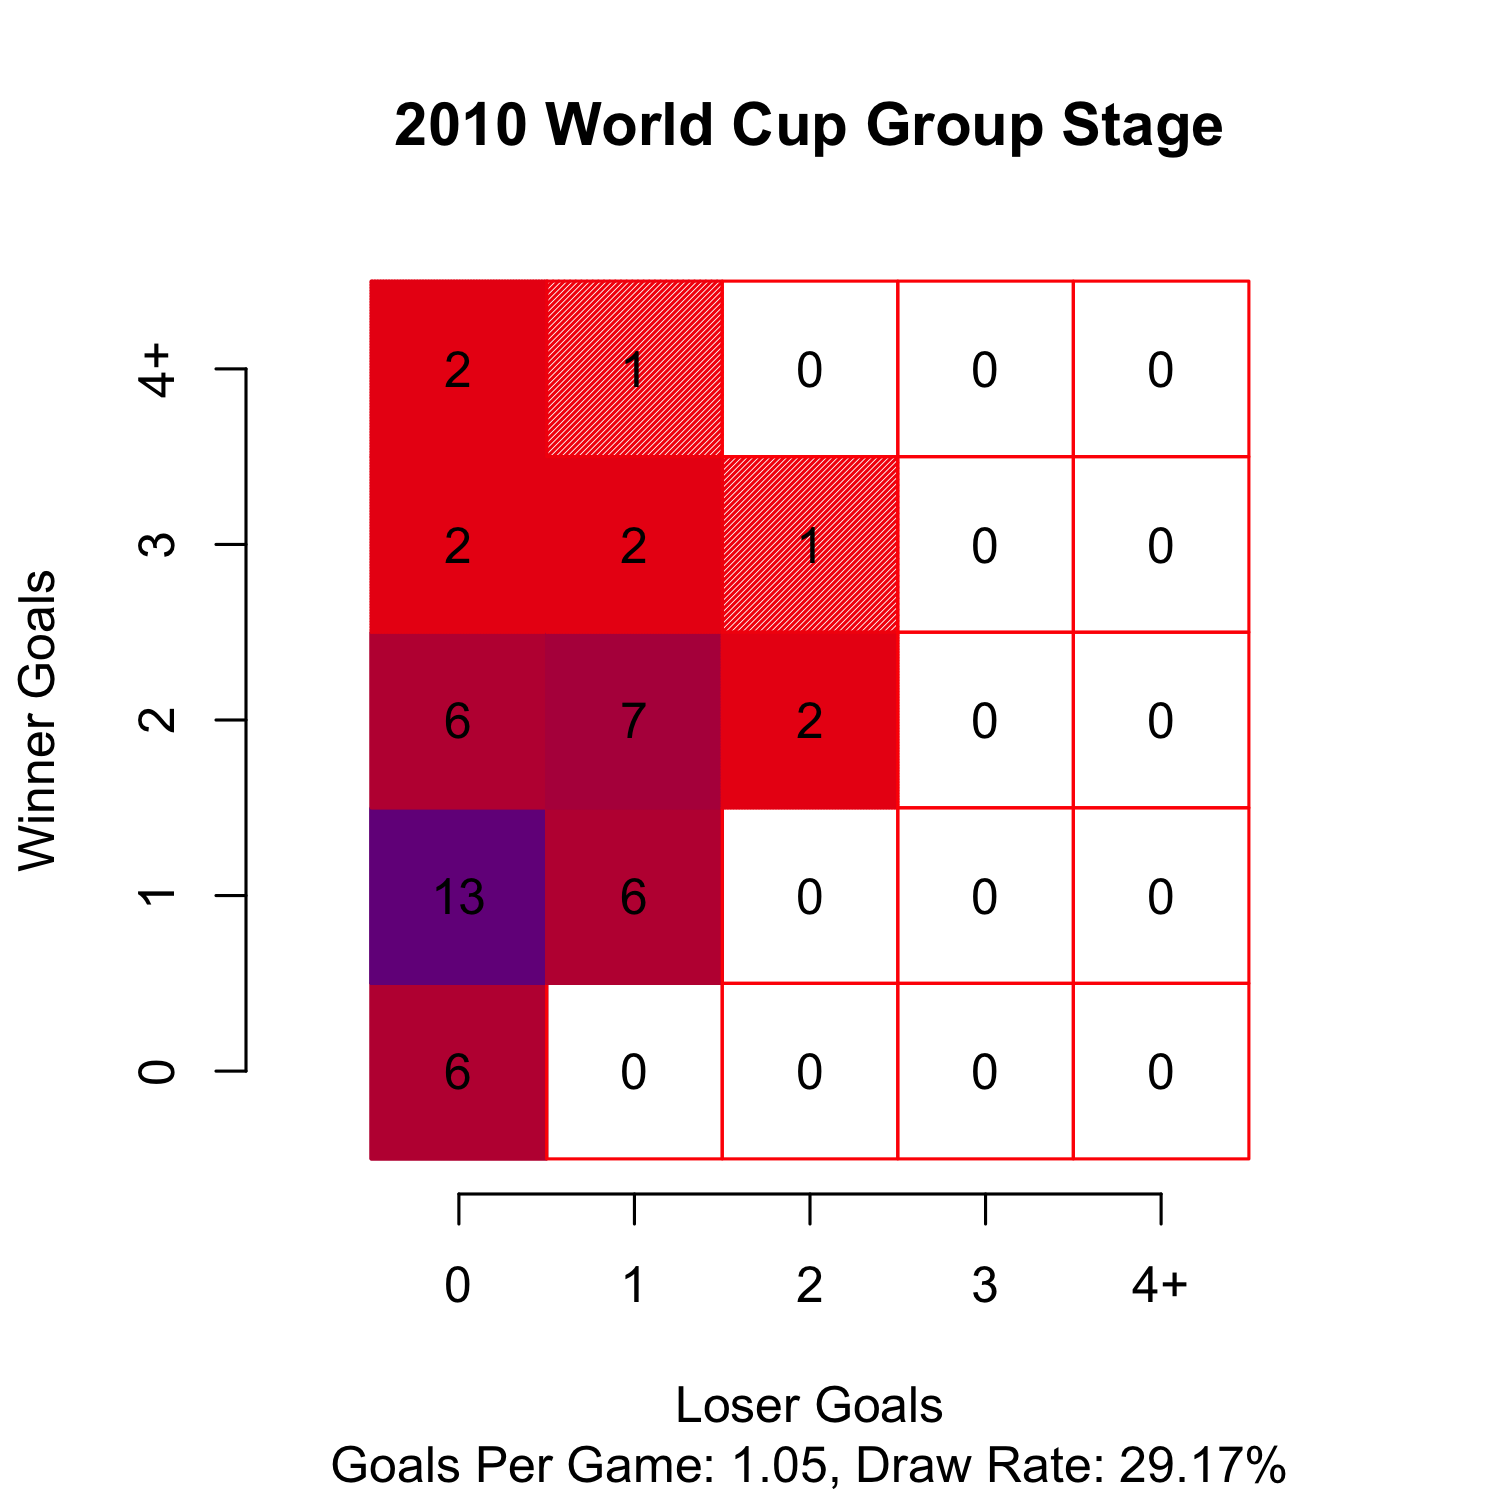
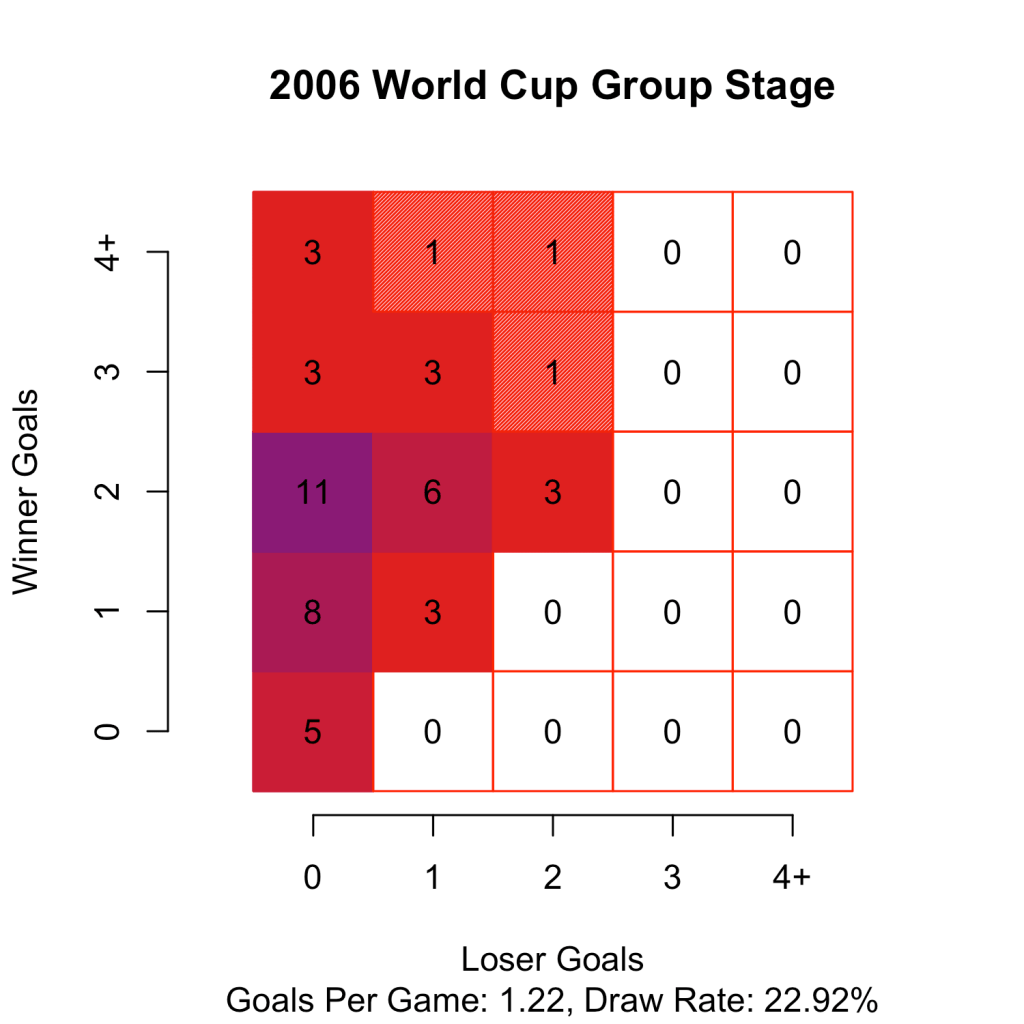
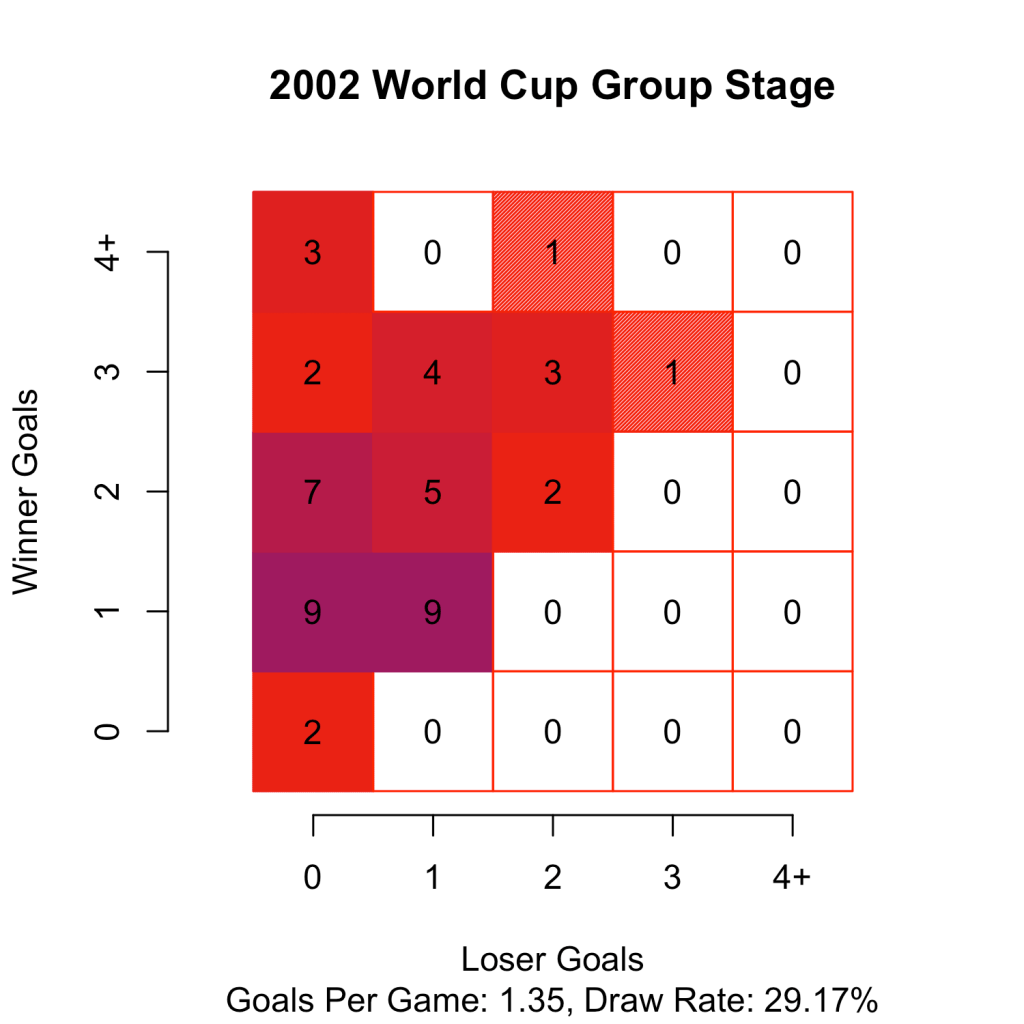
So I went and checked. So far for the 2014 World Cup, the games are averaging 1.57 goals per game and only 7.14% (1 out of 14) of games have ended in a draw. Compare this with the average number of goals scored in the last three World Cups 1.05, 1.22, 1.35 in 2010, 2006, and 2002, respectively. Also compare with the draw rates of 29.17%, 22.92%,29.17% from 2010, 2006, and 2002, respectively.
So, up to this point the summary of the World Cup is tons of goals, very few draws. Even American’s can enjoy that!
Cheers.


Leave a comment