Tons of goals; very few draws (Updated)
I previously posted about how many goals were being scored in this World Cup, and now I’ve updated it through todays games. I’ve also expanded the grid to 5 x 5 per request.
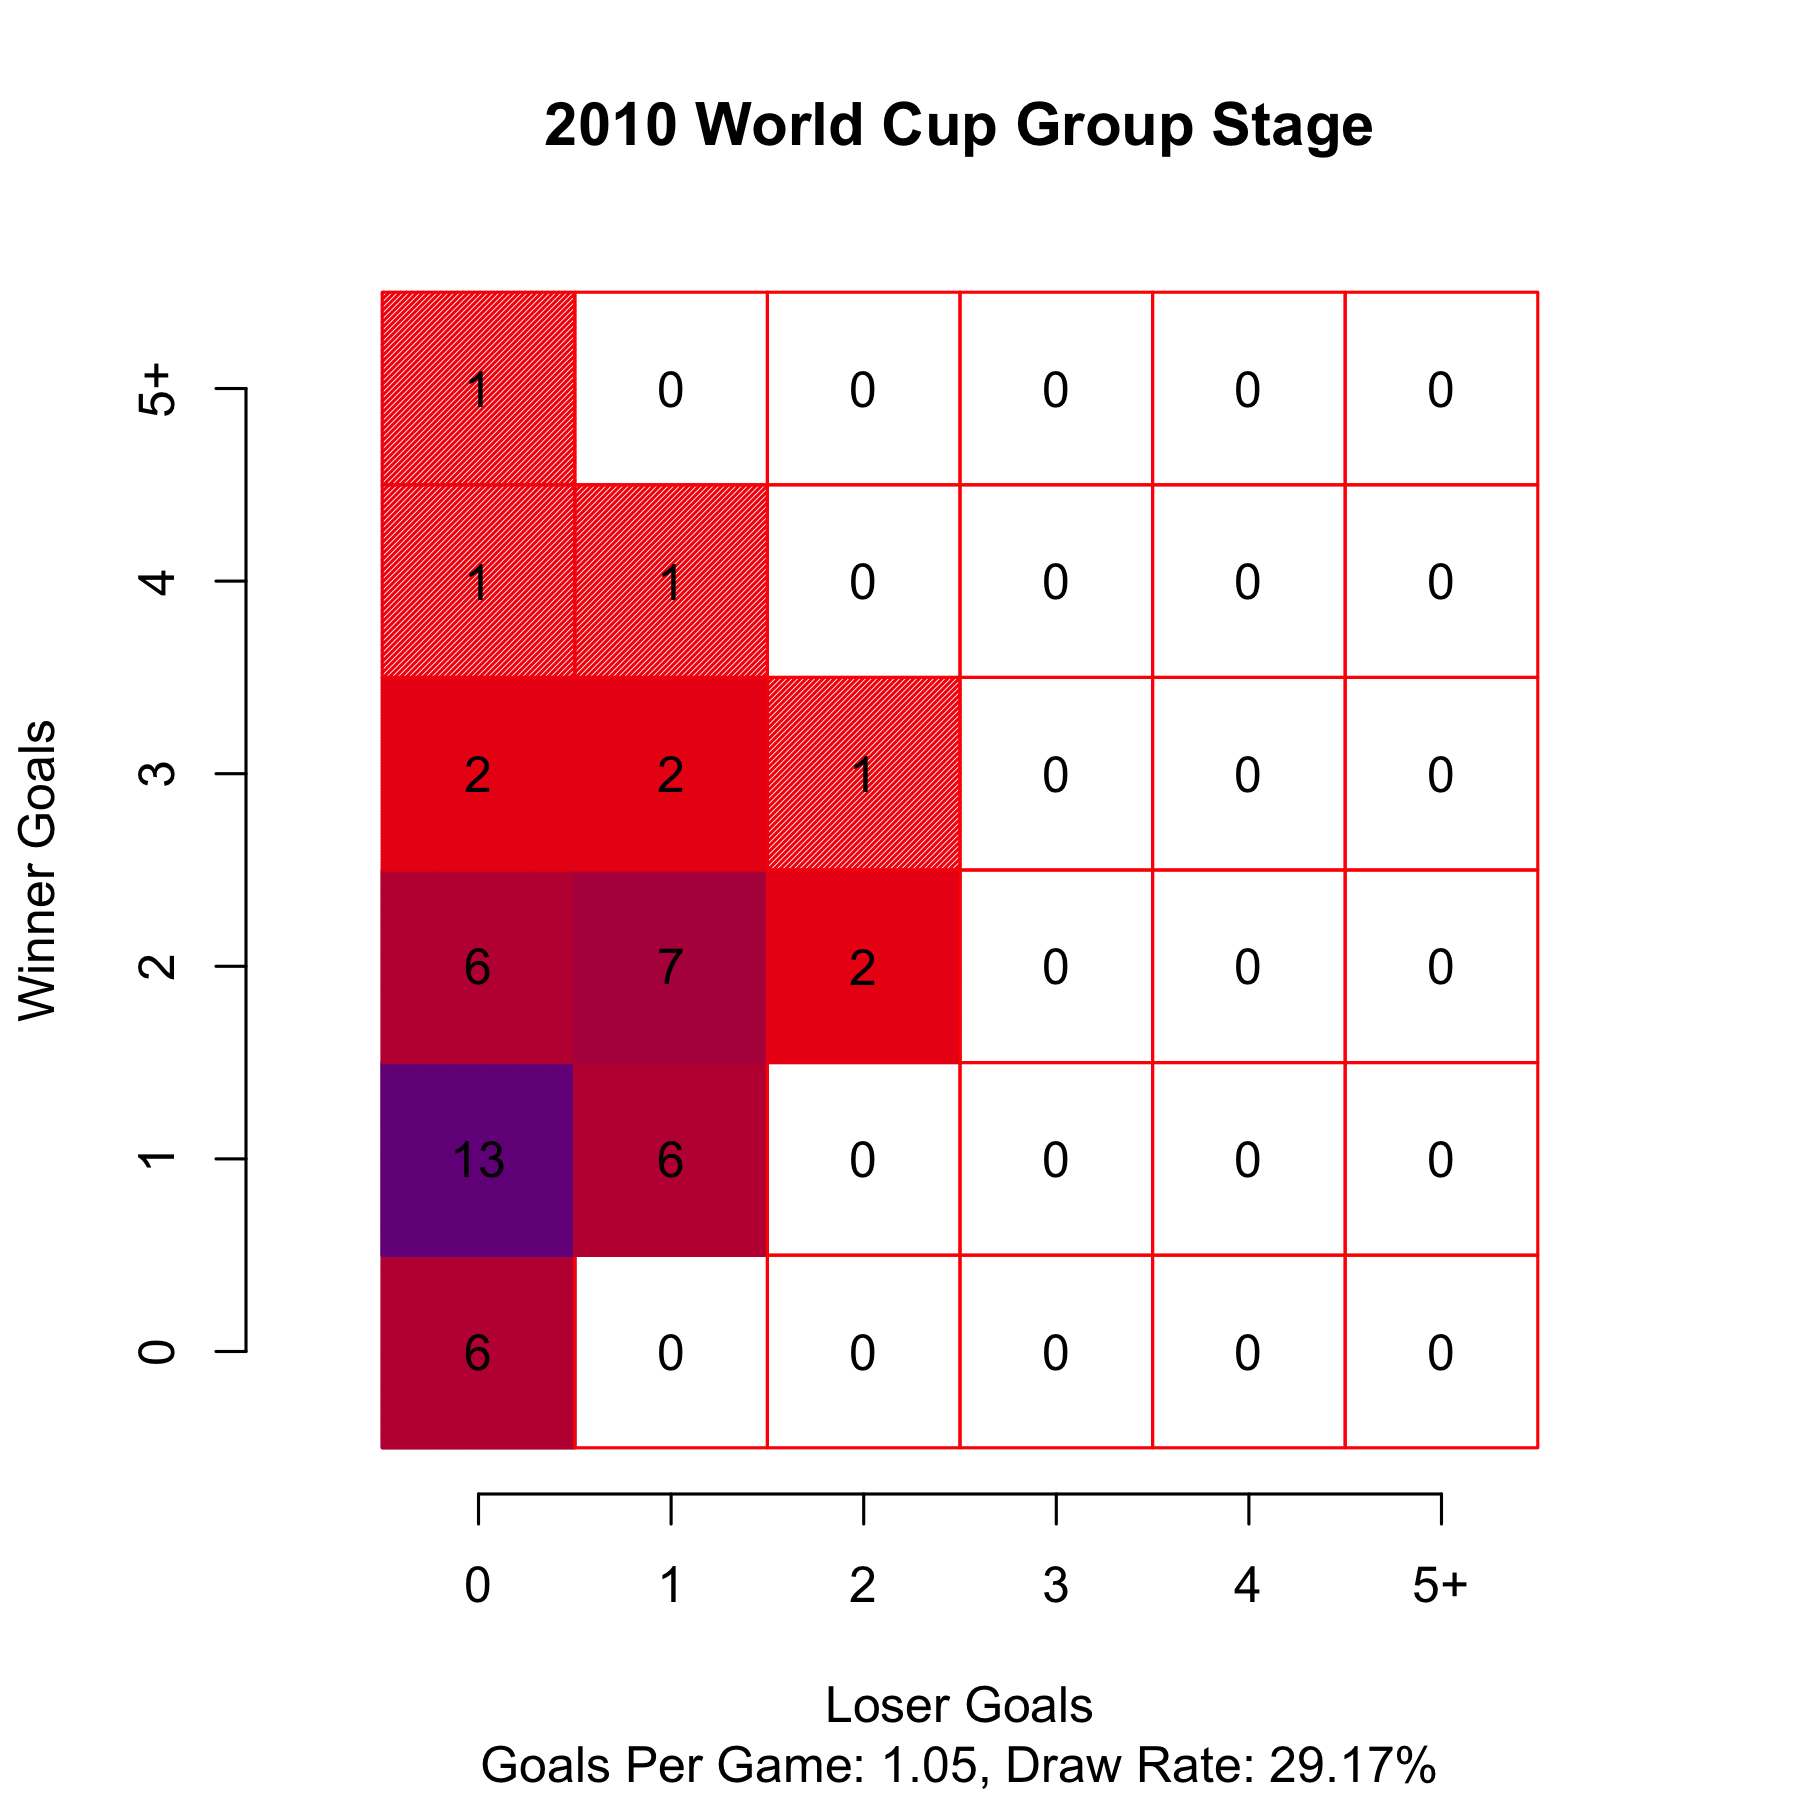
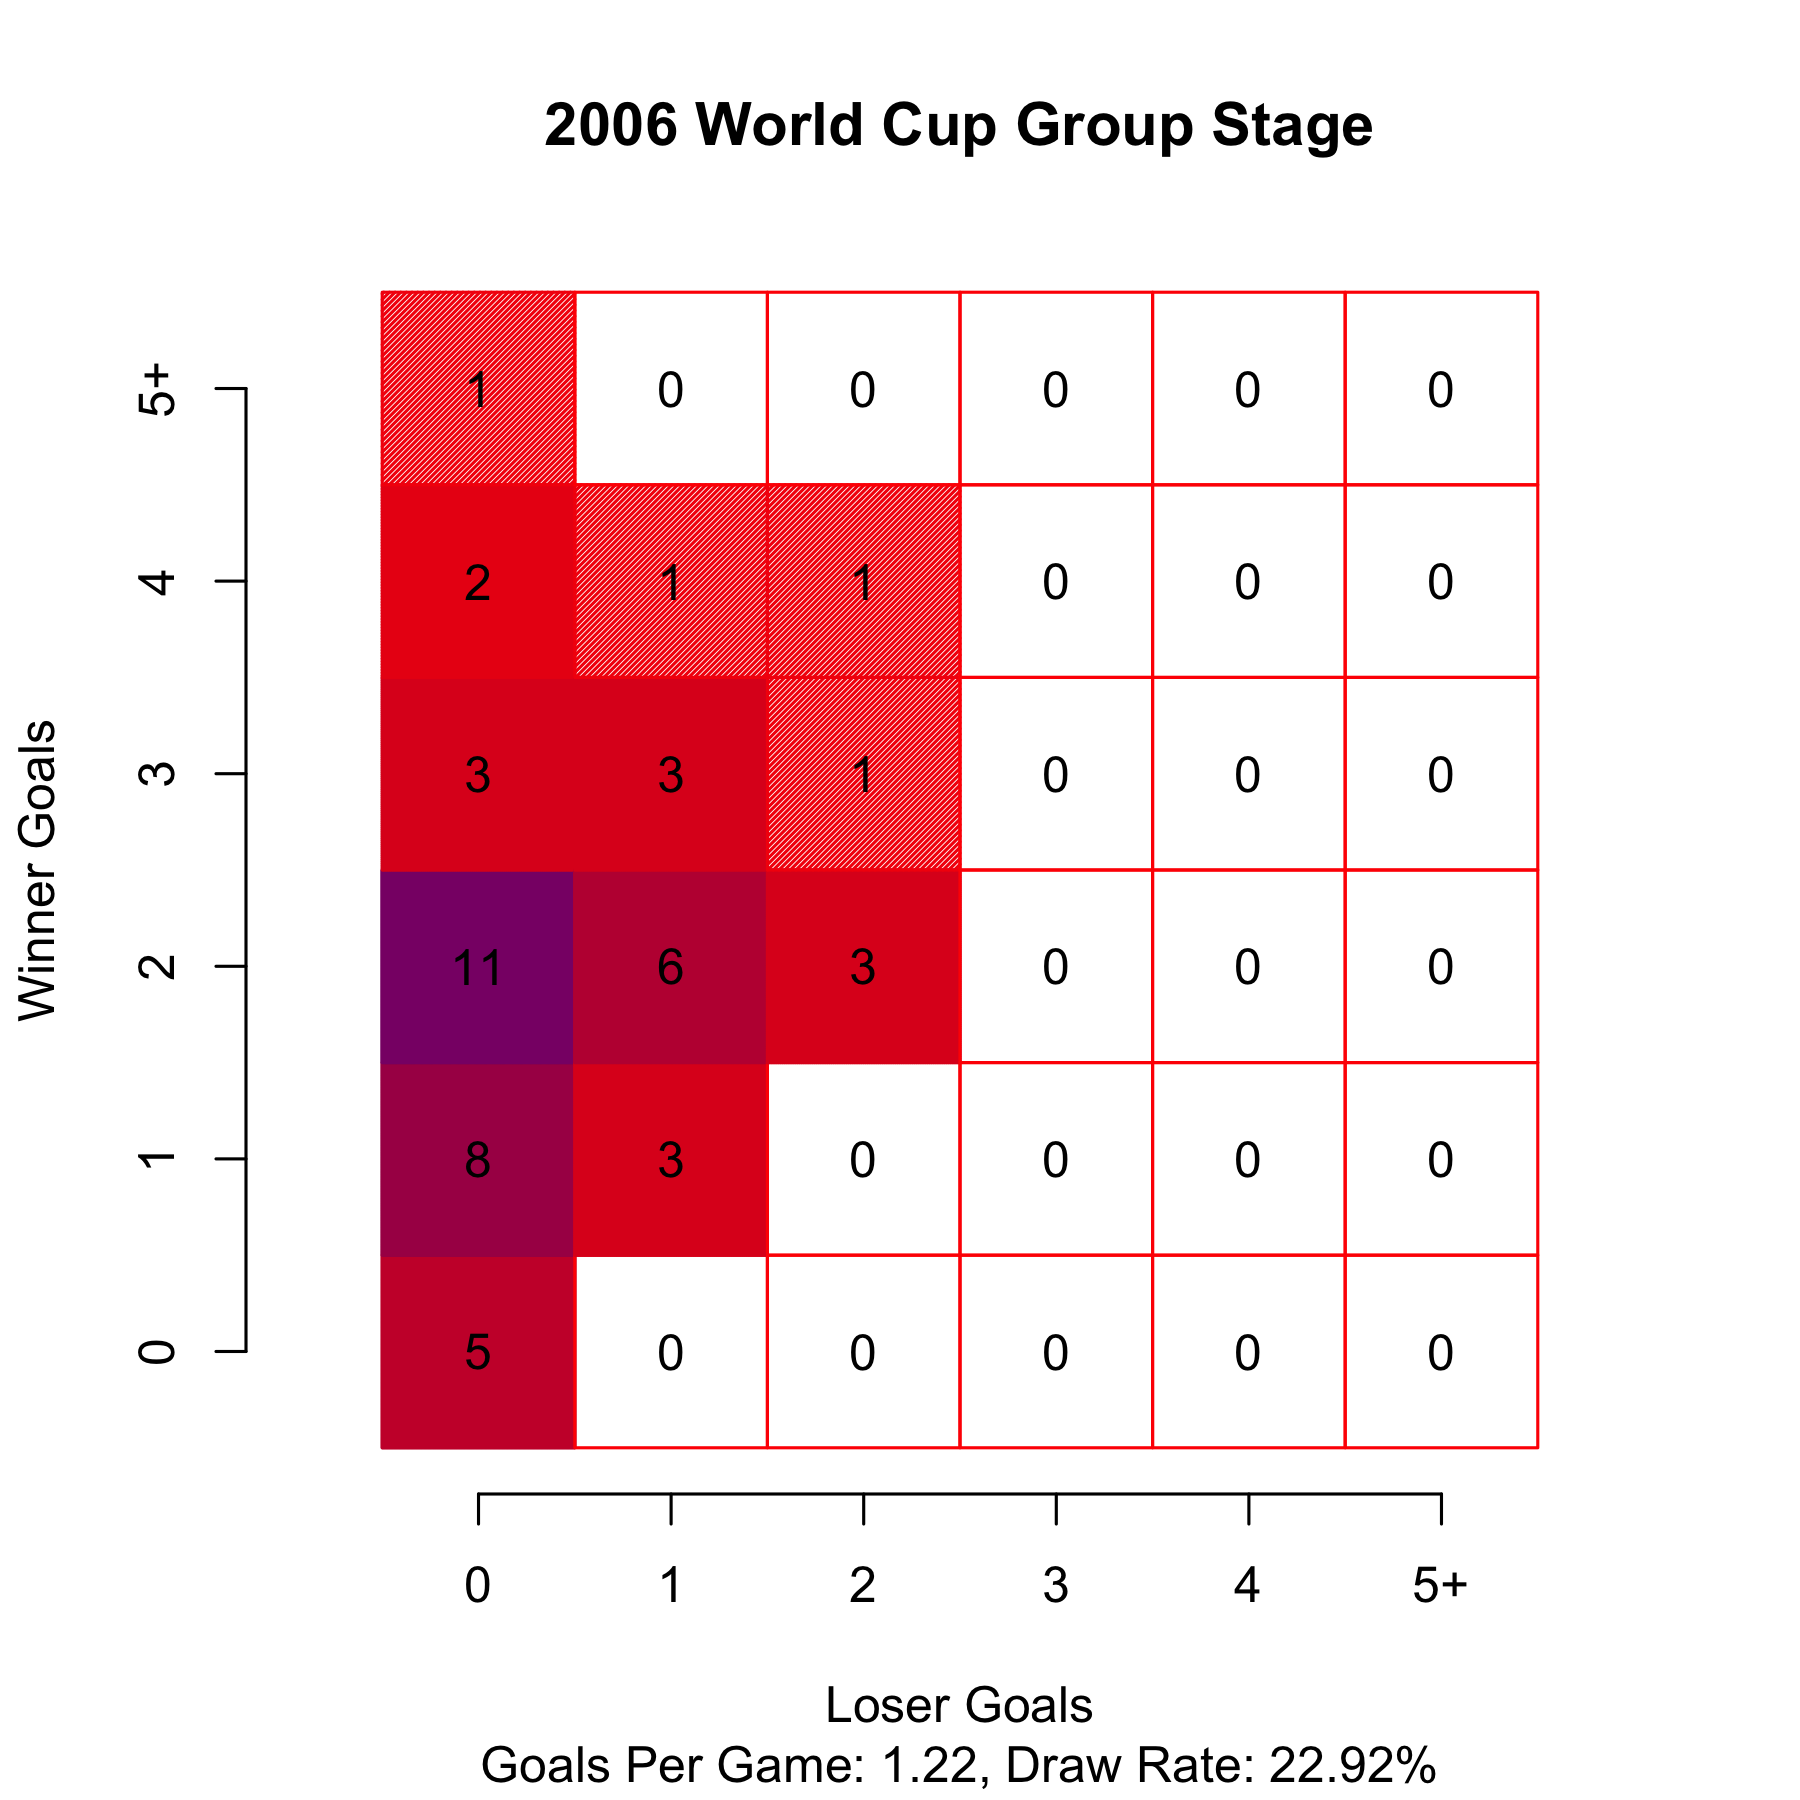
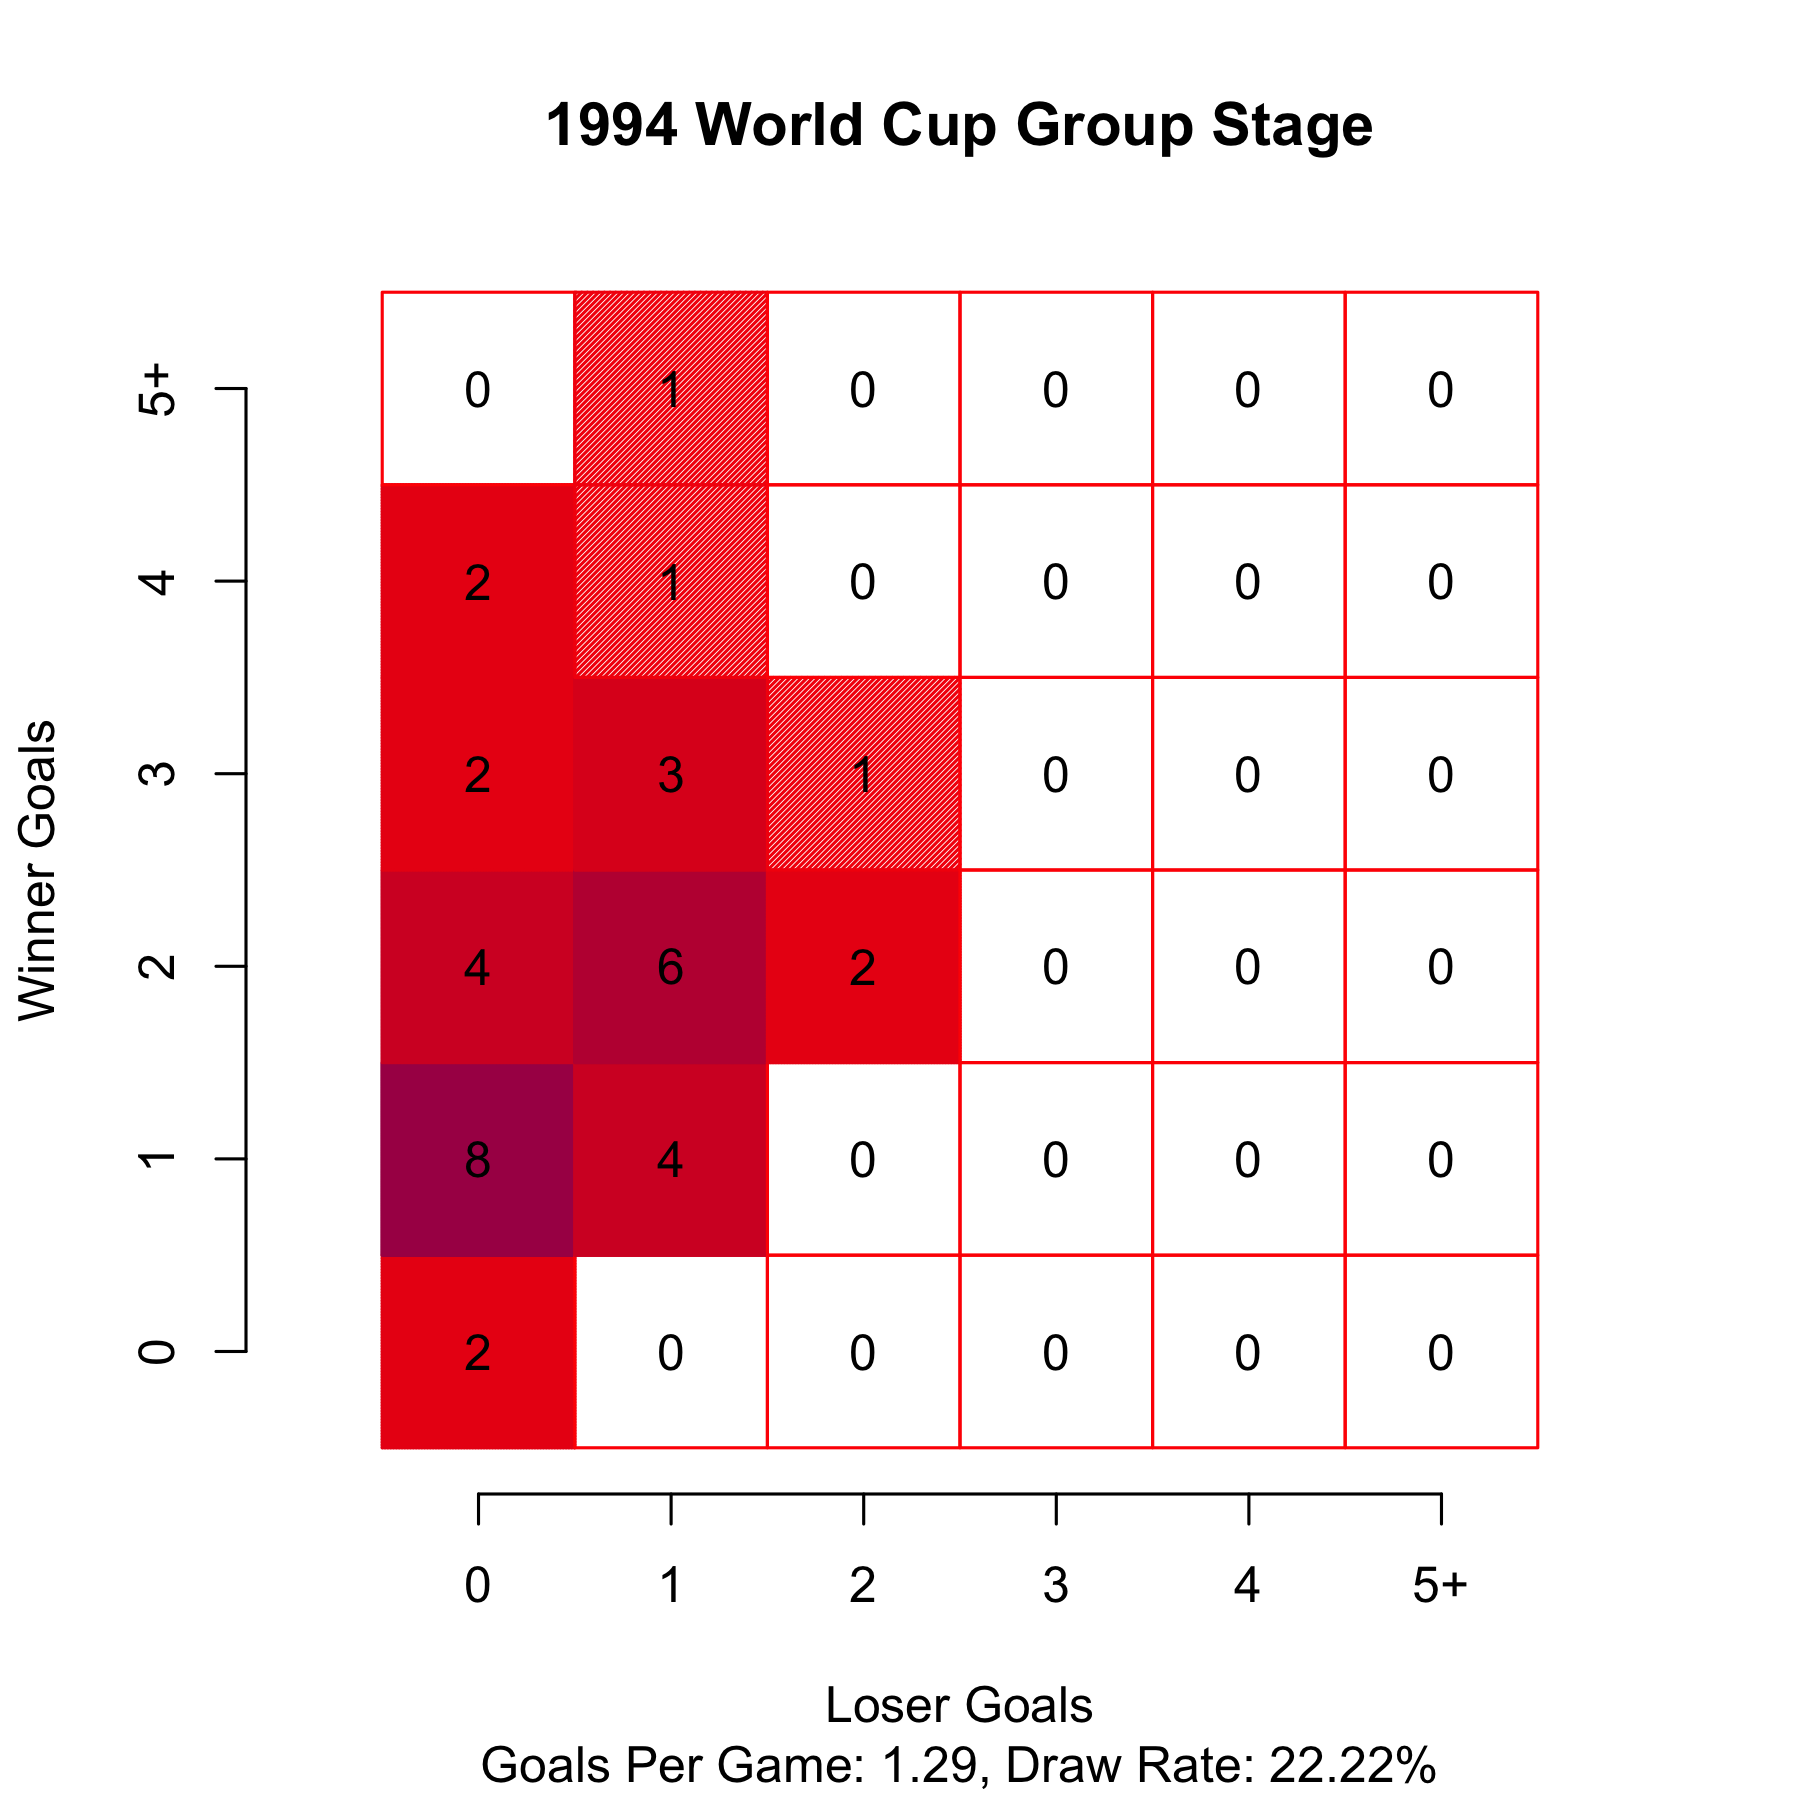
As an American, I can tell you that there are two big complaints that Americans have about soccer: 1) Not enough goals are scored and 2) Every game is a draw. Well fellow Americans those complaints simply don’t work for this World Cup. Since 1994, the group stage has seen a low draw rate of 22.22% in 1994 and a high of 33.33% in 1998. This year however, only 16.67% of games have ended in a draw. (And at least two of those draws were spectacular games.)
As for not scoring goals, teams are averaging 1.43 goals per game in the group stage. Past group stages have produced averages of 1.05, 1.22, 1.31, and 1.29. As a point of reference for American’s, hockey teams averaged 1.37 goals per game this past season. So if you like hockey and hate soccer I don’t want to hear your “they don’t score enough” argument. (Your “all they do is flop and complain” argument is good here though.)
As to why more goals are being score, does anyone have any theories as to why? Is it just a small sample size? Or is there actually something going on here? I’ve heard someone suggest that the ball is different and that the climate may be playing a role. Any thoughts?
Cheers.

Posted on June 21, 2014, in Uncategorized. Bookmark the permalink. 1 Comment.

You should do 1990 too. That was a dull affair with low scoring and the Argentines playing not to lose.