• statsbylopez's avatarStatsbyLopez

    Ample literature has gone into what teachers should do on the first day of class. Should they do an ice-breaker? Dive right into notes? Review a few example questions to motivate the course?

    I don’t really have control groups to use as a comparison, but I think these two activities were helpful and engaging, and I figured it was worth passing along.

    Introduction to Statistics (Intro level, undergrad)

    I stole this one from Gelman and Glickman‘s “Demonstrations for Introductory Probabiity and Statistics.”

    When the students come in, I split the course (appx 25 students) into eight groups. Each group was given a sheet of paper with a picture on it, and the groups were tasked with identifying the age of the subject in question. I had some fun coming up with the pictures – I went back to the 90’s with T-boz from TLC and Javy Lopez of the Atlanta Braves…

    View original post 530 more words

  • I was watching the football games last weekend and one of the announcers said something like “This kicker is 16/17 on the season.”  I absolutely hate this.  16/17 means nothing if you don’t factor in how long the field goals are (I’ve talked about this before here.)  So I spent a little bit of time thinking about what would be a better metric and I’ve come up with my first iteration of an improved kicking metric.  So let me introduce you to the Booting Individual Rating Objective Numeric Accuracy Statistic (B.I.R.O.N.A.S.) #awesome.

    The deets

    Let X_i = the random variable representing the number of points scored on the i-th field goal attempt, x_i the actual observed number of points scored on the i-th field goal, d_i = the distance of the i-th field goal attempt, and n is the total number of field goals attempted.  Then:

    BIRONAS = \sum\limits_{i=1}^n x_i / \sum\limits_{i=1}^n  E[X_i|d_i]

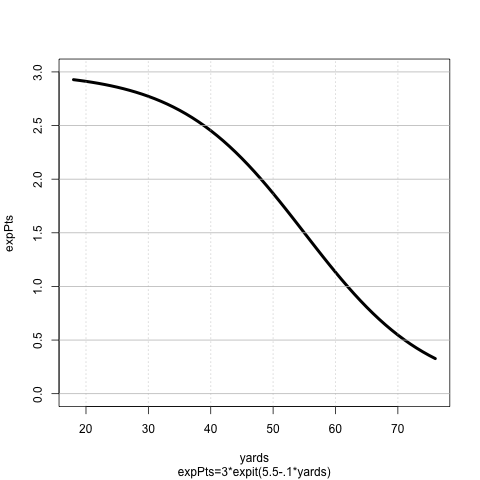
    So the only detail left to fill in is how to estimate E[X_i|d_i].  Using logistic regression and all field goal attempts from 2000-2014 the probability of making a field goal is approximately expit(5.5-.1 yards).  This is a nice formula and implies that a 20 yard field goal will be made over 97% of the time and a 30 yard field goal will be converted 92.4%.  40 and 50 yard field goals are expected to be made about 81.8% and 62.2%, respectively.  Under this model, at 55 yards, a field goal is exactly a coin flip and a 60 yard field goal has about a 37.8% chance to be made.  By multiplying these probabilities by 3 (i.e. the value of a field goal), we can get the expected value of a an attempt.  Below is a graph of distance of field goal versus the expected points of the attempt.

    expPts

    What does this mean?

    Using these expected points we can calculate BIRONAS, which is the ratio of the total points scored on field goals to the total number of expected points scored.  Thus, BIRONAS could be interpreted as the percentage of excess points that a kicker provided to his team above an average NFL kicker.  So if a kicker has a BIRONAS of 1 it means that the kicker scored exactly the same number of points that was expected based on average kicking.  A BIRONAS of 1.25 means that a kicker score 25% more points than expected compared to an average kicker.  Likewise a BIRONAS of .75 means a kicker scores 25% fewer points than expected.  So who had a good year according to BIRONAS?

    2014 BIRONAS

     
    Rank Name Bironas FGpct AvgYardage n
    1 GarrettHartley2014 1.19 1.00 37 3
    2 SebastianJanikowski2014 1.18 0.86 44 22
    3 MattBryant2014 1.17 0.91 39 32
    4 AdamVinatieri2014 1.16 0.97 35 35
    5 StephenGostkowski2014 1.13 0.95 36 37
    6 DanCarpenter2014 1.13 0.89 38 38
    7 JoshBrown2014 1.11 0.92 36 26
    8 ConnorBarth2014 1.11 0.94 34 16
    9 DanBailey2014 1.11 0.84 41 31
    10 JustinTucker2014 1.11 0.87 38 38
    11 ShaunSuisham2014 1.10 0.91 35 35
    12 PatrickMurray2014 1.09 0.83 41 24
    13 ChandlerCatanzaro2014 1.08 0.88 38 33
    14 CodyParkey2014 1.06 0.89 35 36
    15 RandyBullock2014 1.05 0.86 38 35
    16 PhilDawson2014 1.05 0.81 40 31
    17 RyanSuccop2014 1.04 0.86 36 22
    18 KaiForbath2014 1.04 0.89 35 27
    19 NickNovak2014 1.03 0.85 37 26
    20 StevenHauschka2014 1.03 0.84 37 38
    21 MasonCrosby2014 1.02 0.82 38 33
    22 MattPrater2014 1.02 0.82 38 28
    23 NickFolk2014 1.02 0.82 37 39
    24 GrahamGano2014 1.02 0.82 39 39
    25 ShayneGraham2014 1.01 0.86 35 22
    26 GregZuerlein2014 1.00 0.80 38 30
    27 JoshScobee2014 1.00 0.77 41 26
    28 MikeNugent2014 1.00 0.79 39 34
    29 CairoSantos2014 0.99 0.83 35 30
    30 BlairWalsh2014 0.98 0.74 40 35
    31 CalebSturgis2014 0.96 0.78 36 37
    32 JayFeely2014 0.92 0.75 38 4
    33 BillyCundiff2014 0.92 0.76 37 29
    34 RobbieGould2014 0.91 0.75 37 12
    35 BrandonMcManus2014 0.83 0.69 35 13
    36 NateFreese2014 0.53 0.43 38 7
    37 AlexHenery2014 0.31 0.20 49 5

    We’re going to ignore Garrett Hartley who only had 3 attempts in 2014 and award the BIRONAS award to Sebastian Janikowski.  The “Polish Cannon” is a great example of why field goal percentage is terrible.  His field goal percentage in 2014 was around 86% whereas Adam Vinatieri  had a percentage of about 97%.  Looking at that Vinatieri had a better year, but BIRONAS has Janikowski about 2% better than Vinatieri this year.  The difference between the two kickers can clearly be seen when you look at their average yardage for an attempt: Janikowski’s – 44 yards and Vinatieri 35 yards.  Janikowski’s average kick was almost 10 yards further than Vinatieri’s.

    Cowboys kicker Dan Bailey, ranked 9th, is another interesting case.  While his field goal percentage was only 84%, his BIRONAS was 1.11, tied with 3 other kickers who had percentages of 87%, 92%, and 94%.  What is holding him up?  His average attempt was from 41 yards and he made 5 of his 7 kicks from over 50 yards.

    Cheers.

  • statsbylopez's avatarStatsbyLopez

    A few months ago, my friend & writer Noah Davis asked me a question that was bothering him. I’ll paraphrase, but this was roughly what he said:

    Does consistency matter for quarterbacks? Like would you rather have an average QB who is never really great, or a good QB who occasionally sucks?

    Well, fortunately there are ways to measure performance consistency, and one of them is standard deviation. QB’s with high standard deviations in their game-by-game metrics are the less consistent ones, and visa versa.

    But perhaps an even better idea than just measuring each QB’s standard deviation of a certain metric is to compare the overall distribution of performance. This can be done using many tools, and we chose density curves, which are just rough approximations of the smoothed lines that one would fit over a histogram.

    The culmination of our project into looking at QB density curves is summarized here on FiveThirtyEight. In addition, I…

    View original post 491 more words

  • Total (weeks 1-17) – SU: 170-85-1 ATS: 126-124-6 O/U: 135-118-3 

    Playoffs – SU: 6-2, ATS: 5-3, O/U: 7-1

    Week 1 – SU: 9-7-0 ATS: 8-8-0 O/U: 13-3-0

    Week 2 – SU: 10-6-0 ATS: 10-6-0 O/U: 10-6-0

    Week 3 – SU: 12-4-0 ATS: 9-6-1  O/U: 8-8-0

    Week 4 – SU: 7-6-0 ATS: 5-7-1  O/U: 5-8-0

    Week 5 – SU: 14-2-0 ATS: 6-9-0  O/U: 9-6-0

    Week 6 – SU: 11-3-1 ATS: 8-7-0  O/U: 6-9-1

    Week 7 – SU: 11-4-0 ATS: 7-8-0  O/U: 8-7-0

    Week 8 – SU: 11-3-0 ATS: 8-7-0 O/U: 8-7-0

    Week 9 – SU: 9-4-0 ATS: 8-5-0 O/U: 4-8-1

    Week 10 – SU: 9-4-0 ATS: 4-9-0 O/U: 6-7-0

    Week 11 – SU: 9-5-0 ATS: 8-6-0 O/U: 7-7-0

    Week 12 – SU: 10-5-0 ATS: 7-8-0 O/U: 8-7-0

    Week 13 – SU: 11-5-0 ATS: 8-8-0 O/U: 7-9-0

    Week 14 – SU: 7-9-0 ATS: 9-6-1 O/U: 11-5-0

    Week 15 – SU: 11-5-0 ATS: 6-8-2 O/U: 10-6-0

    Week 16 – SU: 8-8-0 ATS: 10-6-0 O/U: 9-7-0

    Week 17 – SU: 12-4-0 ATS: 5-10-1 O/U: 6-9-1

    Week 18 – SU: 3-1-0 ATS: 2-2-0 O/U: 3-1-0

    Week 19 – SU: 3-1-0 ATS: 3-1-0 O/U: 4-0-0

    Week 20 – SU: 2-0-0 ATS: 1-1-0 O/U: 1-1-0

    New England at Indianapolis 

    Prediction: Patriots 29-23 (65.3%)

    Pick: Colts +7

    Total: Under 54

    Green Bay at Seattle

    Prediction: Seahawks 24-21 (60.3%)

    Pick: Packers +7.5

    Total: Under 46.5

  • Total (weeks 1-17) – SU: 170-85-1 ATS: 126-124-6 O/U: 135-118-3 

    Playoffs – SU: 6-2, ATS: 5-3, O/U: 7-1

    Week 1 – SU: 9-7-0 ATS: 8-8-0 O/U: 13-3-0

    Week 2 – SU: 10-6-0 ATS: 10-6-0 O/U: 10-6-0

    Week 3 – SU: 12-4-0 ATS: 9-6-1  O/U: 8-8-0

    Week 4 – SU: 7-6-0 ATS: 5-7-1  O/U: 5-8-0

    Week 5 – SU: 14-2-0 ATS: 6-9-0  O/U: 9-6-0

    Week 6 – SU: 11-3-1 ATS: 8-7-0  O/U: 6-9-1

    Week 7 – SU: 11-4-0 ATS: 7-8-0  O/U: 8-7-0

    Week 8 – SU: 11-3-0 ATS: 8-7-0 O/U: 8-7-0

    Week 9 – SU: 9-4-0 ATS: 8-5-0 O/U: 4-8-1

    Week 10 – SU: 9-4-0 ATS: 4-9-0 O/U: 6-7-0

    Week 11 – SU: 9-5-0 ATS: 8-6-0 O/U: 7-7-0

    Week 12 – SU: 10-5-0 ATS: 7-8-0 O/U: 8-7-0

    Week 13 – SU: 11-5-0 ATS: 8-8-0 O/U: 7-9-0

    Week 14 – SU: 7-9-0 ATS: 9-6-1 O/U: 11-5-0

    Week 15 – SU: 11-5-0 ATS: 6-8-2 O/U: 10-6-0

    Week 16 – SU: 8-8-0 ATS: 10-6-0 O/U: 9-7-0

    Week 17 – SU: 12-4-0 ATS: 5-10-1 O/U: 6-9-1

    Week 18 – SU: 3-1-0 ATS: 2-2-0 O/U: 3-1-0

    Week 19 – SU: 3-1-0 ATS: 3-1-0 O/U: 4-0-0

    Indianapolis at Denver

    Prediction: Broncos 29-22 (68.8%)

    Pick: Colts +7

    Total: Under 54

    Dallas at Green Bay

    Prediction: Packers 27-22 (64.0%)

    Pick: Cowboys +6.5 

    Total: Under 53

    Baltimore at New England

    Prediction: Patriots 27-22 (63.7%)

    Pick: Ravens +7

    Total: Over 48

    Carolina at Seattle

    Prediction: Seahawks 24-17 (68.7%)

    Pick: Panthers +10.5

    Total: Over 40

  •  
    Rank Team Score
    1 KENTUCKY 68
    2 VIRGINIA 67
    3 WEST VIRGINIA 67
    4 DUKE 67
    5 WISCONSIN 66
    6 KANSAS 66
    7 TEXAS 65
    8 VILLANOVA 65
    9 IOWA STATE 65
    10 OKLAHOMA 65
    11 LOUISVILLE 65
    12 BAYLOR 65
    13 NOTRE DAME 65
    14 TCU 65
    15 NORTH CAROLINA 65
    16 OKLAHOMA STATE 65
    17 GONZAGA 64
    18 MARYLAND 64
    19 ARIZONA 64
    20 ST JOHNS 63
    21 SETON HALL 63
    22 UTAH 63
    23 BUTLER 63
    24 OHIO STATE 63
    25 SOUTH CAROLINA 62


    Full Rankings

  • Total (weeks 1-17) – SU: 170-85-1 ATS: 126-124-6 O/U: 135-118-3 

    Week 1 – SU: 9-7-0 ATS: 8-8-0 O/U: 13-3-0

    Week 2 – SU: 10-6-0 ATS: 10-6-0 O/U: 10-6-0

    Week 3 – SU: 12-4-0 ATS: 9-6-1  O/U: 8-8-0

    Week 4 – SU: 7-6-0 ATS: 5-7-1  O/U: 5-8-0

    Week 5 – SU: 14-2-0 ATS: 6-9-0  O/U: 9-6-0

    Week 6 – SU: 11-3-1 ATS: 8-7-0  O/U: 6-9-1

    Week 7 – SU: 11-4-0 ATS: 7-8-0  O/U: 8-7-0

    Week 8 – SU: 11-3-0 ATS: 8-7-0 O/U: 8-7-0

    Week 9 – SU: 9-4-0 ATS: 8-5-0 O/U: 4-8-1

    Week 10 – SU: 9-4-0 ATS: 4-9-0 O/U: 6-7-0

    Week 11 – SU: 9-5-0 ATS: 8-6-0 O/U: 7-7-0

    Week 12 – SU: 10-5-0 ATS: 7-8-0 O/U: 8-7-0

    Week 13 – SU: 11-5-0 ATS: 8-8-0 O/U: 7-9-0

    Week 14 – SU: 7-9-0 ATS: 9-6-1 O/U: 11-5-0

    Week 15 – SU: 11-5-0 ATS: 6-8-2 O/U: 10-6-0

    Week 16 – SU: 8-8-0 ATS: 10-6-0 O/U: 9-7-0

    Week 17 – SU: 12-4-0 ATS: 5-10-1 O/U: 6-9-1

    Week 18 – SU: 3-1-0 ATS: 2-2-0 O/U: 3-1-0

    Arizona at Carolina

    Prediction: Panthers 23-19

    Pick: Cardinals +6.5 

    Total: Over 38

    Detroit at Dallas

    Prediction: Cowboys 24-23

    Pick: Lions +7

    Total: Under 50

    Cincinnati at Indianapolis

    Prediction: Colts 24-22

    Pick: Bengals +3.5

    Total: Under 50

    Baltimore at Pittsburgh

    Prediction: Steelers 23-21

    Pick: Ravens +3.5

    Total: Under 46.5

  • TeamRankings really crushed it this year. Also, my mean absolute error was 2.25 and mean squared error was 7.05.
    Cheers!

    statsbylopez's avatarStatsbyLopez

    We are back for another edition of the stat pundit rankings, where we rank the accuracy of different predictions for team wins from statistics or simulation based websites. Team Rankings boasted the best performance last year, outperforming competitors and the totals set by sportsbooks as far as predicting 2013 regular season win totals.

    Let’s meet our competitors for 2014:

    Team Rankings (TR), predictions listed here

    Accuscore (AS), predictions emailed by a loyal reader

    FiveThirtyEight (538), predictions extracted the week before the regular season began (missing link)

    Prediction Machine (PM), predictions listed here, released just after the season began

    Football Outsiders (FO), projections listed here from just before the season began

    Aggregate, the average statheads predictions from the five sites above

    Finally, we will want to compare all the projections to lines set by sportsbooks. To do so, I used the implied lines used by Seth Burn in his…

    View original post 755 more words

  • The WordPress.com stats helper monkeys prepared a 2014 annual report for this blog.

    Here’s an excerpt:

    The concert hall at the Sydney Opera House holds 2,700 people. This blog was viewed about 24,000 times in 2014. If it were a concert at Sydney Opera House, it would take about 9 sold-out performances for that many people to see it.

    Click here to see the complete report.

    Cheers!

  • Projected Records

    Team – (Projected Median wins) expected wins [Actual Wins] actualWins-predWins

    AFC East

    New England – (13-3) 13.044 [12-4] -1

    Miami – (6-10) 6.344 [8-8] +2

    Buffalo – (6-10) 5.905 [9-7] +3

    NY Jets (5-11) 5.329 [4-12] -1

    AFC North

    Baltimore (9-7) 9.192 [10-6] +1

    Pittsburgh – (9-7) 9.129 [11-5] +2

    Cincinnati – (9-7) 9.041 [10-5-1] +1.5

    Cleveland – (5-11) 5.328 [7-9] +2

    AFC South

    Houston (11-5) 10.679 [9-7] -2

    Indianapolis – (7-9) 7.114 [11-5] +4

    Tennessee (7-9) 6.623 [2-14] -5

    Jacksonville (2-14) 2.234 [3-13] +1

    AFC West

    Denver – (13-3) 12.636 [12-4] -1

    San Diego – (8-8) 8.334 [9-7] +1

    Kansas City – (7-9) 7.369 [9-7] +2

    Oakland – (4-12) 4.213 [3-13] -1

    NFC East

    Philadelphia (10-6) 9.579 [10-6] 0

    Dallas (8-8) 8.256 [12-4] +4

    NY Giants (8-8) 7.801 [6-10] -2

    Washington (8-8) 7.75 [4-12] -4

    NFC North

    Green Bay (11-5) 10.659 [12-4] +1

    Detroit (9-7) 9.095 [11-5] +2

    Chicago (9-7) 8.505 [5-11] -4

    Minnesota (5-11) 5.352 [7-9] +2

    NFC South

    New Orleans (11-5) 10.990 [7-9] -4

    Carolina (9-7) 8.909 [7-8-1] -1.5

    Atlanta (8-8) 8.227 [6-10] -2

    Tampa Bay (5-11) 5.227 [2-14] -3

    NFC West

    San Francisco (12-4) 11.594 [8-8] -4

    Seattle (11-5) 11.449 [12-4] +1

    Arizona (5-11) 5.312 [11-5] +6

    St. Louis (5-11) 4.781 [6-10] +1