I was watching the football games last weekend and one of the announcers said something like “This kicker is 16/17 on the season.” I absolutely hate this. 16/17 means nothing if you don’t factor in how long the field goals are (I’ve talked about this before here.) So I spent a little bit of time thinking about what would be a better metric and I’ve come up with my first iteration of an improved kicking metric. So let me introduce you to the Booting Individual Rating Objective Numeric Accuracy Statistic (B.I.R.O.N.A.S.) #awesome.
The deets
Let 


BIRONAS = 

So the only detail left to fill in is how to estimate E[
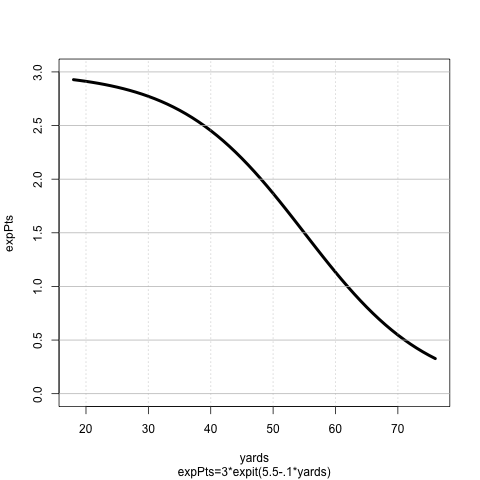
What does this mean?
Using these expected points we can calculate BIRONAS, which is the ratio of the total points scored on field goals to the total number of expected points scored. Thus, BIRONAS could be interpreted as the percentage of excess points that a kicker provided to his team above an average NFL kicker. So if a kicker has a BIRONAS of 1 it means that the kicker scored exactly the same number of points that was expected based on average kicking. A BIRONAS of 1.25 means that a kicker score 25% more points than expected compared to an average kicker. Likewise a BIRONAS of .75 means a kicker scores 25% fewer points than expected. So who had a good year according to BIRONAS?
2014 BIRONAS
|
We’re going to ignore Garrett Hartley who only had 3 attempts in 2014 and award the BIRONAS award to Sebastian Janikowski. The “Polish Cannon” is a great example of why field goal percentage is terrible. His field goal percentage in 2014 was around 86% whereas Adam Vinatieri had a percentage of about 97%. Looking at that Vinatieri had a better year, but BIRONAS has Janikowski about 2% better than Vinatieri this year. The difference between the two kickers can clearly be seen when you look at their average yardage for an attempt: Janikowski’s – 44 yards and Vinatieri 35 yards. Janikowski’s average kick was almost 10 yards further than Vinatieri’s.
Cowboys kicker Dan Bailey, ranked 9th, is another interesting case. While his field goal percentage was only 84%, his BIRONAS was 1.11, tied with 3 other kickers who had percentages of 87%, 92%, and 94%. What is holding him up? His average attempt was from 41 yards and he made 5 of his 7 kicks from over 50 yards.
Cheers.

Leave a comment