|
-
-
From a Deadspin Article:
Being a Division I college football coach is hard. You get paid millions of dollars, you get to bully your post-adolescent free labor into doing whatever you want them to do, and you get painted as a demigod by football-obsessed towns and campuses. It’s a tough gig.
Cheers.
-
I briefly investigated how to draw curved arrows in R. Here’s a small piece of the figure that I ultimately created:

View original post 145 more words
-
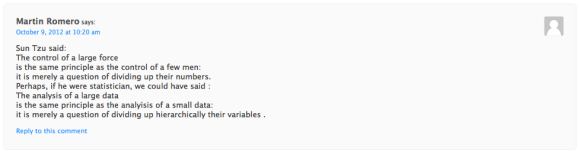
I particularly liked this comment from Martin Romero on Andrew Gelman’s blog:
-
Overall Records for 2012
SU: 53-38 (58.24%)
ATS: 51-40 (56.04%)
O/U: 50-39 (56.18%)
Week 6 (6-8 SU, 7-7 ATS, 6-7 O/U)
Week 5 (10-4 SU, 7-7 ATS, 7-7 O/U)
Week 4 (10-5 SU, 10-5 ATS, 12-2 O/U)
Week 3 (5-11 SU, 9-7 ATS, 9-7 O/U)
Week 2 (11-5 SU, 9-7 ATS, 8-8 O/U)
Week 1 (11-5 SU, 9-7 ATS, 8-8 O/U)
Week 6
Thursday @8:25pm
Pittsburgh Steelers at Tennessee Titans
Prediction: Steelers win 23-20
Pick: Titans +5.5
O/U: Over 42.5
Sunday @1pm
Kansas City Chiefs at Tampa Bay Buccaneers
Prediction: Buccaneers win 20-19
Pick: Chiefs +3.5
O/U: Under 41.5
Dallas Cowboys at Baltimore Ravens
Prediction: Ravens win 25-22
Pick: Cowboys +3.5
O/U: Over 44
St. Louis Rams at Miami Dolphins
Prediction: Dolphins win 22-16
Pick: Dolphins -3.5
O/U: Over 37.5
Oakland Raiders at Atlanta Falcons
Prediction: Falcons win 27-22
Pick: Raiders +9
O/U: Over 48.5
Detroit Lions at Philadelphia Eagles
Prediction: Eagles win 28-27
Pick: Lions +5.5
O/U: Over 47.5
Cincinnati Bengals at Cleveland Browns
Prediction: Bengals win 21-17
Pick: Bengals -2
O/U: Under 44
Indianapolis Colts at New York Jets
Prediction: Colts win 21-20
Pick: Colts +3.5
O/U: Under 42.5
Sunday @4:05pm
Buffalo Bills at Arizona Cardinals
Prediction: Cardinals win 23-22
Pick: Bills +5.5
O/U: Over 43
Sunday @4:25pm
New England Patriots at Seattle Seahawks
Prediction: Patriots win 32-19
Pick: Patriots -3.5
O/U: Over 44
New York Giants at San Francisco 49ers
Prediction: Giants 26-25
Pick: Giants +5.5
O/U: Over 44.5
Minnesota Vikings at Washington Redskins
Prediction: Vikings win 24-22
Pick: Vikings +2.5
O/U: Off the board
Sunday @8:30pm
Green Bay Packers at Houston Texans
Prediction: Packers win 29-24
Pick: Packers +5.5
O/U: Over 48
Monday @8:35pm
Denver Broncos at San Diego Chargers
Prediction: Chargers win 29-22
Pick: Chargers -2.5
O/U: Over 49.5
Cheers.
-
Alex Smith led the way in quarterback performances this week with an astonishing RIPPEN just over 43, and Blaine Gabbert continues to dwell at the bottom of all of my tables with a RIPPEN just above 3.
RIPPEN rankings for week 5 performances:
Player Team RIPPEN QB rating Smith, A. SF 43.014 156.2 Tannehill, R. MIA 34.387 92.3 Brady, T. NE 28.045 104.6 Rivers, P. SD 26.194 96.7 Cutler, J. CHI 24.361 88.8 Brees, D. NO 22.586 110.4 Wilson, R. SEA 21.676 82.2 Rodgers, A. GB 19.363 103.5 Ryan, M. ATL 19.293 89.0 Schaub, M. TEX 19.174 71.9 Weeden, B. CLE 17.863 84.3 Griffin, III, R. WAS 17.237 82.9 Manning, P. DEN 17.206 116.2 Luck, A. IND 15.959 81.0 Ponder, C. MIN 15.934 87.6 Manning, E. NYG 15.532 103.3 Flacco, J. BAL 13.647 55.6 Sanchez, M. NYJ 12.100 54.5 Vick, M. PHI 11.185 104.2 Kolb, K. ARI 10.787 72.7 Roethlisberger, B. PIT 8.572 80.1 Bradford, S. STL 8.025 69.7 Newton, C. CAR 7.107 56.8 Cassel, M. KC 5.758 38.1 Dalton. A. CIN 5.575 63.5 Hasselbeck, M. TEN 5.386 69.9 Fitzpatrick, R. BUF 4.217 57.5 Gabbert, B. JAX 3.096 37.7 Looking at RIPPEN based on the whole season, Tom Brady is ranked number 1 with a RIPPEN of 27.304, which is essentially the same as RGIII’s RIPPEN of 27.279. The top five is rounded out by Payton Manning, Alex Smith, and Matt Ryan. My RIPPEN top five is the exact same top five as sorted by season QB rating, but in a different order. QB rating has the top five guys ranked Smith, Ryan, Brady, Manning, RGIII.
The bottom five according to RIPPEN are Weeden, Kolb, Cassel, Gabbert, and, dead last, Matt Hasselbeck. QB rating has three of these quarterbacks in the bottom five (Weeden, Cassel, and Gabbert), but by QB rating Sanchez and Tannehill are also in the bottom five. I have Tannehill 19th and Sanchez 25th out of 32 quarterbacks.
As for most over and under rated quarterbacks, I regressed QB rating as a function of RIPPEN and, as expected, they are highly related. (QB rating is approximately 58 + 1.63*RIPPEN). However, there are some large deviations. The most under-rated quarterback based on QB rating is Cam Newton. His QB rating is only 80.9, but, based on RIPPEN, we’d expect him to have a QB rating about 16 points higher around 97. Other under-rated quarterbacks include Ryan Tannehill who is about 14 points lower than expected and Mark Sanchez who is about 11 points lower than expected. (But don’t get me wrong here, I still think Sanchez is a terrible quarterback. I just don’t think he is the 30th best quarterback in the league, I think he’s 25th.)
The most over-rated QB based on passer rating is Kevin Kolb. Based on his passer rating, he is ranked 16th among quarterbacks, but RIPPEN has him ranking 29th. Based on his RIPPEN, his expected QB rating is 75.3 about 14 points lower than it actually is. This is likely do to the weight that passer rating gives to touchdown passes. The next two most over-rated QB’s are Ben Roethlisberger and Eli Manning. Roethlisberger has a QB rating about 11 points higher than we would expect and Manning is about 10 points higher than expected.
Season RIPPEN rankings through five weeks of games:
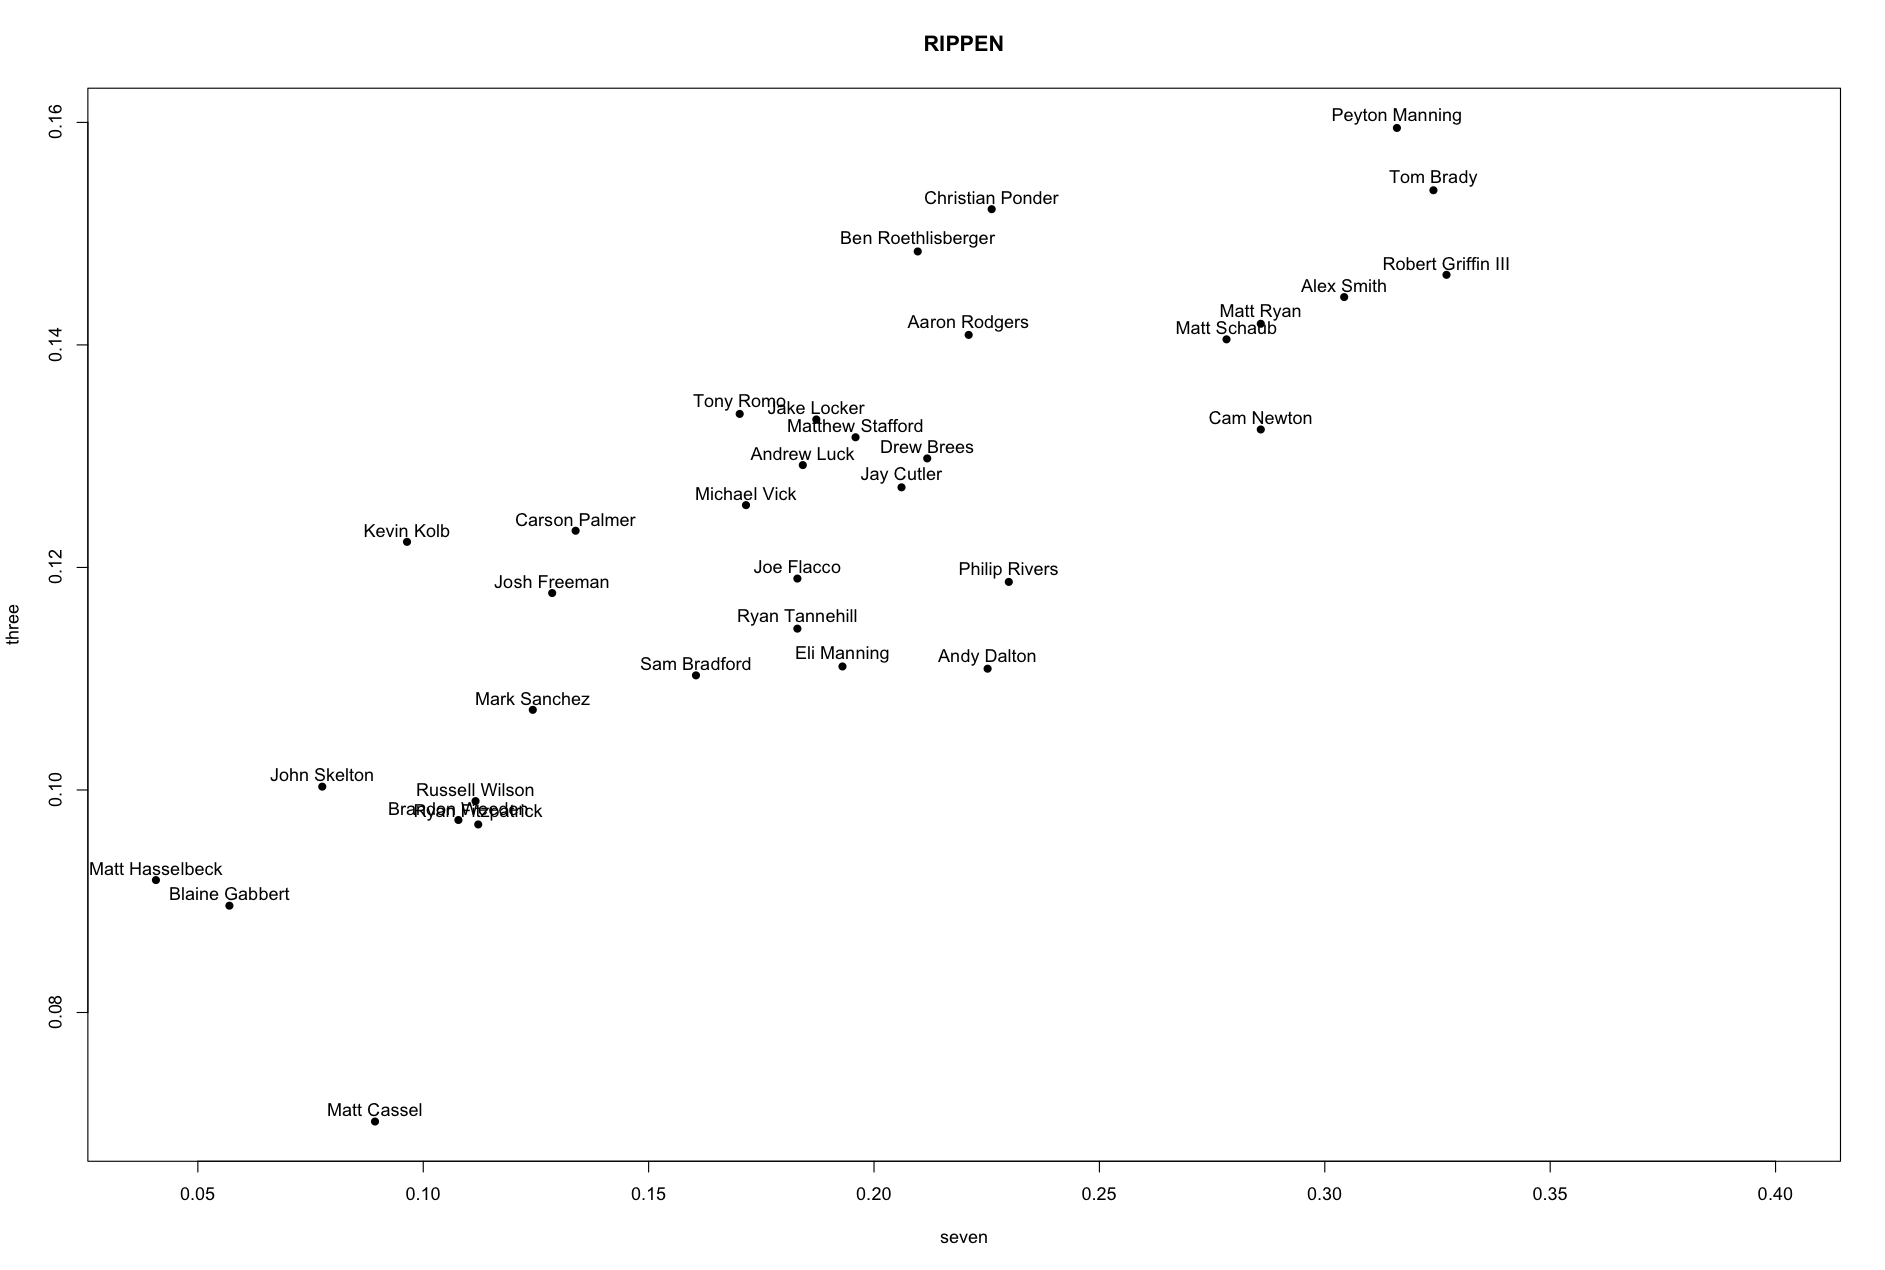
Player Team RIPPEN QB rating Brady, T. NE 27.304 102.8 Griffin, III, R. WAS 27.279 101.0 Manning, P. DEN 26.905 101.2 Smith, A. SF 25.630 108.7 Ryan, M. ATL 24.263 106.1 Newton, C. CAR 23.978 80.9 Schaub, M. HOU 23.689 99.2 Ponder, C. MIN 20.393 95.5 Rodgers, A. GB 19.697 97.0 Rivers, P. SD 19.654 93.1 Roethlisberger, B. PIT 19.131 100.6 Dalton, A. CIN 19.091 92.9 Brees, D. NO 18.720 90.7 Cutler, J. CHI 18.243 78.7 Stafford, M. DET 17.664 81.6 Manning, E. NYG 16.843 96.0 Luck, A. IND 16.770 77.1 Flacco, J. BAL 16.380 89.9 Tannehill, R. MIA 16.245 70.4 Romo, T. DAL 15.928 78.5 Vick, M. PHI 15.780 77.8 Bradford, S. STL 14.544 78.6 Palmer, C. OAK 13.065 86.0 Freeman, J. TB 12.533 75.3 Sanchez, M. NYJ 11.917 66.6 Wilson, R. SEA 10.782 75.2 Fitzpatrick, R. BUF 10.761 84.2 Weeden, B. CLE 10.465 64.5 Kolb, K. ARI 10.417 89.7 Cassel, M. KC 8.357 66.2 Gabbert, B. JAX 6.678 73.3 Hasselbeck, M. TEN 5.606 73.6 And finally, below is a plot of estimated outcome percentages that are used in calculating RIPPEN. If you look at Peyton Manning in the upper right corner of the plot you can see that starting from his own 20 yard line and only throwing passes in a simulated world, hell score a touchdown about 32% of the time and convert a field goal about 16% of the time. So he’d score on around 48% of drives. Compare this with Blaine Gabbert who will score a touchdown on about 6% of drives and get a filed goal about 9% of drives. This means that 85% of Gabbert drives, in the simulated RIPPEN world, end in either a punt, an interception, or a missed field goal.
 Cheers.
 -
StatsInTheWild NFL rankings as of October 9, 2012 at 12:34pm. SOS=strength of schedule
Team Rank Change Record ESPN TeamRankings.com SOS Points Diff San Francisco 1 ↑2 4-1 3 2 6 +81 Chicago 2 ↑2 4-1 6 3 8 +78 Houston 3 ↓1 5-0 1 1 15 +76 Minnesota 4 ↑1 4-1 8 6 7 +41 Arizona 5 ↓4 4-1 9 5 2 +16 New England 6 ↑1 3-2 5 7 11 +52 Atlanta 7 ↓1 5-0 2 4 28 +55 St. Louis 8 ↑3 3-2 18 8 3 +2 Seattle 9 – 3-2 16 10 4 +16 Baltimore 10 ↓2 4-1 4 9 25 +41 Green Bay 11 ↓1 2-3 12 15 5 +1 NY Giants 12 – 3-2 7 22 20 +41 Detroit 13 ↑3 1-3 20 20 1 -14 Miami 14 ↑5 2-3 19 11 13 0 Indianapolis 15 ↑9 2-2 22 17 16 -19 Dallas 16 ↑6 2-2 13 19 18 -23 NY Jets 17 ↑1 2-3 25 13 9 -34 Denver 18 ↓4 2-3 17 12 26 +21 Cincinnati 19 ↓4 3-2 15 14 27 -4 Philadelphia 20 ↓3 3-2 11 16 19 -19 San Diego 21 ↓8 3-2 14 21 32 +22 Washington 22 ↓2 2-3 21 23 17 -7 Pittsburgh 23 – 2-2 10 18 29 +4 Buffalo 24 ↓3 2-3 27 25 14 -58 Tampa Bay 25 ↑1 1-3 23 31 23 -9 Jacksonville 26 ↓1 1-4 31 24 12 -73 New Orleans 27 ↑3 1-4 24 29 22 -13 Carolina 28 ↓1 1-4 26 30 21 -33 Tennessee 29 ↓1 1-4 28 26 10 -93 Oakland 30 ↑2 1-3 29 27 31 -58 Kansas City 31 – 1-4 30 28 30 -51 Cleveland 32 ↓3 0-5 32 32 24 -39
Best
Best undefeated team: Houston
Best 4 win team: San Francisco
Best 3 win team: New England
Best 2 win team: Green Bay
Best 1 win team: Detroit
Worst
Worst undefeated team: Atlanta
Worst 4 win team: Baltimore
Worst 3 win team: San Diego
Worst 2 win team: Buffalo
Worst 1 win team: Kansas City
Worst team in the league: Cleveland
Most
Most under-rated team: St. Louis (ESPN has them 18)
Most over-rated team: Pittsburgh (ESPN has them 10)
Cheers.
-
Rank Team Record 1 OREGON 6-0 2 KANSAS STATE 5-0 3 ALABAMA 5-0 4 SO CAROLINA 6-0 5 WEST VIRGINIA 5-0 6 TEXAS 4-1 7 FLORIDA 5-0 8 NOTRE DAME 5-0 9 OKLAHOMA 3-1 10 IOWA STATE 4-1 11 STANFORD 4-1 12 TEXAS TECH 4-1 13 OREGON STATE 4-0 14 LSU 5-1 15 TEXAS A&M 4-1 16 OHIO STATE 6-0 17 BAYLOR 3-1 18 USC 4-1 19 MISS STATE 5-0 20 TCU 4-1 21 GEORGIA 5-1 22 ARIZONA STATE 4-1 23 FLORIDA STATE 5-1 24 OKLAHOMA STATE 2-2 25 CINCINNATI 4-0 26 ARIZONA 3-3 27 CLEMSON 5-1 28 LOUISVILLE 5-0 29 RUTGERS 5-0 30 PENN STATE 4-2 31 MICHIGAN 3-2 32 LOUISIANA TECH 5-0 33 MICHIGAN STATE 4-2 34 UCLA 4-2 35 NORTHWESTERN 5-1 36 TENNESSEE 3-2 37 IOWA 3-2 38 NEVADA 5-1 39 FRESNO STATE 4-2 40 DUKE 5-1 41 WISCONSIN 4-2 42 NORTH CAROLINA 4-2 43 BYU 4-2 44 WASHINGTON 3-2 45 NEBRASKA 4-2 46 CALIFORNIA 2-4 47 MISSOURI 3-3 48 SAN JOSE ST 4-1 49 MIAMI-FLORIDA 4-2 50 OLE MISS 3-3 51 MARYLAND 3-2 52 BOISE STATE 4-1 53 MINNESOTA 4-1 54 UTAH STATE 4-2 55 TOLEDO 5-1 56 PURDUE 3-2 57 ULM 3-2 58 ARKANSAS 2-4 59 NORTHERN ILL 5-1 60 WESTERN KY 4-1 61 OHIO U 6-0 62 PITTSBURGH 2-3 63 LOUISIANA 4-1 64 MIDDLE TENNESSEE 3-2 65 NC STATE 4-2 66 TULSA 5-1 67 KANSAS 1-4 68 KENTUCKY 1-5 69 UTAH 2-3 70 TX-SAN ANTONIO 5-0 71 SYRACUSE 2-3 72 VIRGINIA TECH 3-3 73 TEMPLE 2-2 74 VANDERBILT 2-3 75 WASHINGTON ST 2-4 76 SAN DIEGO ST 3-3 77 TROY 3-2 78 AUBURN 1-4 79 WAKE FOREST 3-3 80 CONNECTICUT 3-3 81 NEW MEXICO 3-3 82 UCF 3-2 83 INDIANA 2-3 84 GEORGIA TECH 2-4 85 KENT STATE 4-1 86 WYOMING 1-4 87 ILLINOIS 2-4 88 SO FLORIDA 2-4 89 COLORADO 1-4 90 ARKANSAS STATE 3-3 91 BALL STATE 3-3 92 TEXAS STATE 2-3 93 BOSTON COLLEGE 1-4 94 AIR FORCE 2-3 95 NAVY 2-3 96 SMU 2-3 97 VIRGINIA 2-4 98 HOUSTON 2-3 99 WESTERN MICH 3-3 100 NORTH TEXAS 2-4 101 UNLV 1-5 102 BOWLING GREEN 3-3 103 EAST CAROLINA 3-3 104 MIAMI-OHIO 3-3 105 IDAHO 1-5 106 ARMY 1-4 107 FLA ATLANTIC 1-4 108 MARSHALL 2-4 109 COLORADO STATE 1-5 110 SOUTH ALABAMA 1-4 111 UAB 1-4 112 BUFFALO 1-4 113 MEMPHIS 1-4 114 CENTRAL MICH 2-3 115 FIU 1-5 116 TEXAS-EL PASO 1-5 117 HAWAII 1-4 118 EASTERN MICH 0-5 119 RICE 1-5 120 SOUTHERN MISS 0-5 121 NEW MEXICO ST 1-5 122 TULANE 0-5 123 AKRON 1-5 124 MASSACHUSETTS 0-6 -
Last week, I entered the fray on the Mike Trout versus Miguel Cabrera AL MVP debate. It’s similar to the 2010 AL Cy Young discussion — Felix Hernandez led the AL in strikeouts and ERA but managed just a 13-12 record because Seattle couldn’t score. The new era of baseball stats won out. Voters ignored wins, which have little to do with pitching quality, and Hernandez won the award.
Likewise, Trout lags Cabrera in highly publicized but somewhat meaningless stats (RBI, Triple Crown). Some saber-men would have you believe that Trout laps Cabrera in the only stats that matter (WAR over 10 compared to 7 for Cabrera), but that requires a level of trust that I don’t have. WAR — Wins Above Replacement — is complicated to the point of complete confusion. Cabrera contributed more in some categories (doubles, homers, total bases, batting average) but less in others (triples, baserunning, defense)…
View original post 783 more words