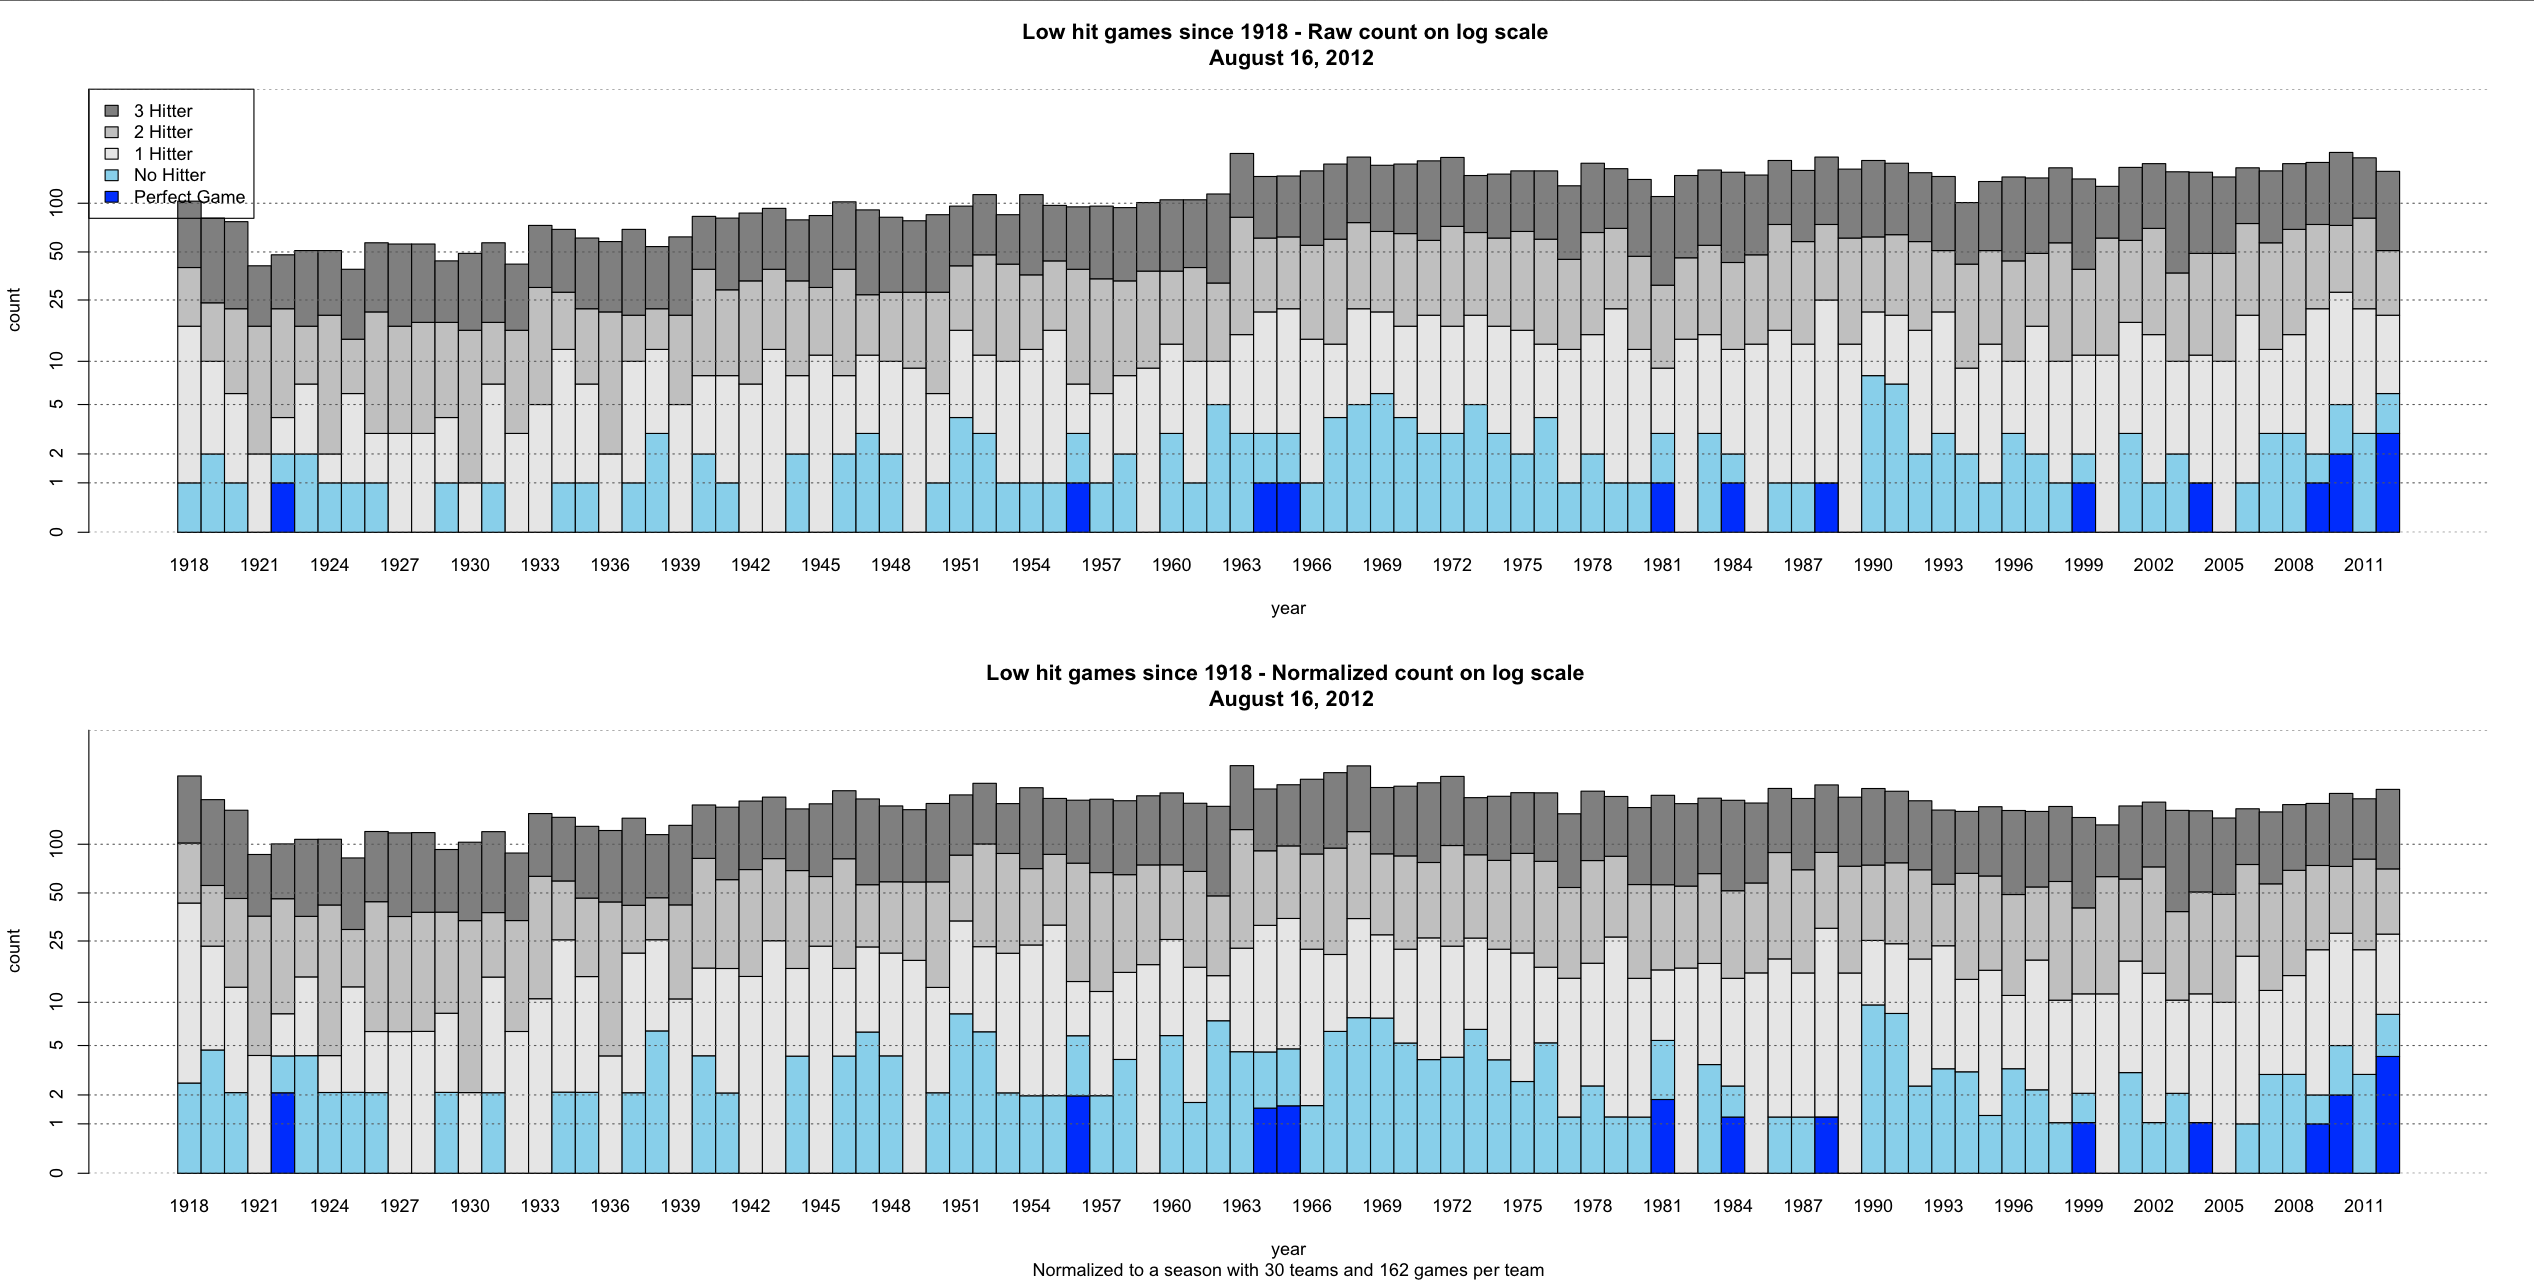
Felix Hernandez of the Seattle Mariners just threw the third perfect game of the season, so I figured it was a good time to update my low hit games graphs that I posted in June. So, here they are:

 Cheers.
Felix Hernandez of the Seattle Mariners just threw the third perfect game of the season, so I figured it was a good time to update my low hit games graphs that I posted in June. So, here they are:
Cheers.
StatsInTheWild MLB rankings as of August 6, 2012 at 8:17pm. SOS=strength of schedule
| Team | Rank | Change | Record | ESPN | TeamRankings.com | SOS | Run Diff |
| NYY | 1 | – | 63-44 | 3 | 1 | 5 | +92 |
| Texas | 2 | – | 63-44 | 4 | 2 | 13 | +83 |
| LA Angels | 3 | – | 58-51 | 9 | 6 | 7 | +49 |
| Washington | 4 | ↑2 | 65-43 | 2 | 4 | 23 | +82 |
| ChiSox | 5 | ↑4 | 59-48 | 7 | 5 | 14 | +64 |
| Cincinnati | 6 | ↑5 | 66-42 | 1 | 3 | 29 | +72 |
| Oakland | 7 | ↑1 | 58-50 | 8 | 7 | 8 | +28 |
| Detroit | 8 | ↓1 | 58-50 | 13 | 9 | 12 | +24 |
| TampaBay | 9 | ↑1 | 56-52 | 14 | 12 | 3 | +19 |
| Atlanta | 10 | ↑5 | 62-46 | 5 | 8 | 21 | +62 |
| Boston | 11 | ↓6 | 54-55 | 17 | 13 | 6 | +29 |
| Toronto | 12 | ↓8 | 53-55 | 18 | 14 | 2 | +9 |
| St. Louis | 13 | ↑1 | 59-49 | 10 | 15 | 30 | +110 |
| Baltimore | 14 | ↓2 | 57-51 | 16 | 11 | 1 | -57 |
| Pittsburgh | 15 | ↓2 |
61-46 | 6 | 10 | 28 | +36 |
| Seattle | 16 | ↑1 | 51-59 | 20 | 17 | 4 | -3 |
| Arizona | 17 | ↑4 | 55-53 | 15 | 19 | 26 | +42 |
| SF | 18 | ↓2 | 59-49 | 11 | 16 | 27 | +19 |
| LA Dodgers | 19 | ↓1 |
59-50 | 12 | 18 | 25 | +15 |
| NY Mets | 20 | – | 53-56 | 19 | 20 | 17 | -5 |
| Minnesota | 21 | ↑3 | 47-61 | 25 | 22 | 11 | -79 |
| Kansas City | 22 | – | 45-62 | 26 | 23 | 10 | -60 |
| Cleveland | 23 | ↓4 | 50-58 | 21 | 21 | 9 | -90 |
| Milwaukee | 24 | ↓1 | 48-59 | 22 | 26 | 19 | -13 |
| Philadelphia | 25 | – | 49-59 | 24 | 24 | 19 | -29 |
| Miami | 26 | – | 49-60 | 23 | 25 | 15 | -100 |
| Chic Cubs | 27 | ↑1 | 43-63 | 28 | 27 | 18 | -79 |
| San Diego | 28 | ↓1 | 46-64 | 27 | 28 | 22 | -61 |
| Colorado | 29 | – | 38-68 | 29 | 29 | 20 | -117 |
| Houston | 30 | – | 36-73 | 30 | 30 | 16 | -142 |
Past Rankings:
Cheers.
Canada managed to win 18 total medals in the 2012 Olympics, while only tallying one gold medal. Previously, I proposed the question, has anyone ever won more medals than this with fewer golds? The answer, shockingly is yes. In 1952, Germany managed to win 24 total medals and exactly ZERO golds (7 Silver and 17 Bronze). Incredible. Really nice work.
Other countries that have come close include the United Kingdom in 1960 (2G, 6S, 12B), Sweden in 1984 (2G, 11S, 6B), and Cuba in 2008 (2G, 11S, 12B).
Another fun fact: Only 5 times has a team won more than 50 total medals and won more bronze than silver and more silver than gold. They are Sweden 1920 (19G, 20S, 24B), Soviet Union in 1964(30G, 31S, 35B), West Germany in 1984 (17G, 19S, 23B), Germany in 2000 (13G, 17S, 26B), and, most recently, Russia in 2012 (24G, 26S, 32B).
See you in Brazil in 2016!
Cheers.
Canada is incredible. They somehow managed to win 18 total medal and only 1 gold. Amazing. How is it possible to be so consistently nearly the best? Has anyone ever won more medals with fewer golds?
 Cheers.
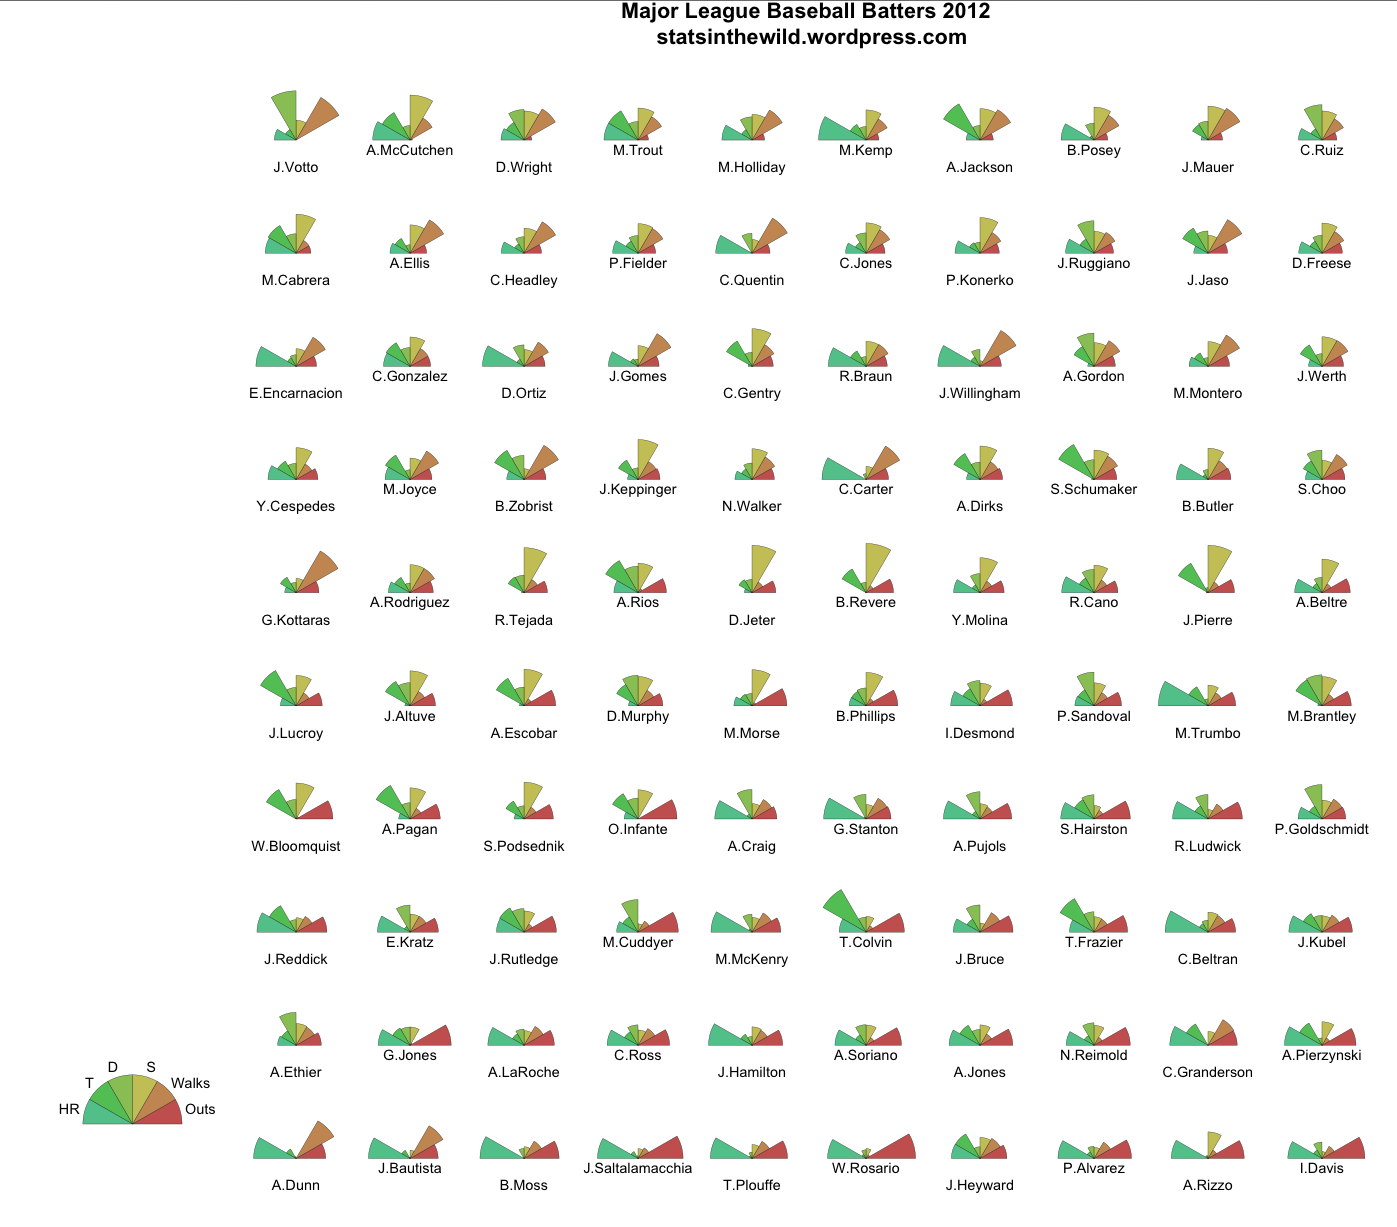
Here are some star plots for major league baseball batters, pitchers, and ball parks. The star plots represent the outcomes of a particular at bat for a hitter, a pitcher, or at a given ball park. For each plot, batter, pitcher, and ball park was varied, while the other two parameters were filled in with the average value. For instance, all batters outcomes are calculated as if they were facing J. Kinney at Wrigley Field; Pitchers data was calculated as if they were facing K. Medlen at Wrigley; and Park factors were calculated as the outcome of J. Kinney vs K. Medlen at different ball parks. The data use to calculate these were downloaded from baseball-reference.com and includes the results every single plate appearance so far this season (about 125,000 so far) and where the game was played. Six outcomes to an at bat were considered: out, walk, single, double, triple, and home run. The probability of each of these events was estimated creating a vectors of probabilities with six elements corresponding to each of the six outcome considered. I’ve chosen to display this data using the star plots below. The key to the star plot can be found in the lower left corner of each plot and displays the probabilities of each outcome relative to other batters. For instance, a large blue pie piece on the left indicates that batter’s plate appearance ends with a HR more often relative to other players. Likewise, a large red pie on the right indicates that the batter’s plate appearance ends in an out more often than other players.
I’ve chosen 100 batters based on their wide range of hitting styles. In the first row, you’ll players who make outs at the lowest rates relative to other players. These include players like Joey Votto, Andrew McCutchen, David Wight, and Mike Trout. Further down, you’ll start to see players who you might describe as single’s hitters. These include players like Ruben Tejada, Derek jeter, B. Revere, and Juan Pierre. Finally, towards the bottom row, you’ll see the players who are primarily power hitters like Adam Dunn and Jose Bautista with large blue, for home run,s and orange, for walks, pie pieces, with significant red for outs. Other players on this row like Saltalamacchia, Plouffe, and Rosario have the large blue and significant red pieces, but they lack walks.
The star plot for pitchers is below. The first thing we need to say here is that Justin Verlander is very, very good at pitching a baseball. Some other interesting pitchers here are Yu Darvish, Edison Volquez, and Carlos Zambrano. They seem to give up relatively few hits, but they give up many more walks that the average pitcher.

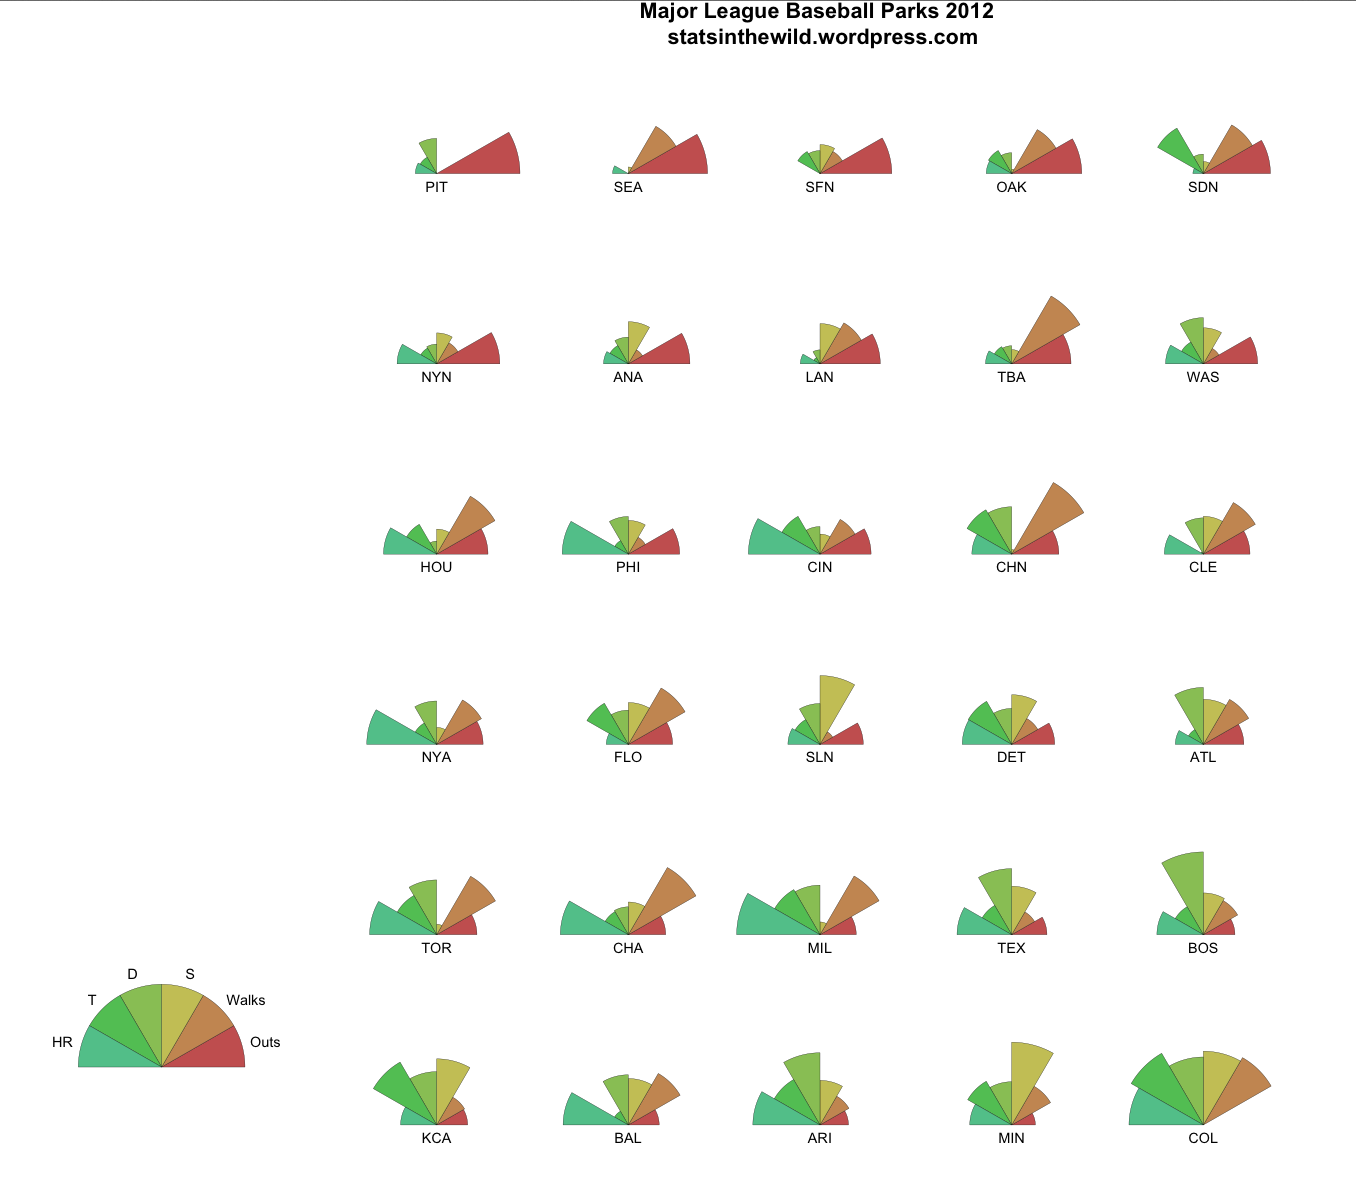
These plots are ordered from highest to lowest probability that an out will be made in a given plate appearance. Pittsburgh, Seattle, and San Francisco lead the way in pitching friendly parks. These are the same as the bottom three according to ESPNs measure of Park factor. The most hitter friendly park is, no surprise, Coors field in Colorado. Other hitter friendly parks include Target and Chase field in Minnesota and Arizona, respectively. Arizona is expected here, but Minnesota is a little bit surprising. It looks like, while it is rare to make an out, most hits are only singles, which don’t generate as many runs are their extra base counterparts. Home run friendly parks include Coors, Chase, Camden Yards, Miller, Comisky, and Yankee Stadium. Fenway park is solidly in the hitter category, but it gets that way, rather than by giving up many homeruns, by yielding a greater percentage of doubles than any other park.
Cheers.
I saw a talk at JSM where I was introduced to a fun new (well, new to me) game to play during the NCAA tournament. First, teams are assigned a price based on their seed. This can be done in many ways, but it was set in the talk that the one seeds cost 25 cents, the two seeds cost 19 cents, all the way down to the 15 and 16 seeds which were a penny each. The goal is to choose a set of teams, that costs, in total, one dollar, that will win the most number of games in the NCAA tournament. So picking all the number one seeds, which will cost exactly one dollar, but the most wins they can earn is 19 (4 each to the final four and then one each for the two semifinals and one for the championship). So, according to the speaker, this usually won’t get you the win. First of all, this game is awesome. Once you can stop thinking about how awesome this game is, the next logical question is: How do you choose the optimal set of teams?
Douglas Noe and his student Geng Chen used an evolutionary algorithm to optimize the selection of teams, and they used Ken Pomeroy’s rankings as a guide to the probability that one team will beat another team in the tournament. Now, I don’t think I ever heard of evolutionary algorithms, and, if I have, I’ve totally forgotten about them. But they are wicked cool. Here is the wikipedia page for evolutionary algorithms, and it’s worth checking out. Does anyone have any suggestions as to a good resource for an introduction to evolutionary algorithms?
Cheers.
Which country wins the Olympics? Right now China is in the lead for most medals (73: 34 gold, 21 silver, 18 bronze) and most golds. The USA is second in both categories (71: 30 gold, 19 silver, 22 bronze). In 2008 there was some controversy about whether the ranking should be done by largest total number of medals or largest golds; here’s the table from Wikipedia. If I recall correctly (though it’s surprisingly hard to search for this) non-Americans were saying that the “right” way to do it is by golds, but Americans insisted on doing it by total medals. Not surprisingly the USA had the most total medalists in ’08 (110, to China’s 100) but not the most golds (36, to China’s 51).
But it hardly seems fair to expect, say, France to get as many medals as the USA, simply because they have about one-fifth the population…
View original post 516 more words
Canada loves winning bronze medals….
StatsInTheWild MLB rankings as of August 6, 2012 at 8:17pm. SOS=strength of schedule
| Team | Rank | Change | Record | ESPN | TeamRankings.com | SOS | Run Diff |
| NYY | 1 | – | 63-44 | 3 | 1 | 5 | +92 |
| Texas | 2 | – | 63-44 | 4 | 2 | 13 | +83 |
| LA Angels | 3 | – | 58-51 | 9 | 6 | 7 | +49 |
| Washington | 4 | ↑2 | 65-43 | 2 | 4 | 23 | +82 |
| ChiSox | 5 | ↑4 | 59-48 | 7 | 5 | 14 | +64 |
| Cincinnati | 6 | ↑5 | 66-42 | 1 | 3 | 29 | +72 |
| Oakland | 7 | ↑1 | 58-50 | 8 | 7 | 8 | +28 |
| Detroit | 8 | ↓1 | 58-50 | 13 | 9 | 12 | +24 |
| TampaBay | 9 | ↑1 | 56-52 | 14 | 12 | 3 | +19 |
| Atlanta | 10 | ↑5 | 62-46 | 5 | 8 | 21 | +62 |
| Boston | 11 | ↓6 | 54-55 | 17 | 13 | 6 | +29 |
| Toronto | 12 | ↓8 | 53-55 | 18 | 14 | 2 | +9 |
| St. Louis | 13 | ↑1 | 59-49 | 10 | 15 | 30 | +110 |
| Baltimore | 14 | ↓2 | 57-51 | 16 | 11 | 1 | -57 |
| Pittsburgh | 15 | ↓2 |
61-46 | 6 | 10 | 28 | +36 |
| Seattle | 16 | ↑1 | 51-59 | 20 | 17 | 4 | -3 |
| Arizona | 17 | ↑4 | 55-53 | 15 | 19 | 26 | +42 |
| SF | 18 | ↓2 | 59-49 | 11 | 16 | 27 | +19 |
| LA Dodgers | 19 | ↓1 |
59-50 | 12 | 18 | 25 | +15 |
| NY Mets | 20 | – | 53-56 | 19 | 20 | 17 | -5 |
| Minnesota | 21 | ↑3 | 47-61 | 25 | 22 | 11 | -79 |
| Kansas City | 22 | – | 45-62 | 26 | 23 | 10 | -60 |
| Cleveland | 23 | ↓4 | 50-58 | 21 | 21 | 9 | -90 |
| Milwaukee | 24 | ↓1 | 48-59 | 22 | 26 | 19 | -13 |
| Philadelphia | 25 | – | 49-59 | 24 | 24 | 19 | -29 |
| Miami | 26 | – | 49-60 | 23 | 25 | 15 | -100 |
| Chic Cubs | 27 | ↑1 | 43-63 | 28 | 27 | 18 | -79 |
| San Diego | 28 | ↓1 | 46-64 | 27 | 28 | 22 | -61 |
| Colorado | 29 | – | 38-68 | 29 | 29 | 20 | -117 |
| Houston | 30 | – | 36-73 | 30 | 30 | 16 | -142 |
Past Rankings:
Cheers.


