|
|
Total: Under 40.5
Prediction: Cardinals 24-19 (62.5%)
Pick: Buccaneers +6.5
Total: Under 50.5
Prediction: Panthers 22-19 (56.4%)
Pick: 49ers +13.5
Total: Under 45.5
Prediction: Ravens 23-21 (54.5%)
Pick: Browns +7
Total: Over 42.5
Prediction: Broncos 26-21 (63.8%)
Pick: Colts +6
Total: Over 45.5
Prediction: Lions 25-18 (63.8%)
Pick: Lions -5.5
Total: Under 47
Prediction: Texans 21-20 (52.8%)
Pick: Chiefs +2
Total: Under 43.5
Prediction: Patriots 26-21 (64.3%)
Pick: Dolphins +6.5
Total: Over 41.5
Prediction: Saints 27-26 (51.7%)
Pick: Saints +4.5
Total: Under 53.5
Prediction: Falcons 23-22 (51.3%)
Pick: Falcons +4.5
Total: Under 50
Prediction: Steelers 24-22 (54.5%)
Pick: Bengals +3.5
Total: Under 48.5
Prediction: Chargers 26-19 (68.1%)
Pick: Chargers -3
Total: Under 47
Prediction: Seahawks 22-17 (64.2%)
Pick: Seahawks -3.5
Total: Over 39
Prediction: Washington Football Team 23-22 (50.0%)
Pick: Cowboys +3.5
Total: Under 45.5
Prediction: Packers 23-21 (55.9%)
Pick: Vikings +2.5
Total: Under 44
Prediction: Bears 25-24 (50.8%)
Pick: Eagles +3
Total: Over 43 PUSH
Key: Team -Median Record (Mean Wins)
New England: 12-4 (11.562)
Buffalo: 7-9 (7.388)
NY Jets: 7-9 (7.068)
Miami: 6-10 (6.243)
Cincinnati: 10-6 (10.348)
Pittsburgh: 10-6 (10.249)
Baltimore: 9-7 (8.666)
Cleveland: 5-11 (4.557)
Houston: 8-8 (8.399)
Indianapolis: 8-8 (7.962)
Tennessee: 5-11 (4.621)
Jacksonville: 4-12 (3.666)
Denver: 12-4 (12.228)
Kansas City: 10-6 (10.127)
Oakland: 5-11 (5.107)
San Diego: 8-8 (8.212)
Dallas: 8-8 (8.036)
Philadelphia: 8-8 (7.549)
NY Giants: 7-9 (6.913)
Washington: 5-11 (5.347)
Green Bay: 13-3 (12.476)
Detroit: 9-7 (8.978)
Minnesota: 9-7 (8.542)
Chicago: 7-9 (7.042)
Carolina: 11-5 (10.757)
New Orleans: 8-8 (8.295)
Atlanta: 6-10 (6.510)
Tampa Bay: 4-12 (4.386)
Seattle: 13-3 (13.386)
Arizona: 9-7 (9.089)
San Francisco: 7-9 (6.724)
Los Angeles (nee St. Louis): 6-10 (5.567)
AFC
NFC
Wild Card Games
Kansas City (6) beats Cincinnati (3)
Pittsburgh (5) beats Houston(4)
(3) Carolina beats (6) Detroit
(5) Arizona beats (4) Dallas
Divisional Round
(1) Denver beats (6) Kansas City
(2) New England beats (5) Pittsburgh
(1) Seattle beats (5) Arizona
(3) Carolina beats (2) Green Bay
Conference Championships
(1) Denver beats (2) New England
(1) Seattle beats (3) Carolina
Super Bowl
(1) Seattle beats (1) Denver
|
|
Prediction: Broncos 23-20 (58%)
Pick: Broncos +3
Total: Over 40.5
Total: Over 44 PUSH
Prediction: Falcons 25-21 (60.1%)
Pick: Falcons -2.5
Total: Under 47
Prediction: Ravens 22-20 (56.2%)
Pick: Bills +3
Total: Under 44.5
Prediction: Cowboys 24-22 (56.8%)
Pick: Dallas +1 PUSH
Total: Under 47.5
Prediction: Texans 23-20 (58%)
Pick: Bears +5.5
Total: Over 42.5
Prediction: Colts 23-22 (51.8%)
Pick: Lions +3
Total: Under 50.5
Prediction: Packers 26-19 (67%)
Pick: Packers -3.5
Total: Under 47.5
Prediction: Chiefs 24-20 (60.5%
Pick: Chargers +6.5
Total: Under 46
Prediction: Saints 27-22 (63.8%)
Pick: Saints -3
Total: Under 50.5
Prediction: Bengals 21-20 (51.5%)
Pick: Bengals -1
Total: Under 42
Prediction: Eagles 26-22
Pick: Eagles -3.5
Total: Over 41
Prediction: Seahawks 25-17
Pick: Dolphins +10.5
Total: Under 44
Prediction: Vikings 21-19
Pick: Titans +2.5
Total: Under 40
Prediction: Steelers 25-22 (56.4%)
Pick: Steelers -2.5
Total: Under 50
Prediction: 49ers 21-18 (57.3%)
Pick: 49ers +2.5
Total: Under 43
One of my colleagues, Tim O’Brien, showed a slide in the first week of his classes describing how he first found out about R:

Here is that email from 1996 (TWENTY years ago!!!) where Tim asked Ross Ihaka how to get R, and Ross helped him out. #amazing #history

Cheers.
There is a general election happening right now and the NFL season is starting. Let’s talk about the candidates chances in terms of NFL games.
At the The Upshot they track 8 different presidential forecasts, 5 of which give actual percentages. Currently (at 11:07am on September 2nd) Clinton’s win probabilities range from a high of 94% based on the Princeton Election Consortium’s forecast to a low of 74% for FiveThirtyEight and DailyKos. (PredictWise has it at 77% and the New York Times has it at 87%).
Let’s put these probabilities in context using Pro Football Reference’s NFL win probability calculator:
Let’s start by looking at the worst case scenario for Trump: 6% chance to win. (Unless otherwise noted, I’m assuming the spread is 0.)
Now let’s look at Trump’s best case scenario for Trump: 26%
In Clinton’s best case scenario, she has 94% chance to win the election.
In Clinton’s worst case scenario, she has 74% chance to win the election.
So Clinton’s chances of winning right now are comparable to a team that is somewhere between an 8.5 and 21 point favorite. Or a team that is up somewhere between 6 and 15 points at half time.
Sort of unrelated fun fact that I found when looking up Super Bowl spreads: That last three teams to be favored by more than 10 have all lost outright (2008 New England (-12), 2002 St. Louis (-14), 1998 Green Bay (-11)).
Cheers.
Based on @predictit state electoral college markets, Clinton has about a 94.1% chance to win in November compared to a 5.6% chance for Trump (with a 0.3% chance of a tie). Details of how I estimated these probabilities are here and the code is on github here.
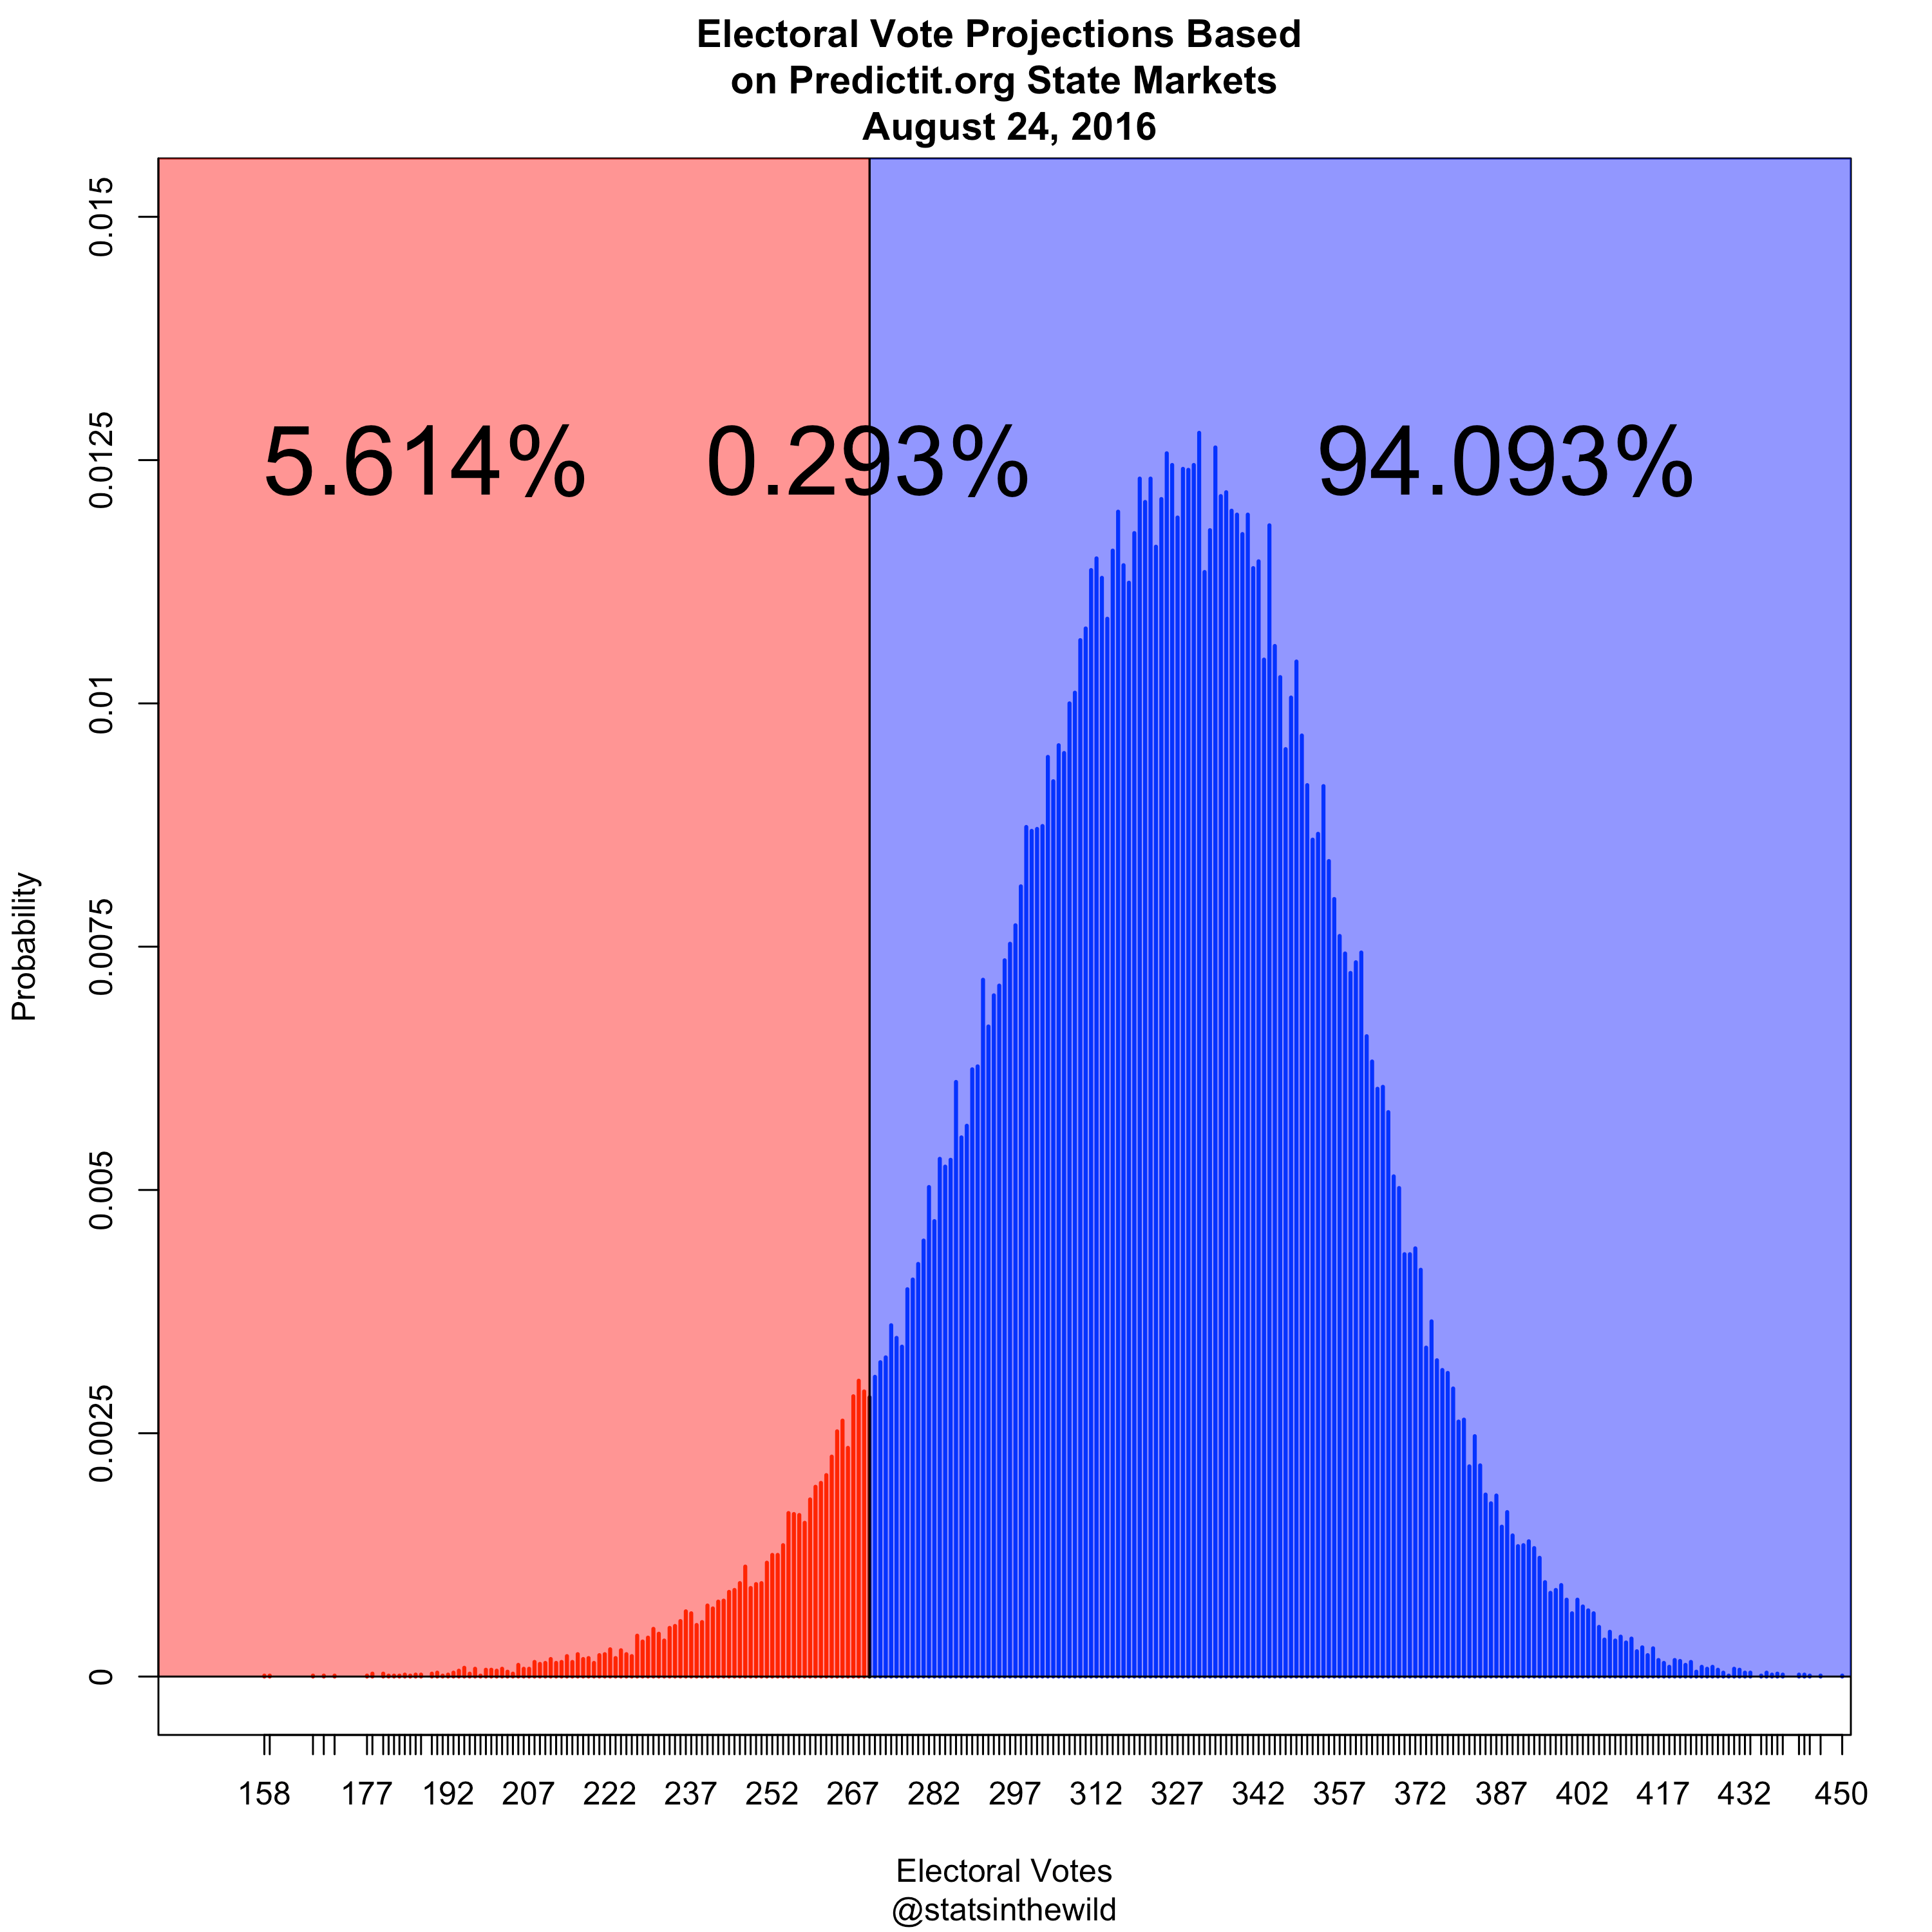
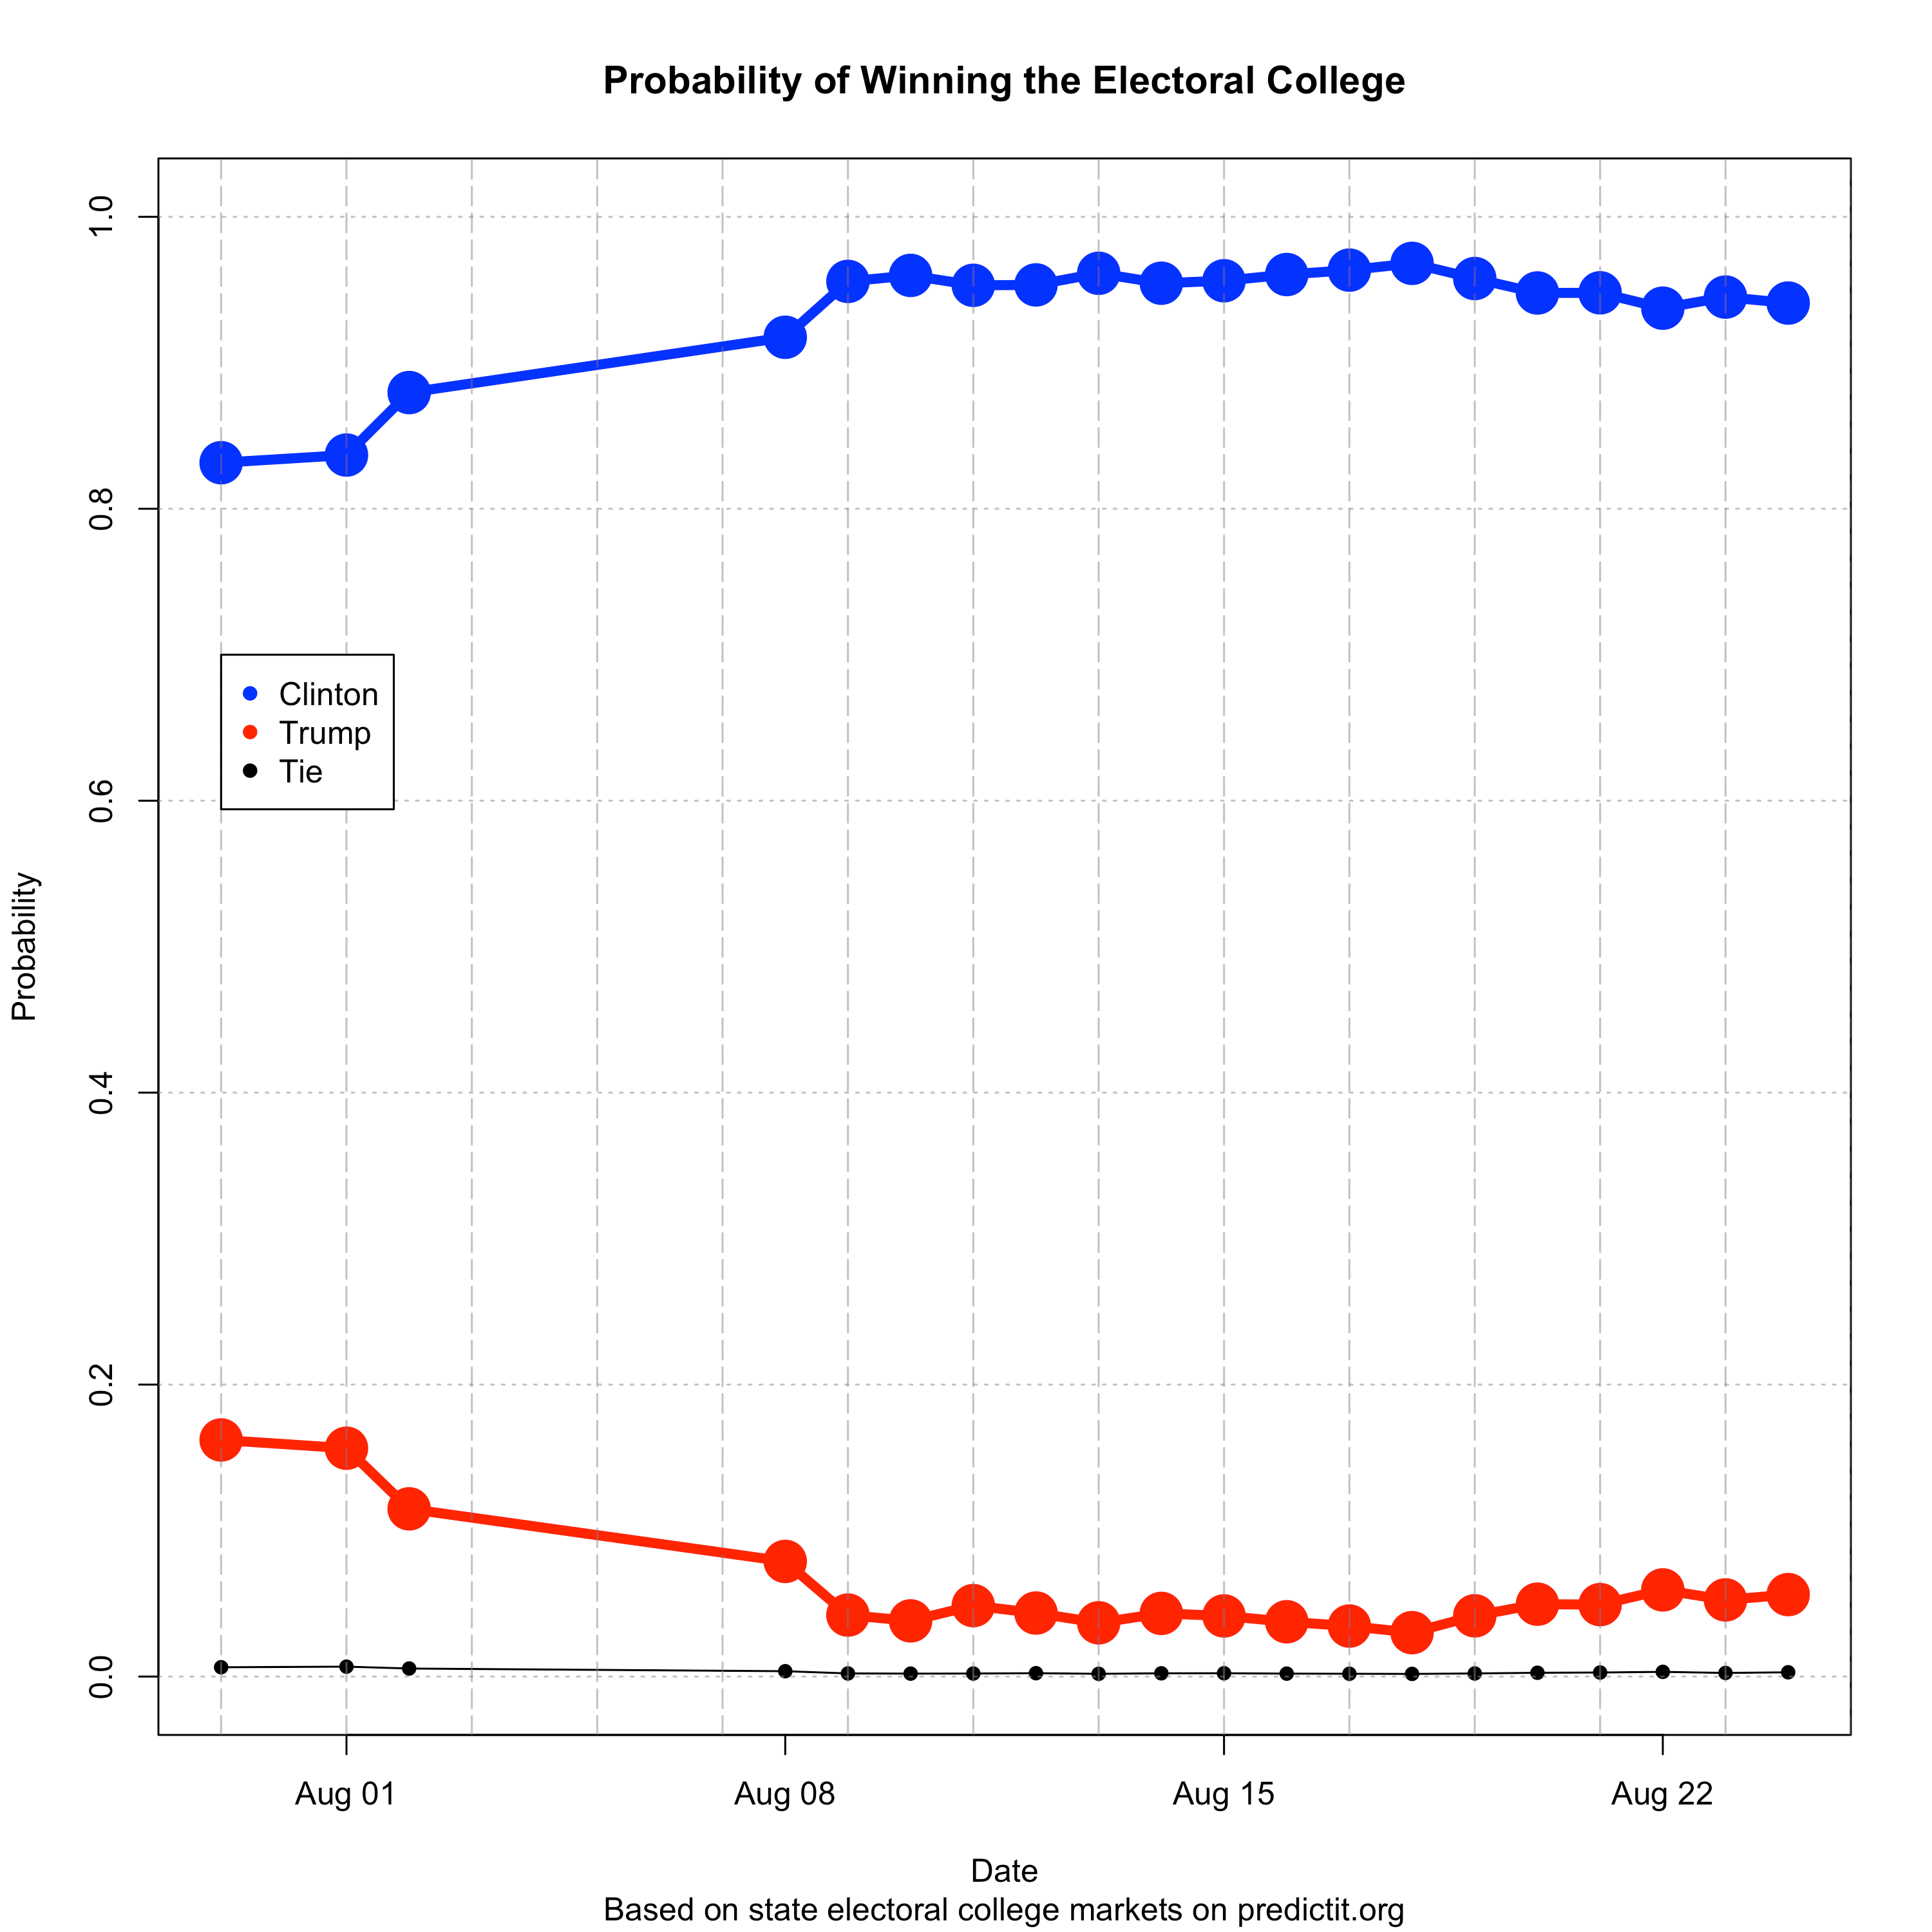
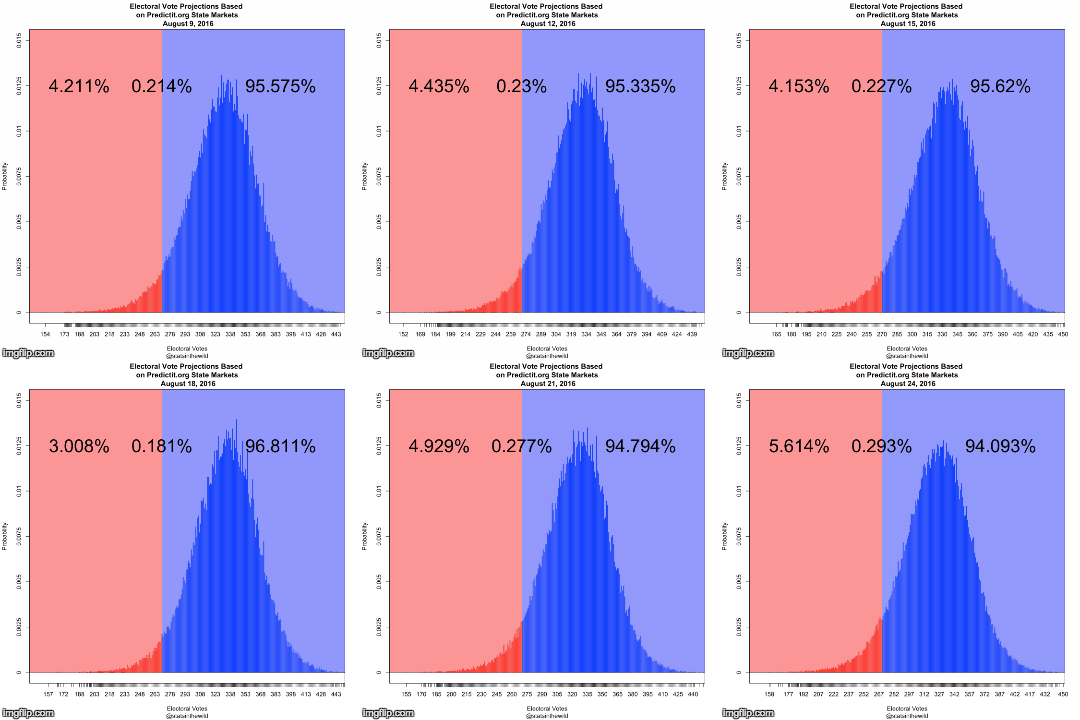
Overall in the past week, there has been a small shift towards Trump. Clinton hit a high of about 96.8% on August 18 and is down a few percentage points today to about 94.1% This has been pretty steady since around August 9th when clinton jumped to over 90% and she’s been above that ever since. This is good news for Clinton who, as recently as August 1st was in the low 80’s percentage wise to win the electoral college. It will be interesting to see if Trump can make any sort of comeback at all or if Clinton will hold steady in the 93-97% range up until the election.
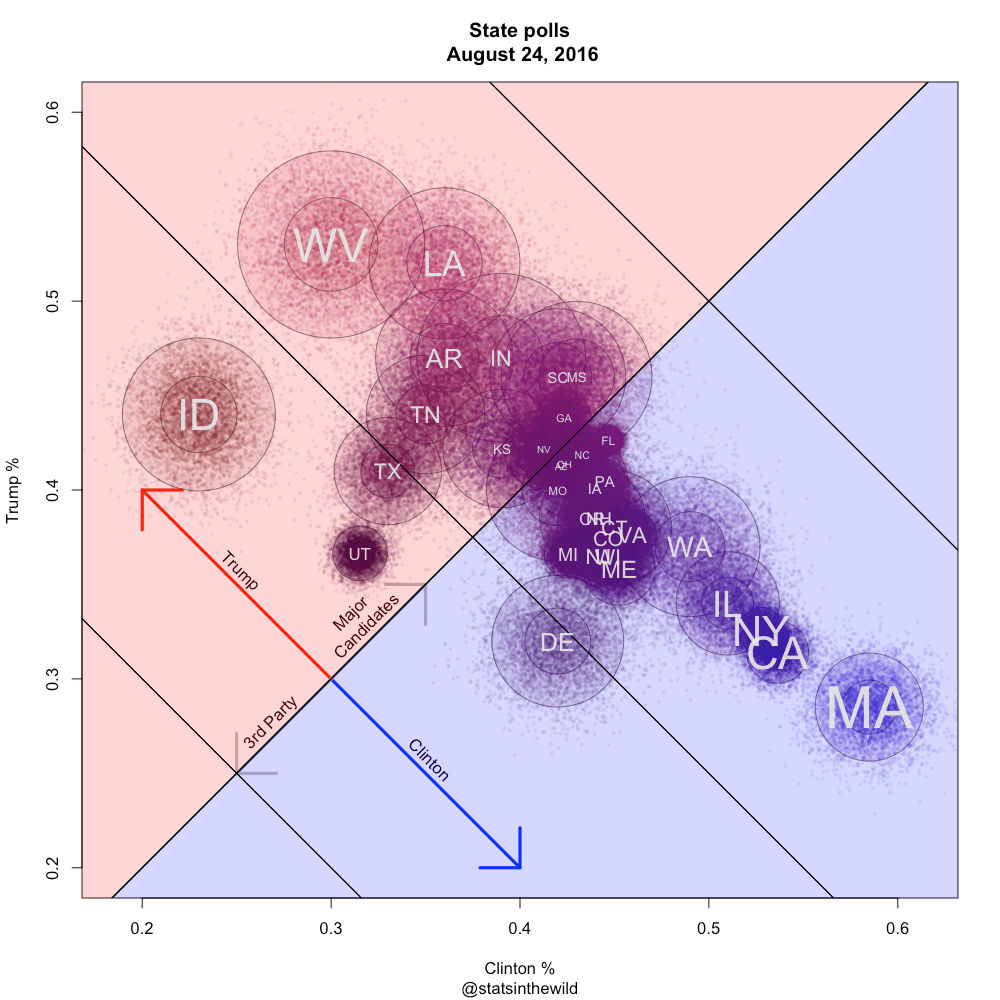
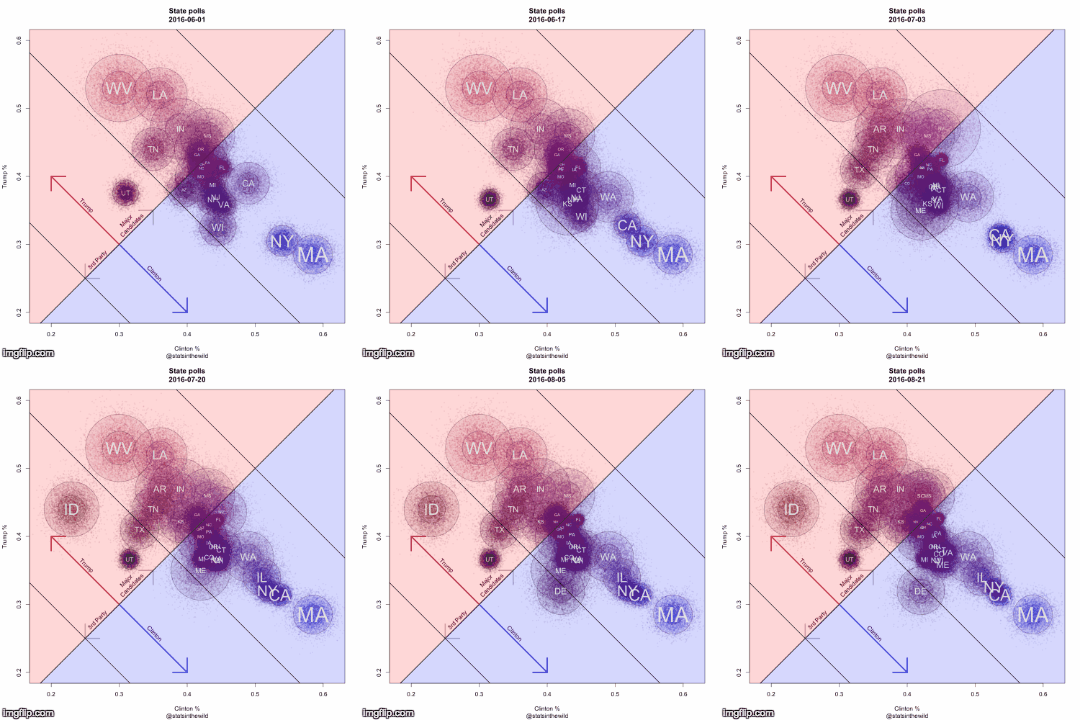
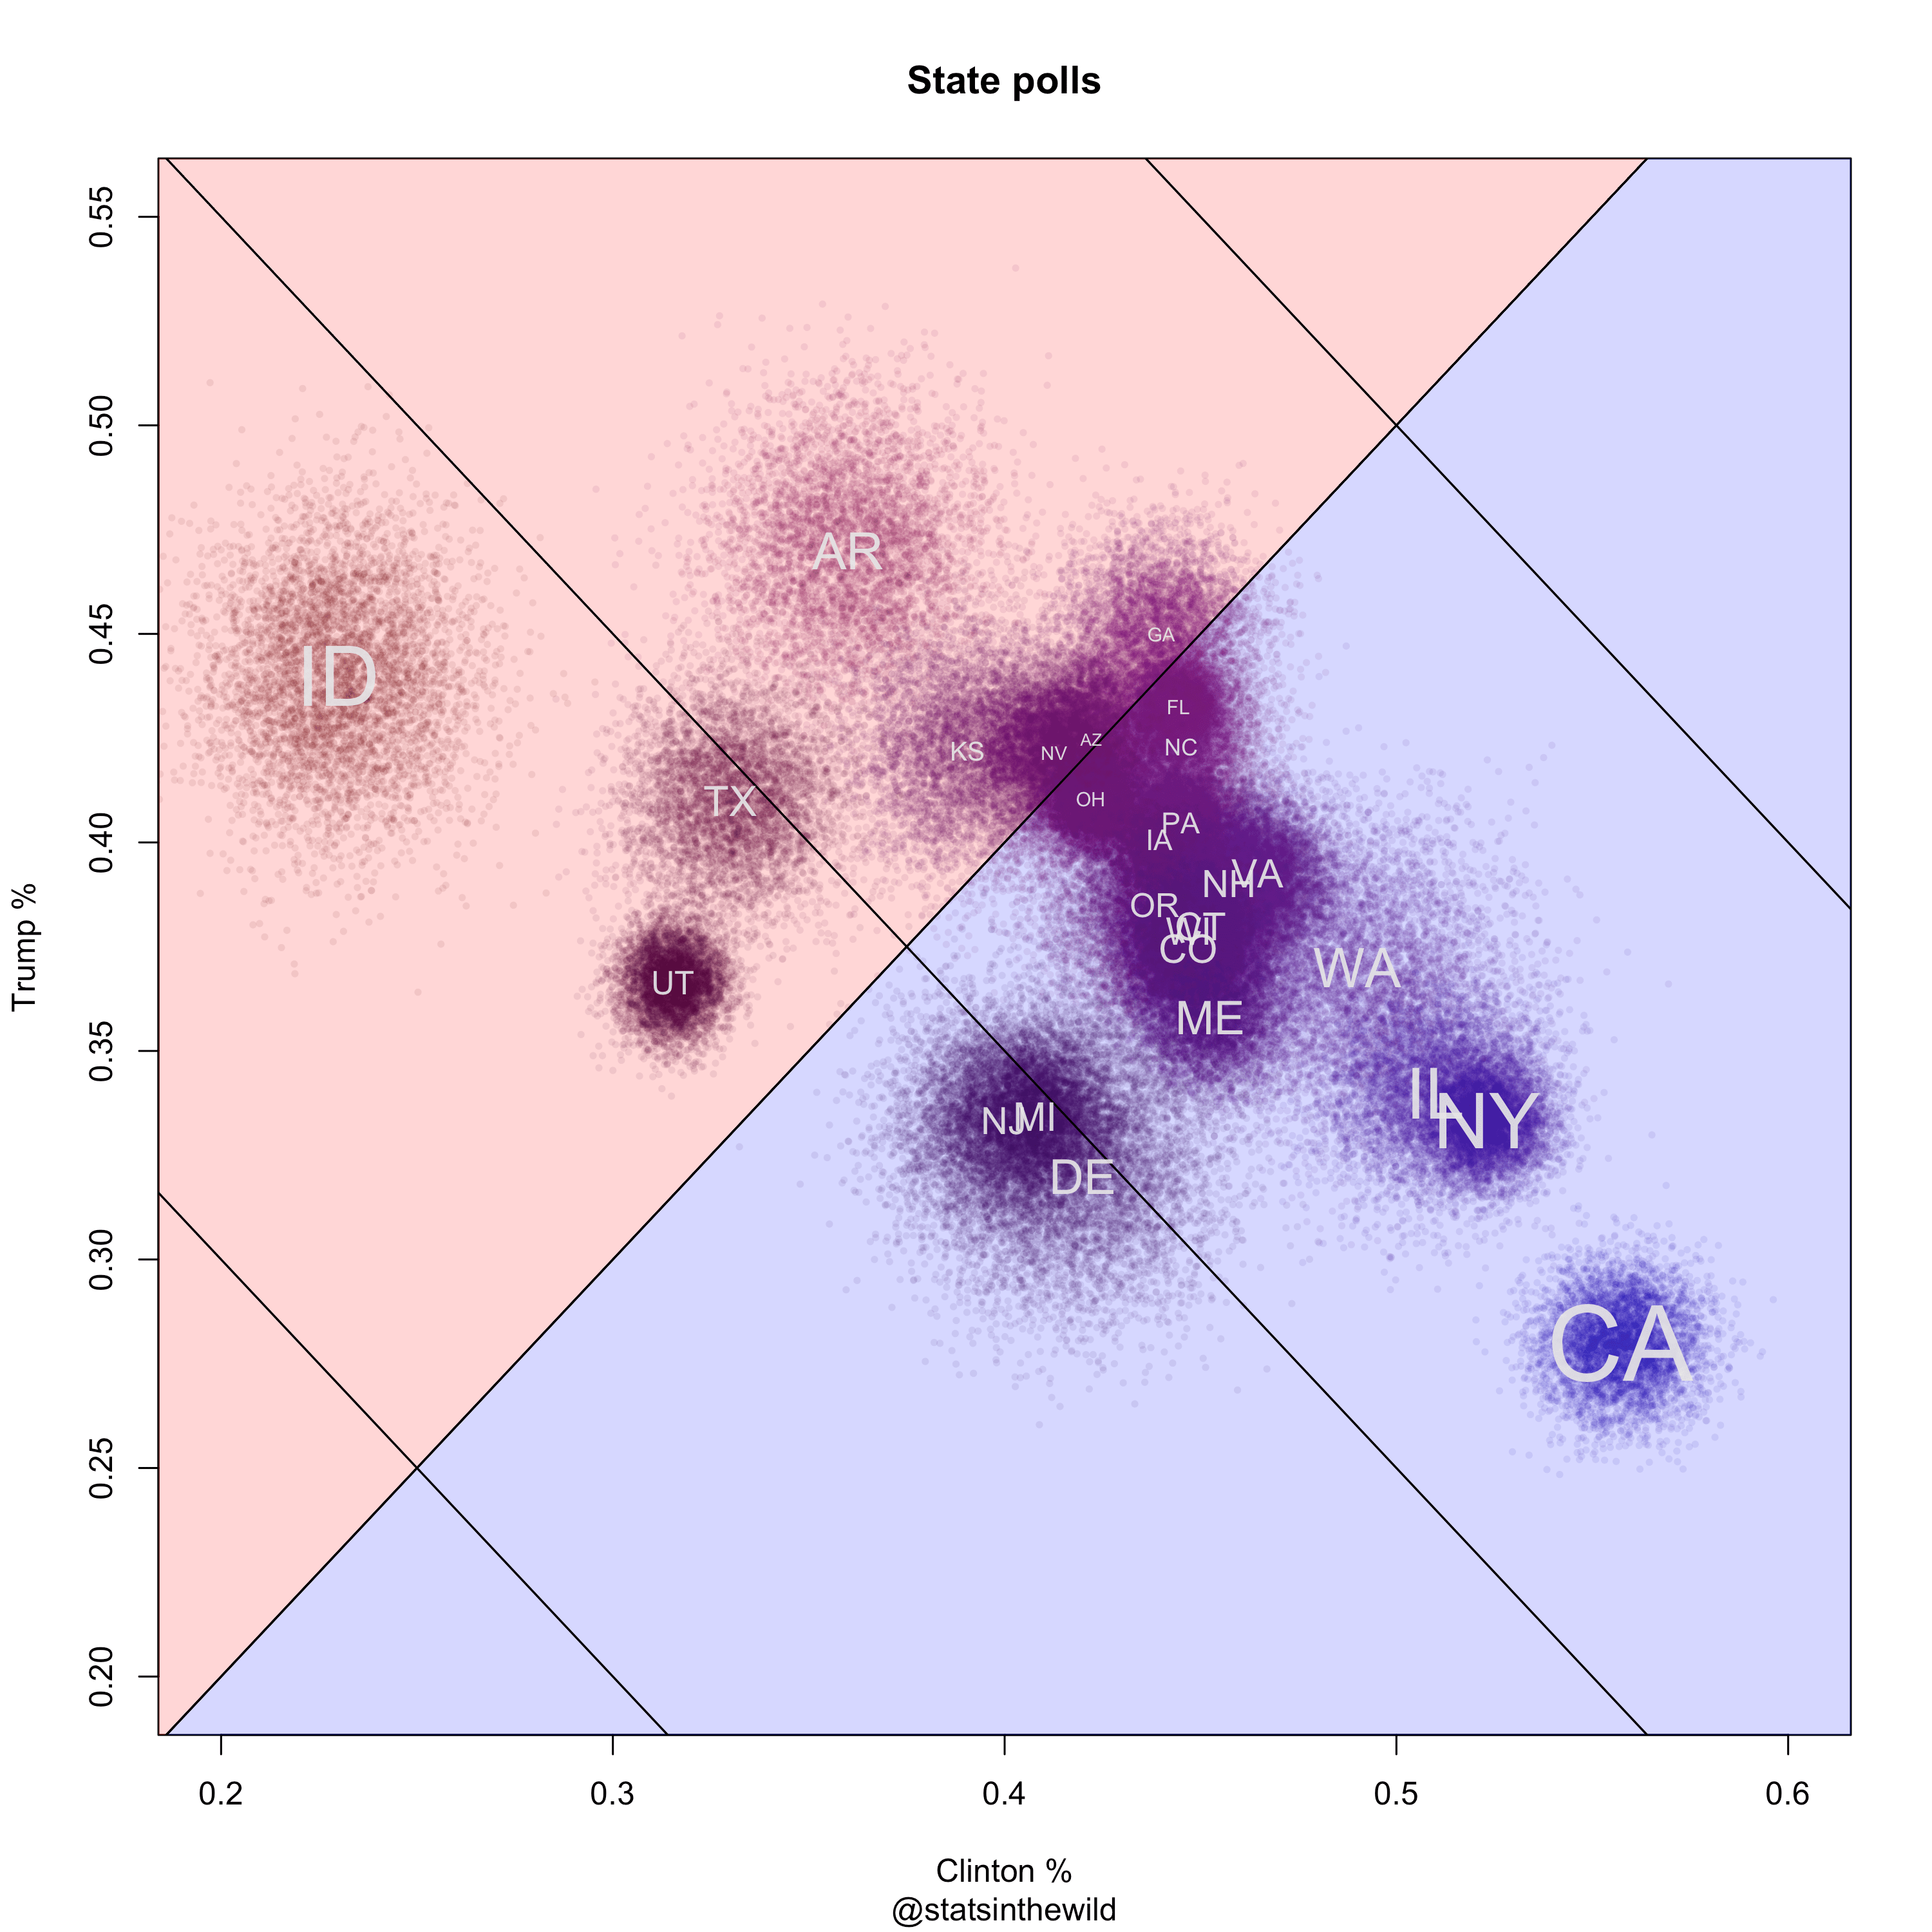
I’ve also looked at state polling information based on the Huffington Post’s collection of polls. (You can get my scraping and plot building code here.) You can see a few new states have been added since the last time including West Virginia and Massachusetts. Not surprisingly, these are deep red and deep blue, respectively. States with no polling data in the Huffington Post data set will not appear in this graph. What I still find fascinating about this plot is how well third party candidates are doing in a few states. States like Idaho, Utah, Texas, and Delaware seem very receptive to the idea of voting for a third party candidate like Gary Johnson. It will be interesting to see if Johnson can somehow win a state like Idaho or Utah, which both have large Mormon populations and loathe both major candidates.
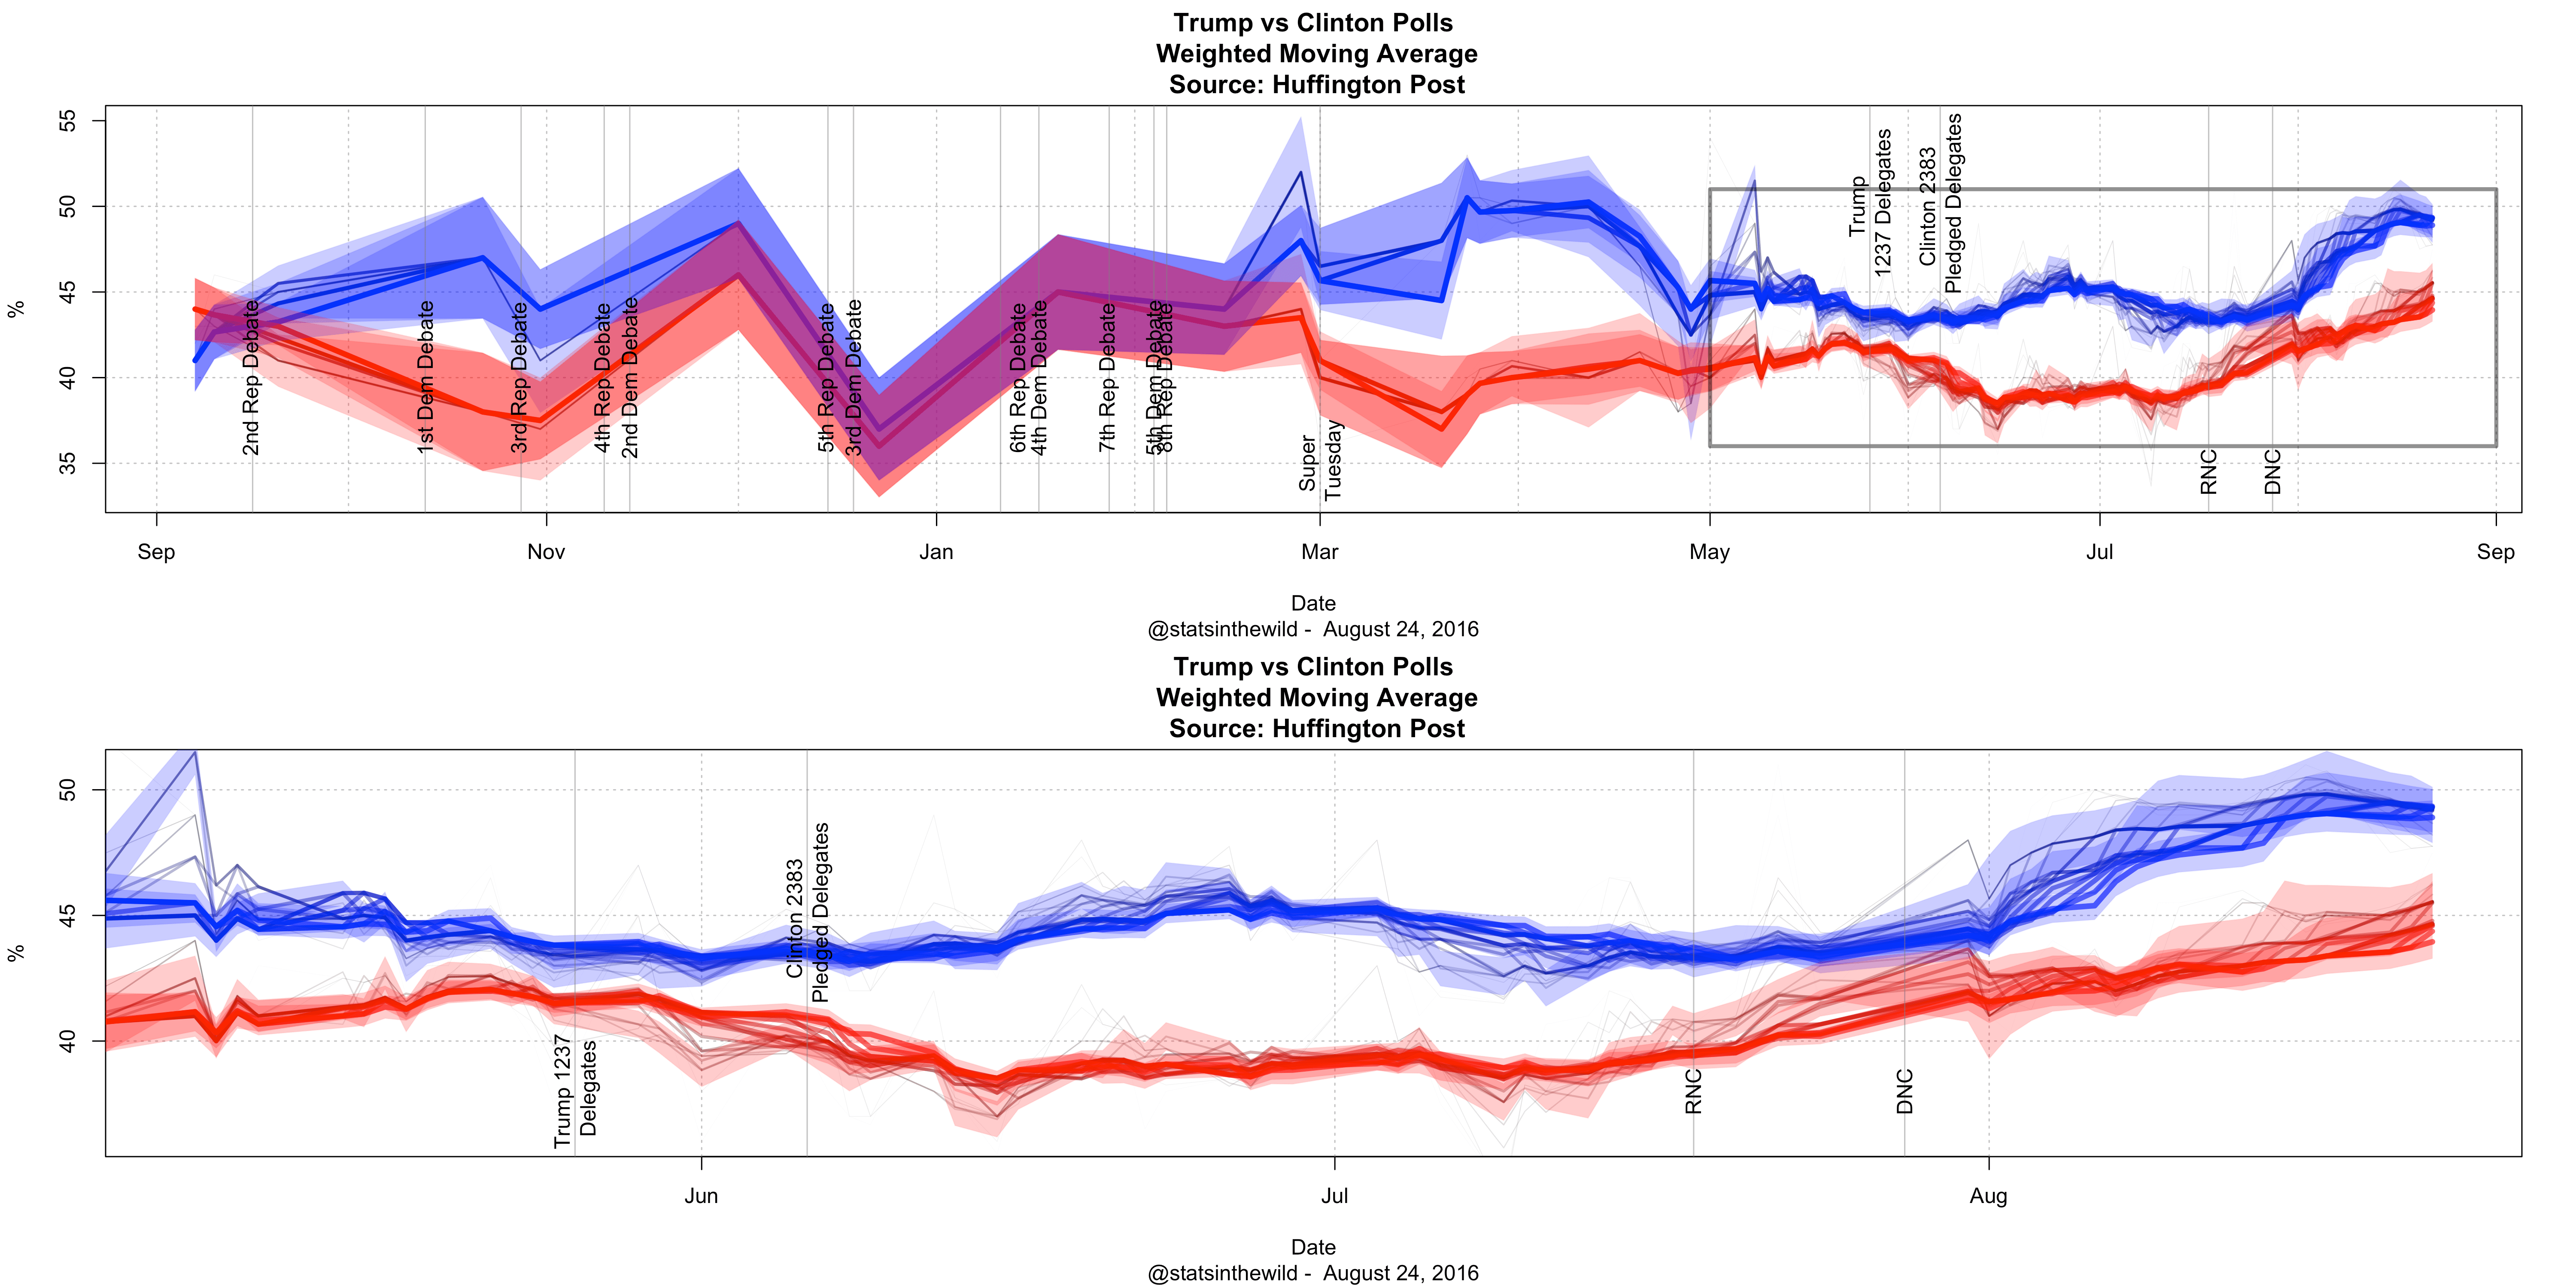
I’ve also put together a plot of national polling over time. The top plot here follows the race from September 2015 to present whereas the bottom plot focuses on May 1, 2016 – present. I’ve also indicated when some key events took place like debates, Super Tuesday, when each candidate got the clinching number of delegates, and their primaries.
You can see that before about May of this year, polling between Trump and Clinton was fairly sparse as they were still battling in their respective primaries. After that though more Clinton vs Trump polls were taken and the margin of error for these polls drops considerably. Both candidates continue to increase their polling numbers, but the gap between Clinton and Trump has been a pretty consistent 3-5% since right after the Democratic National Convention.
Finally, I made GIFs! Here are the state polls over time.
And here is the electoral college distribution over time.
Cheers!
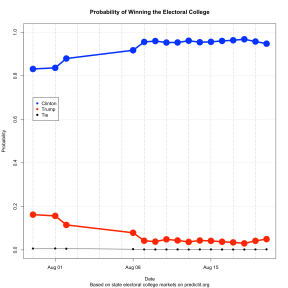
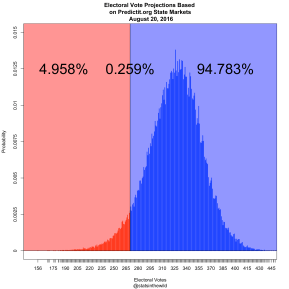
Recently, did some cool stuff by scraping the data from predictit.org estimating Clinton vs Trump win probabilities using data from their state markets (GitHub code here).
Last night, I decided to try to get some polling data and Huffington Post makes their polling data available through a very easy to use API in JSON format (GitHub code here).
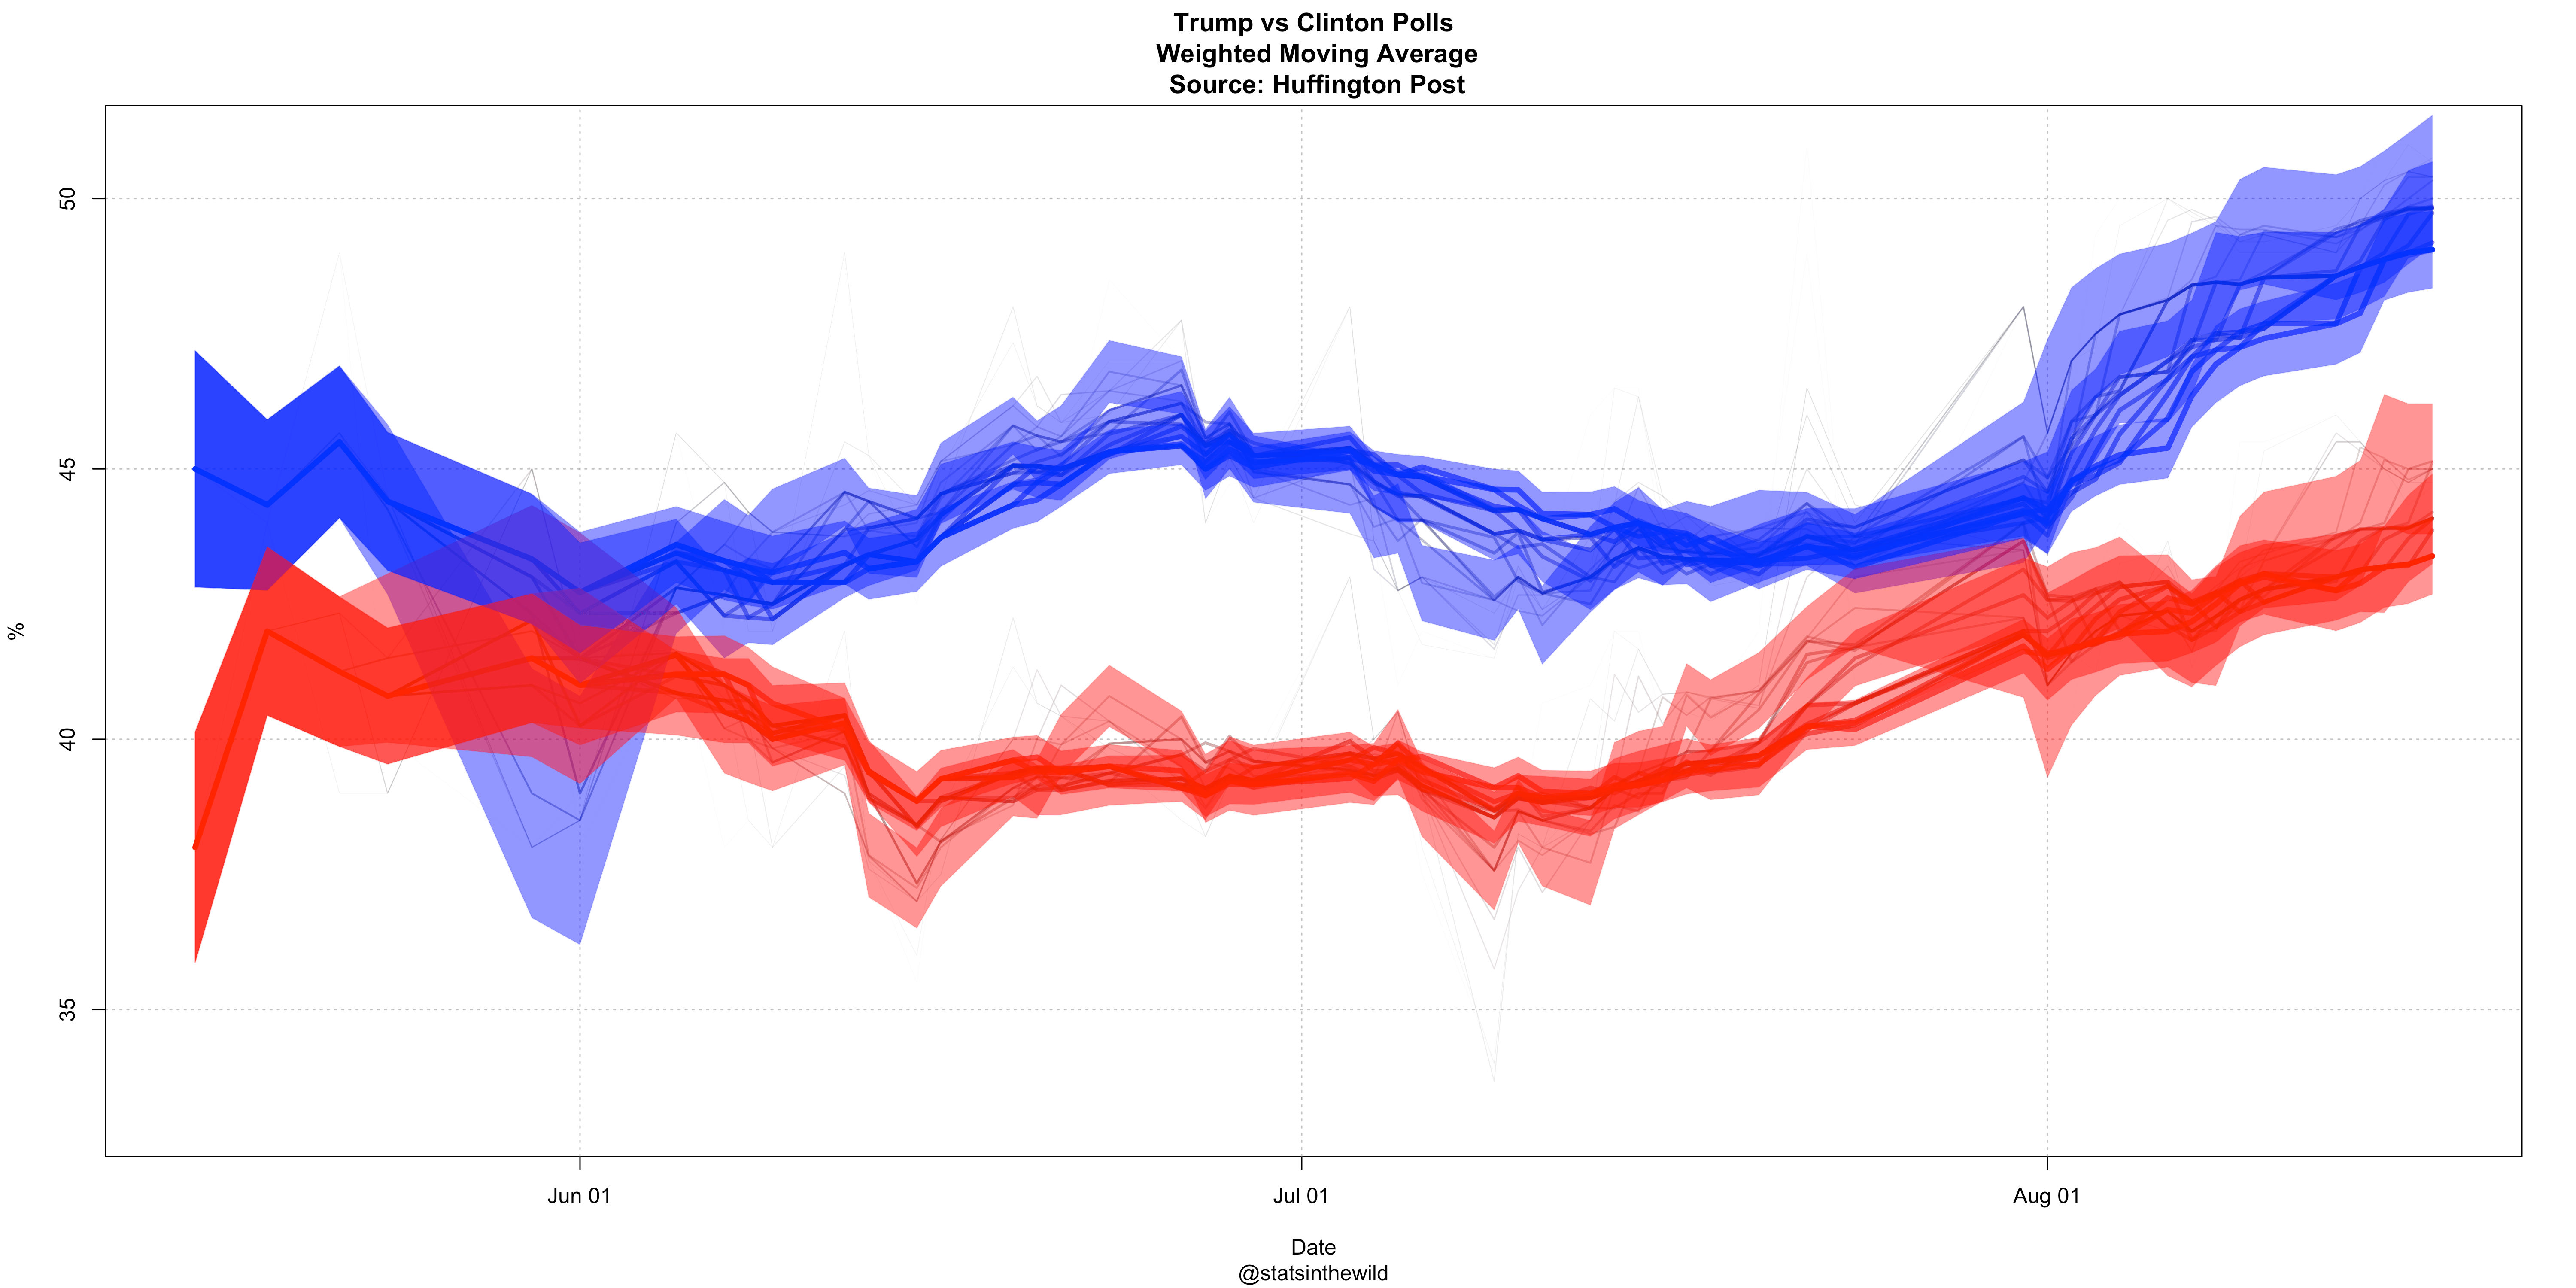
This first plot uses the national polls of Trump vs Clinton. All polls that were conducted on “likely” or “registered” voters were included. Next I computed the weighted moving average of each of these polls using different moving average windows from 1, 2, 3,…, 21 days. I then plotted all of these curves on top of one another with the width, transparency, and color related to how many days were considered in the moving average. The more days included in the moving average the wider and more opaque the line is and the redder/bluer the line is. I then plotter three different confidence bands using the 7, 14, and 21 day moving averages.
I then pulled out all the state polls that were available and computed the weighted average across all polls with “likely” or “registered” voters (I did not consider the timing of the polls). I then computed a mean and standard error for each of these estimates and randomly sampled from the distribution for Trump and Clinton and plotted these random samples on the plot. The wider the spread of the plotted points for each state the fewer people have been polled in that state. So for instance, Utah has had more polling that Idaho. The color is related to what percentage each candidate is receiving in the poll (redder for Trump and bluer for Clinton. I’ve also added lines with negative slope to show what share of support third party candidates are receiving. If you follow the line y=x the states closer to the origin are more receptive to third party candidates. So for instance, Utah and Idaho are giving a lot of support to third party candidates whereas Georgia and Florida are mainly voting for the two major candidates.
Cheers.
“There has been a great deal of hype surrounding neural networks, making them seem magical and mysterious. As we make clear in this section, they are just nonlinear statistical models, much like the projection pursuit regression model described above.” – Page 350, “The Elements of Statistical Learning”,Hastie, Tibshirani, Friedman.
Cheers.

