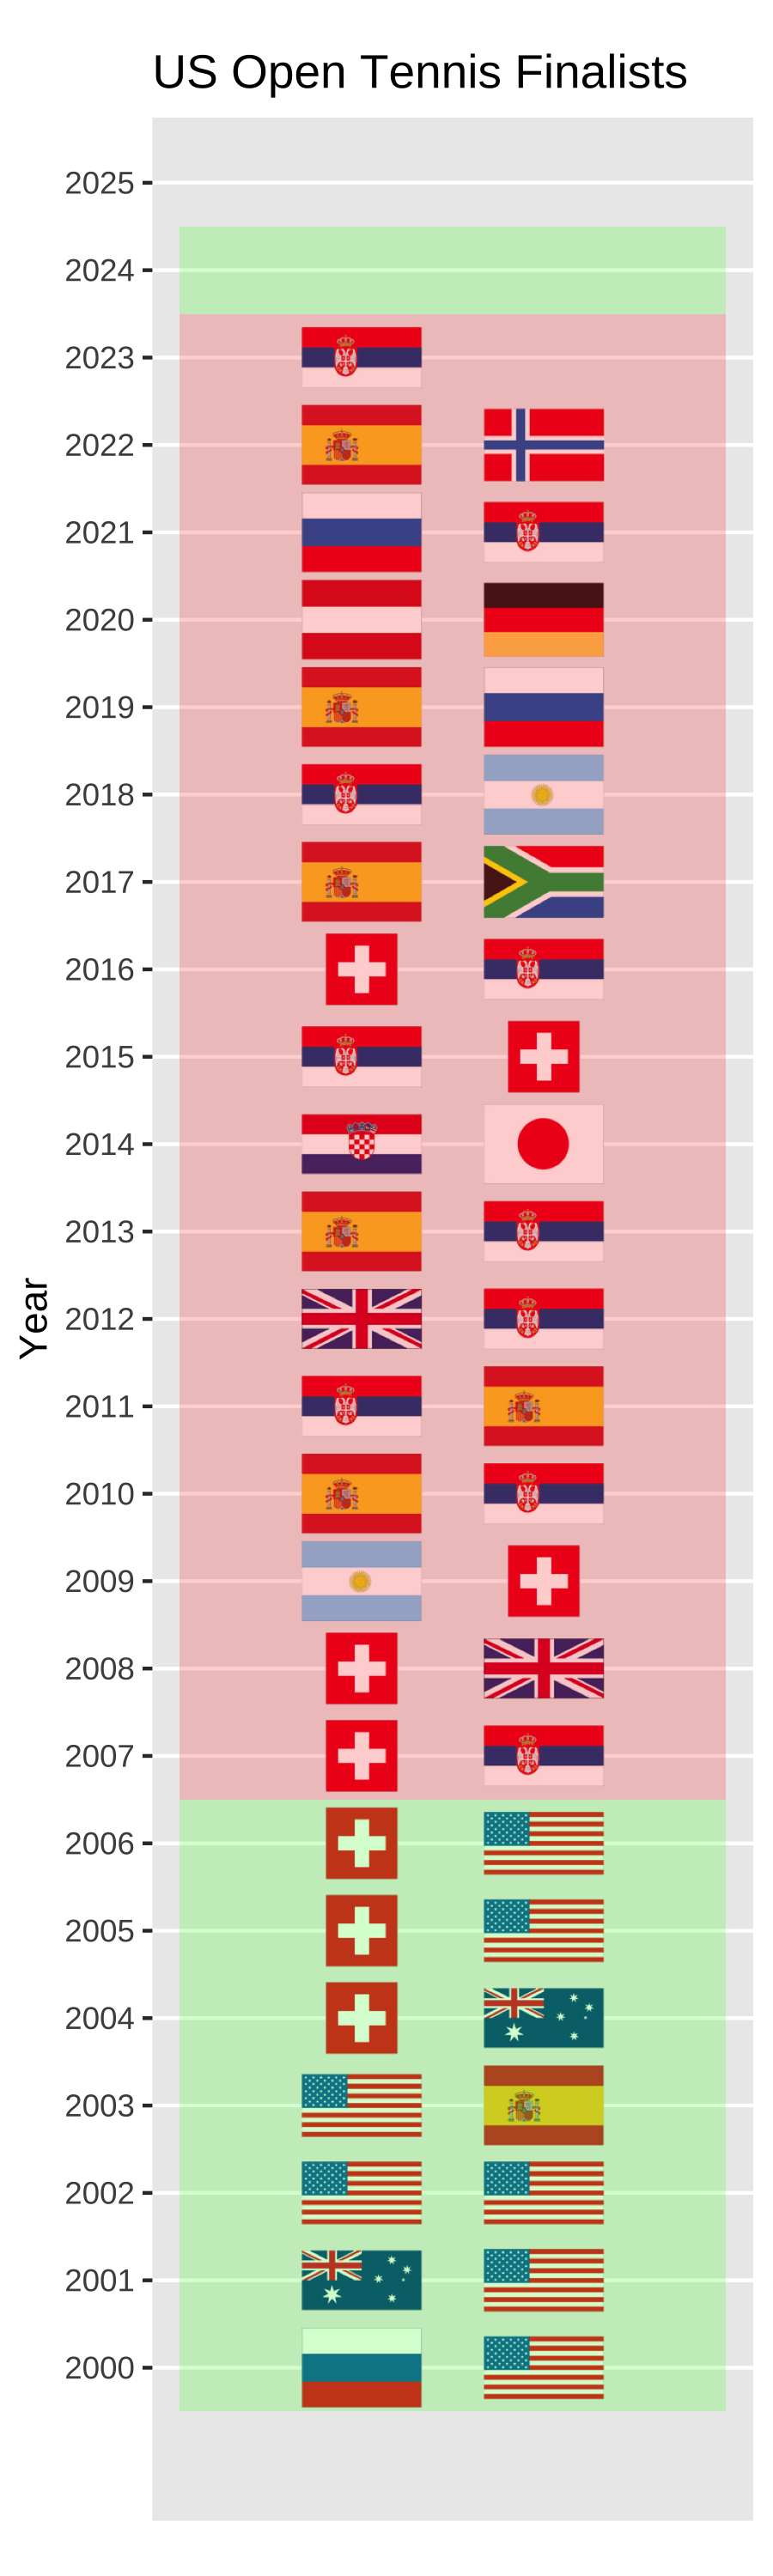
A US drought is over
American Frances Tiafoe defeated Dimitrov in the US Open quarterfinals last evening. Earlier yesterday another American, Taylor Fritz, beat Zverev to also advance to the semifinals. They will face each other on Friday guaranteeing an American will make the finals for the first time since 2006 when Andy Roddick made it to the finals and lost to some guy name Roger Federer. In honor of this feat, I wasted all morning making the graphic below. I’ve posted my bat shit crazy code at the bottom. Suggestions on how to do this better are welcome.
Cheers.
#How do I do this better?
#https://www.kaggle.com/datasets/zhongtr0n/country-flag-urls

library(ggplot2)
library(ggimage)
library(tidyverse)

# d <- data.frame(x = rnorm(10),
#                 y = rnorm(10),
#                 image = sample(c("https://www.r-project.org/logo/Rlogo.png",
#                                  "https://www.worldometers.info//img/flags/small/tn_af-flag.gif"),
#                                size=10, replace = TRUE)
#)
# # plot2
# ggplot(d, aes(x, y)) + geom_image(aes(image=image), size=.05)

finals <- read.csv("/Users/gregorymatthews/usopenfinals.csv")
flags <- read.csv("/Users/gregorymatthews/Downloads/flags_iso.csv")

finals <- finals %>% mutate(Country = ifelse(Country == "CRO","HRV",Country))
finals <- finals %>% mutate(Country = ifelse(Country == "SUI","CHE",Country))
finals <- finals %>% mutate(Country = ifelse(Country == "TCH","CZE",Country))
finals <- finals %>% mutate(Country = ifelse(Country == "FRG","DEU",Country))

finals <- finals %>% mutate(Country.1 = ifelse(Country.1 == "GER","DEU",Country.1))
finals <- finals %>% mutate(Country.1 = ifelse(Country.1 == "RSA","ZAF",Country.1))
finals <- finals %>% mutate(Country.1 = ifelse(Country.1 == "SUI","CHE",Country.1))

finals <- finals %>% left_join(flags %>% select(Alpha.3.code,URL), by = c("Country" = "Alpha.3.code"))
finals <- finals %>% left_join(flags %>% select(Alpha.3.code,URL), by = c("Country.1" = "Alpha.3.code"))
finals

sub <- finals %>% filter(Year >= 2000)
sub$size1 <- sub$size2 <- 0.05
sub$size1[sub$Country == "CHE"] <- 0.03
sub$size2[sub$Country.1 == "CHE"] <- 0.03

sub <- sub %>% mutate(`US finalist` = ifelse(Year == 2024 | Year <= 2006,"Yes","No"))

png("/Users/gregorymatthews/test.png",res = 300, h = 10, w = 3, units = "in")
ggplot(sub) + geom_image(aes(x = Year, y = 1,image=URL.x), size=sub$size1) +
  geom_image(aes(x = Year, y = 1.1,image=URL.y), size=sub$size2) +
  coord_flip() +
  theme(aspect.ratio=4) +
  expand_limits(y = c(.9,1.2)) +
  theme(axis.title.x=element_blank(),
        axis.text.x=element_blank(),
        axis.ticks.x=element_blank()) + ggtitle("US Open Tennis Finalists") +
  scale_x_continuous(breaks = seq(2000,2025, by = 1),
                     minor_breaks = NULL) +
  scale_y_continuous(breaks = c(-100,100)) +
  annotate("rect", ymin = .9, ymax = 1.2, xmin = 2006.5, xmax = 2023.5, alpha=0.2, fill="red") +
  annotate("rect", ymin = .9, ymax = 1.2, xmin = 1999.5, xmax = 2006.5, alpha=0.2, fill="green") +
  annotate("rect", ymin = .9, ymax = 1.2, xmin = 2023.5, xmax = 2024.5, alpha=0.2, fill="green")

dev.off()
Posted on September 4, 2024, in Uncategorized. Bookmark the permalink. Leave a comment.

Leave a comment
Comments 0