Blog Archives
My completely uninformed guide to March Madness and some thoughts on my kaggle entry
I submitted my March Madness Machine Learning Mania today. My two entries consist of picks made using the actual spread for first round games and then a simple Bradley-Terry model for the games past that. In my second bracket, which I called the “aggressive” one, I picks UConn in the men’s bracket and South Carolina in the women’s bracket to win each round (and thus the tournament) with probability 1. So is UConn and South Carolina win, maybe I have a shot at winning. I also manually adjusted two teams on the women’s side (South Carolina and USC). The problem with South Carolina is that they haven’t lost any games and Bradley-Terry basically can’t handle that. I adjusted their regression coefficients to match the market price that they win the tournament. I also adjusted USC on the women’s side because they were way off their market price too. I didn’t make any adjustments to the men’s side because the futures prices were generally in the ball park with what I was estimating (i.e. there are three truly top teams in the men’s bracket (Purdue, UConn, Houston), then a sizable gap down to the next team (which I think is Iowa State. North Carolina got a gift of a 1 seed.)
I’m really excited about the new scoring system for Kaggle this year. And I think they got the scoring system right. A few weeks ago I believe I read that the scoring system was going to be average bracket score with traditional bracket scoring (1-2-4-8-16-32). My first thought when I saw this was that the best strategy is to just enter one bracket and hope. I think other people figured this out and they change it to a Brier score metric. But what they really got right this year is that that don’t take the average over all the GAMES, they take the average over the 6 ROUNDS. This weights the game in the finals much more heavily than a game in the first round, much closer to traditional bracket games.
Anyway, here are some probabilities below are based on my 10000 brackets that I submitted:
To win the championship:
UConn – 29.3%
Houston – 20.9%
Purdue – 19.4%
Iowa St – 5.19%
North Carolina – 4.96%
Tennessee – 3.39%
Marquette – 2.49%
Auburn – 1.94%
Illinois – 1.51%
Baylor – 1.43%
Everyone else < 1%
To make the finals:
UConn – 45.5%
Houston – 34.8%
Purdue – 32.4%
North Carolina – 12.6%
Iowa St – 11.4%
Tennessee – 7..92%
Marquette – 6.51%
Auburn – 5.8%
Illinois – 4.54%
Baylor – 4.34%
Arizona – 3.16%
Alabama – 2.68%
South Carolina – 2.46%
Kansas – 2.31%
Kentucky – 2.13%
Creighton 2.03%
Everyone else < 2%
And finally, here are my pre-tournament rankings 1 through UMass:
| Rank | TeamName |
| 1 | Connecticut |
| 2 | Houston |
| 3 | Purdue |
| 4 | Iowa St |
| 5 | North Carolina |
| 6 | Tennessee |
| 7 | Auburn |
| 8 | Marquette |
| 9 | Illinois |
| 10 | South Carolina |
| 11 | Baylor |
| 12 | Kansas |
| 13 | Utah St |
| 14 | Creighton |
| 15 | Arizona |
| 16 | Duke |
| 17 | Nevada |
| 18 | Kentucky |
| 19 | Alabama |
| 20 | San Diego St |
| 21 | BYU |
| 22 | Florida |
| 23 | Texas Tech |
| 24 | New Mexico |
| 25 | Wisconsin |
| 26 | Gonzaga |
| 27 | Nebraska |
| 28 | Colorado St |
| 29 | Dayton |
| 30 | Clemson |
| 31 | Virginia |
| 32 | Mississippi St |
| 33 | Boise St |
| 34 | Texas |
| 35 | St Mary’s CA |
| 36 | TCU |
| 37 | Drake |
| 38 | Oklahoma |
| 39 | Grand Canyon |
| 40 | Northwestern |
| 41 | Colorado |
| 42 | Texas A&M |
| 43 | Washington St |
| 44 | Indiana St |
| 45 | Pittsburgh |
| 46 | NC State |
| 47 | FL Atlantic |
| 48 | Syracuse |
| 49 | Providence |
| 50 | Michigan St |
| 51 | Oregon |
| 52 | St John’s |
| 53 | James Madison |
| 54 | Seton Hall |
| 55 | Mississippi |
| 56 | Kansas St |
| 57 | Ohio St |
| 58 | Indiana |
| 59 | Princeton |
| 60 | Wake Forest |
| 61 | Cincinnati |
| 62 | Iowa |
| 63 | Butler |
| 64 | Virginia Tech |
| 65 | Villanova |
| 66 | Samford |
| 67 | Richmond |
| 68 | Duquesne |
| 69 | McNeese St |
| 70 | Utah |
| 71 | Memphis |
| 72 | Loyola-Chicago |
| 73 | South Florida |
| 74 | UNLV |
| 75 | Florida St |
| 76 | Boston College |
| 77 | Xavier |
| 78 | UCF |
| 79 | LSU |
| 80 | Georgia |
| 81 | VCU |
| 82 | Minnesota |
| 83 | UAB |
| 84 | Washington |
| 85 | Bradley |
| 86 | San Francisco |
| 87 | Appalachian St |
| 88 | Arkansas |
| 89 | Rutgers |
| 90 | Cornell |
| 91 | Vermont |
| 92 | Miami FL |
| 93 | Col Charleston |
| 94 | Maryland |
| 95 | Penn St |
| 96 | Georgia Tech |
| 97 | St Joseph’s PA |
| 98 | Yale |
| 99 | USC |
| 100 | UC Irvine |
| 101 | St Bonaventure |
| 102 | Santa Clara |
| 103 | George Mason |
| 104 | Massachusetts |
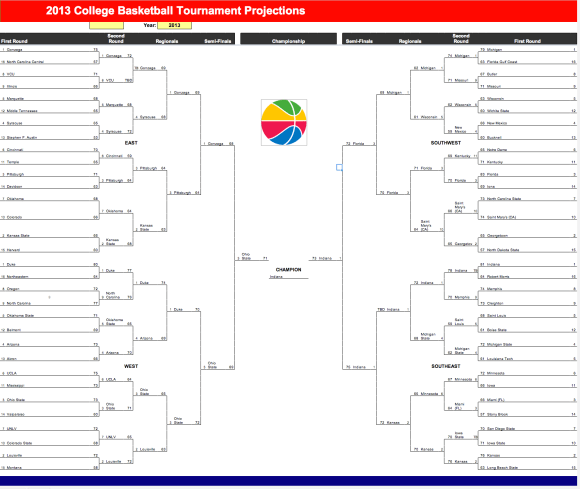
March Madness Projections Updated – March 5, 2013
Number 1 Seeds: Gonzaga, Indiana, Michigan, Duke
Last 4 in: Boise State, Wichita State, Virginia, Stanford
Last 4 out: California, La Salle, Arizona State, Baylor
 Cheers.
NCAA Football Rankings – 11/4/2012
|
BCS: Why bother with the computers?
The BCS is either unbelievably brilliant or completely idiotic. They use computer rankings to legitimize themselves, while at the same time, completely ignoring the computer rankings.
Louisiana Tech is a perfect example of this. Currently, Louisiana Tech is 25th in the BCS standings in spite of the fact that exactly ZERO computer polls have them in the top 25. They crack the BCS standings by coming in at 23 and 24 in the USA Today and Harris polls, respectively. The polls outweigh the computers in such a way that they practically don’t matter.
Another good example of this is Florida State who currently sits at 9 in the BCS rankings. Five of the six rankings have the Seminoles in the top 25 with ranks of 12, 18, 21, 22, and 25, while Sagarin leaves them out entirely. Their average computer rank is 21. In both polls, however, they are currently ranked 7th. And thanks to the way the BCS performs the weighting the average of 7, 7, and 21 is 9. That’s BCS math for you.
The weighting for the BCS is one-third each for the two polls and one-third for the computer rankings. However, if you look at the top 13 in both BCS polls, they are exactly the same. This has the effect of essentially using only one poll but giving it two-thirds weight and giving the computers only one-third. Voters can simply get together and vote in such a way that renders the computers meaningless. Only one of the six computer rankings, Richard Billingsley, has Alabama ranked number 1, and yet they are nearly a unanimous number one in the voting. Some more solid BCS math for you.
Whoever set up the BCS either had no idea what they were doing, tried to set-up a fair, rational system of ranking incorporating human voters and computers, and failed spectacularly, or knew exactly what they were doing, incorporated computers to make themselves look legitimate, and was wildly successful in maintaining the status quo. Sometimes it’s hard to tell the difference between genius and insanity.
Cheers.
NCAA Football Rankings – 10/28/2012
|
Full Rankings
NCAA Football Rankings – 10/21/2012
|
NCAAB Rankings – 1/2/2012
Rankings as of 2:31pm on 1/2/2012. Sagarin ratings as of 1/1/2012. AP rankings as of 1/2/2012.
Previous rankings are here.
Pittsburgh, Oklahoma, and Miss St. fall out of the top 25 and New Mexico, North Carolina, and Purdue are in the top 25 this week. The Mountain West conference has 3 teams in my top 25. That is the same number as the ACC, Pac-12 and SEC COMBINED. I’ve even given the MWC there own color (purple). I considered giving them red since the Pac-12 wasn’t using it at all, but I think purple is a more fitting color for the MWC (think purple mountains majesty).
Breakdown by conference: 2, 6, 9, 4, 0, 1, 3
ACC Big East Big Ten Big 12 Pac 12 SEC MWC Other
| Team | Rank | Change | Record | AP | Sagarin |
| Syracuse | 1 | ↑1 | 15-0 | 1 | 1 |
| Baylor | 2 | ↑2 | 13-0 | 4 | 6 |
| Indiana | 3 | ↓2 | 13-1 | 12 | 4 |
| Michigan St. | 4 | ↑5 | 13-2 | 10 | 8 |
| Duke | 5 | ↑7 | 12-1 | 5 | 5 |
| Ohio St. | 6 | ↓3 | 13-2 | 6 | 3 |
| UConn | 7 | ↑10 | 12-1 | 8 | 26 |
| Michigan | 8 | ↑8 | 12-2 | 16 | 41 |
| Missouri | 9 | ↑4 | 13-0 | 7 | 11 |
| Illinois | 10 | ↓3 | 12-3 | 11 | 47 |
| Northwestern | 11 | ↓3 | 11-3 | – | 51 |
| Marquette | 12 | ↓1 | 12-2 | 20 | 19 |
| Wisconsin | 13 | ↓3 | 12-3 | 18 | 15 |
| Georgetown | 14 | ↑11 | 12-1 | 9 | 10 |
| Seton Hall | 15 | ↓1 | 12-2 | 38 | 28 |
| UNLV | 16 | ↑3 | 15-2 | 17 | 12 |
| Kansas State | 17 | ↓2 | 11-1 | 23 | 18 |
| Purdue | 18 | NR | 12-3 | 33 | 27 |
| Kentucky | 19 | ↑4 | 13-1 | 2 | 2 |
| North Carolina | 20 | NR | 13-2 | 3 | 7 |
| Minnesota | 21 | ↓16 | 12-3 | – | 50 |
| Louisville | 22 | ↓16 | 12-2 | 11 | 13 |
| San Diego St. | 23 | ↓5 | 12-2 | 24 | 38 |
| Kansas | 24 | – | 10-3 | 14 | 9 |
| New Mexico | 25 | NR | 12-2 | 34 | 31 |
BCS: My offer still stands…….if you want to contact me you can send me a tweet @StatsInTheWild.
Cheers.
NFL Rankings Christmas Edition – 12/22/2011
Rankings updated as of 12/22/2011; Records updated as of 6:22pm 12/24/2011
AFC NFC
Clinched Playoff Berth
Divison Leader Division Champ
Eliminated from Playoffs
| Team | Rank | Change | Record | CHFF Rank |
| New England | 1 | ↑ | 12-3 | 3 |
| Green Bay | 2 | ↓ | 13-1 | 1 |
| Pittsburgh | 3 | – | 11-4 | 7 |
| Baltimore | 4 | – | 11-4 | 6 |
| Atlanta | 5 | – | 9-5 | 8 |
| New Orleans | 6 | ↑ | 11-3 | 2 |
| NY Jets | 7 | ↓ | 8-7 | 11 |
| Chicago | 8 | – | 7-7 | 23 |
| San Francisco | 9 | ↑↑ | 11-3 | 4 |
| NY Giants | 10 | ↓↓ | 8-7 | 14 |
| Detroit | 11 | ↓ | 9-5 | 9 |
| 12 | – | 6-8 | 17 | |
| San Diego | 13 | ↑↑ | 7-7 | 13 |
| 14 | ↓ | 4-11 | 29 | |
| 15 | ↑↑ | 6-9 | 25 | |
| Houston | 16 | ↓↓ | 10-5 | 5 |
| Oakland | 17 | ↓ | 8-7 | 16 |
| Seattle | 18 | ↑↑↑ | 7-7 | 18 |
| 19 | ↓ | 5-10 | 20 | |
| Dallas | 20 | ↑↑ | 8-6 | 10 |
| Cincinnati | 21 | ↓ | 9-6 | 12 |
| Tennessee | 22 | ↓↓↓ | 8-7 | 22 |
| Denver | 23 | – | 8-6 | 15 |
| 24 | – | 6-9 | 26 | |
| 25 | ↑↑↑↑ | 7-8 | 19 | |
| 26 | ↓ | 4-11 | 27 | |
| 27 | ↓ | 4-11 | 28 | |
| 28 | – | 2-13 | 32 | |
| 29 | ↑ | 5-10 | 24 | |
| 30 | ↓↓↓ | 3-12 | 30 | |
| 31 | – | 2-13 | 31 | |
| 32 | – | 6-9 | 21 |
BCS: My offer still stands…….if you want to contact me you can send me a tweet @StatsInTheWild.
Cheers.
An arbitrary ranking of NCAA college basketball teams – 12/11/2011
Rankings as of noon on 12/11/2011 .
| Team | Rank | Change | Record | AP (12/12/11) |
| Indiana | 1 | 0 | 9-0 | 18 |
| Illinois | 2 | 0 | 10-0 | 19 |
| Syracuse | 3 | 0 | 10-0 | 1 |
| Minnesota | 4 | 0 | 10-1 | |
| Marquette | 5 | 0 | 9-0 | 11 |
| Northwestern | 6 | 0 | 7-1 | 40 |
| Ohio State | 7 | 0 | 8-1 | 2 |
| Missouri | 8 | 0 | 9-0 | 10 |
| Duke | 9 | 0 | 9-1 | 7 |
| Louisville | 10 | 0 | 9-0 | 4 |
| Baylor | 11 | 0 | 7-0 | 6 |
| Northern Iowa | 12 | 0 | 9-1 | 35 |
| Purdue | 13 | 0 | 9-2 | |
| Michigan State | 14 | 0 | 8-2 | 21 |
| Wisconsin | 15 | 0 | 8-2 | 14 |
| Pittsburgh | 16 | 0 | 9-1 | 15 |
| Seton Hall | 17 | 0 | 8-1 | |
| Kansas | 18 | 0 | 7-2 | 12 |
| Xavier | 19 | 0 | 8-0 | 8 |
| San Diego State | 20 | 0 | 9-2 | 28 |
| Connecticut | 21 | 0 | 8-1 | 9 |
| Oklahoma | 22 | 0 | 7-1 | |
| Ole Miss | 23 | 0 | 8-1 | |
| Michigan | 24 | 0 | 7-2 | 20 |
| Saint Louis | 25 | 0 | 9-1 | 32 |
BCS: My offer still stands…….if you want to contact me you can send me a tweet @StatsInTheWild.
Cheers.
One More Arbitrary NCAA Football Ranking Scheme for the BCS – 12/4/2011
Rankings as of 12/04/2011. Previous weeks rankings here.
The BCS explained: It used to be that a national champion in college football was determined solely by human polls. However, human polls are suspect because you are asking each voter to process the results of hundreds of college football games from teams all across the country and form a well thought out, reasoned ranking of the top 25 teams, which is clearly impossible; It’s too much data for a human to handle. That’s why the BCS introduced the computer rankings which could, without personal bias, crunch the numbers and produce a ranking taking all games into account equally. The computer rankings, on the average, do a very reasonable job of ranking the teams. Ultimately, however, the non-human polls, a computational exercise in futility, are simply ignored, as they are overwhelmed by the human polls, and the BCS gets what it wants while it hides behind the computer polls to offer a whiff of legitimacy to the absolute garbage it spews out.
BCS Bowl Team
ACC Big East Big Ten Big 12 Pac 12 SEC Other
| Team | Rank | Change | Record | BCS Rank |
| LSU | 1 | – | 13-0 | 1 |
| Oklahoma State | 2 | – | 11-1 | 3 |
| Kansas State | 3 | ↑↑ | 10-2 | 8 |
| Alabama | 4 | ↑ | 11-1 | 2 |
| Oklahoma | 5 | ↓↓ | 9-3 | 14 |
| Baylor | 6 | ↑ | 9-3 | 12 |
| Stanford | 7 | ↓ | 11-1 | 4 |
| Oregon | 8 | ↑↑↑ | 11-2 | 5 |
| Arkansas | 9 | ↓ | 10-2 | 6 |
| South Carolina | 10 | ↓ | 10-2 | 9 |
| USC | 11 | ↓ | 10-2 | |
| Georgia | 12 | – | 10-3 | 16 |
| Virginia Tech | 13 | – | 11-2 | 11 |
| Boise State | 14 | ↑↑↑ | 11-1 | 7 |
| Michigan | 15 | ↑ | 10-2 | 13 |
| Wisconsin | 16 | ↑↑ | 11-2 | 10 |
| Texas | 17 | ↓↓↓ | 7-5 | 24 |
| Clemson | 18 | ↑↑↑↑ | 10-3 | 15 |
| Nebraska | 19 | ↓ | 9-3 | 20 |
| Houston | 20 | ↓↓↓↓↓ | 12-1 | 19 |
| Missouri | 21 | – | 7-5 | |
| TCU | 22 | ↑↑↑↑↑ | 10-2 | 18 |
| Michigan State | 23 | ↓↓↓ | 10-3 | 17 |
| Penn State | 24 | ↑ | 9-3 | 22 |
| Texas A&M | 25 | ↓ | 6-6 |
And finally, representing the Big East/Big Least: West Virginia
BCS: My offer still stands…….if you want to contact me you can send me a tweet @StatsInTheWild.
Cheers.
