Blog Archives
How bad can you be and advance in the World Cup?
I was at a bar once and the question of “What’s the worst NFL record you can have and still make the playoffs?” came up. We figured out pretty quickly, you can theoretically win your division (and host a home game!) without ever winning a game. If you lose all non-division games and tie all your division games you would go 0-11-6 and host like an 11 win team on wild card weekend. I pray in vain for this every year.
What’s the World Cup version of this? With the expanded version of the World Cup that now features some third place group stage finishers advancing, naturally the question is “How bad can you be an still advance?”
So, first thing’s first. How many unique final standings are there for a group? There are 6 games and each game has 3 possible outcomes. So 3^6 = 729 possible final tables, but for this question I only care about unique sets of points. That is if teams A, B, C, and D finish with 9,6,3,0 or teams D, C,B, and A finish with 9,6,3,0 those are the same for my purposes.
So how many unique point totals are there? I found 40. (I wrote code to do this. Anyone know how to do the math to solve this?)
Seven different tables when one team wins all their games:
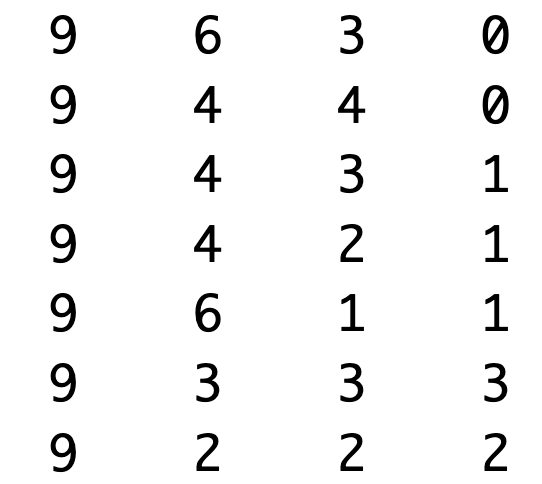
Next there are 14 tables possible with the top team getting 2 wins and a tie:
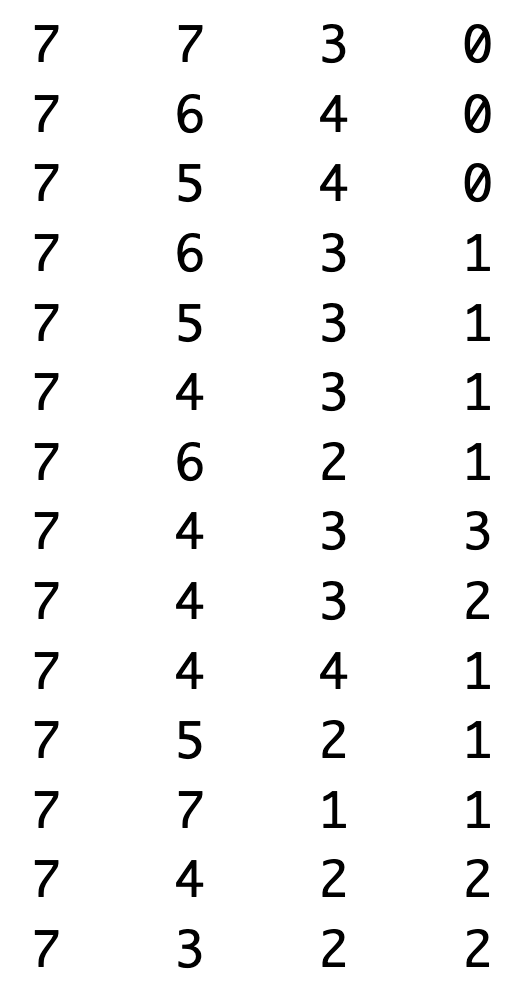
Seven different tables where the top teams gets two wins and a loss.
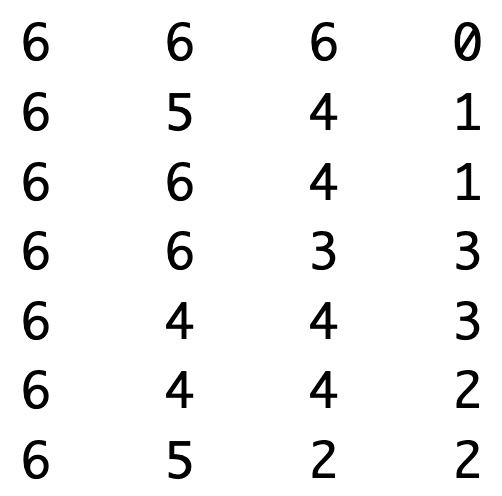
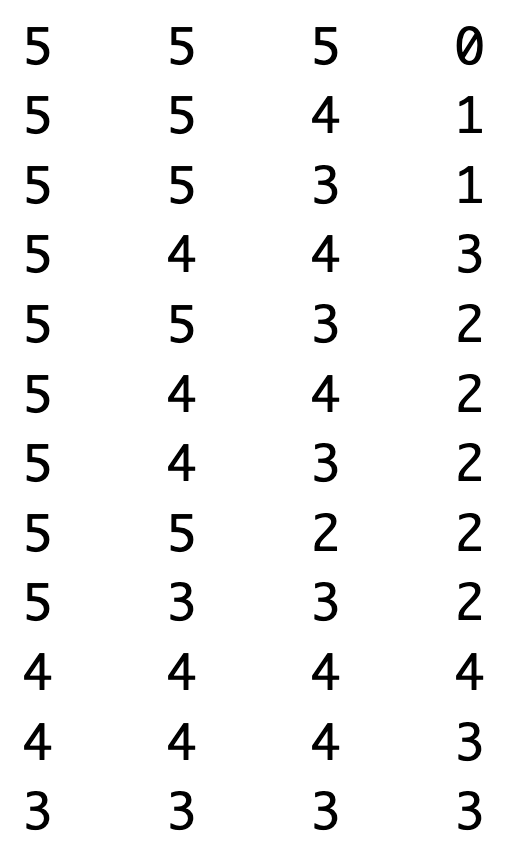
9 different tables are possible where the winner get’s a single win and two ties. Finally there are two tables possible where the top team gets one win and a tie and exactly one possible table where the group winner has 1 win and 2 losses (all teams win exactly one game, my personal favorite).
But we don’t care about that for the purposes of this question. We care about what’s the worst that you can do and still finish 3rd? So let’s look at the distribution of points for the third place team:
In the forty unique tables the third place team finished with 5 or 6 points exactly once each. There are 13 ways to get to 4 points and 15 ways to get to 3 points and eight ways to get to 2 points. This leaves exactly two tables with the third place team on 1 point: 7,7,1,1 and 9,6,1,1. In both these cases the bottom two teams both lose all their games against the top 2 teams in the groups and then they tie each other. Ultimately what this means is that you can theoretically show up to the world cup and if every single group finishes with 7, 7, 1, 1, or 9, 6, 1, 1, multiple teams that went 0-2-1 in the group stage will advance! I love it so much.
The other natural question is “What’s the most points you can score and not advance?” The most points you can score and finish fourth is 4 points (everyone goes 1-1-1 in the group). So you could score 4 points and not even have a chance to advance by finishing 4th. But there is one even worse. There is a scenario where you finish 3rd with 6 full points (the bottom team loses all three games and the top three all split with each other). If this happened in every group multiple teams with TWO WINS wouldn’t advance.
In summary, the theoretically most points you can score and not advance is 6 and the fewest points you can score and theoretically advance is 1. My absolute favorite thing in sports to root for now is absurd outcomes like this. Both of these extremes are fairly unlikely in reality, but a boy can dream, can’t he?
Cheers.
However bad you think the Rockies are, they are worse. Even worse than the White Sox last year (so far).
Update: They swept the Marlins and are now on a 3 game winning streak and sit at 12-50. They are 25 games out of first place with 100 games to play.
Update: They won last night and are now 10-50 as of noon on June 3.
The Rockies are 9-50. That’s 50 losses in 59 games. A winning percentage of .153. That’s the fastest any team has gotten to 50 losses since 1901. But didn’t we just get a new worst ever team last year in the Chicago White Sox? Yup! The Chicago White Sox lost 121 games last year, the most ever. And the Rockies are currently on pace to shat. ter. the White Sox loss record from last year. They are currently on pace to go 25-137. How bad is this? At this point in the season, the White sox were 15-44. SIX games ahead of where the Rockies are right now. To see this, let’s look at some data viz that I made.
Below is a plot of game number versus cumulative wins. Up until about game 30 the Rockies were merely just as bad as the White Sox. Since then they have really stepped down their game thanks to multiple 8 game losing streaks. Speaking of streaks, let’s take a look at that.

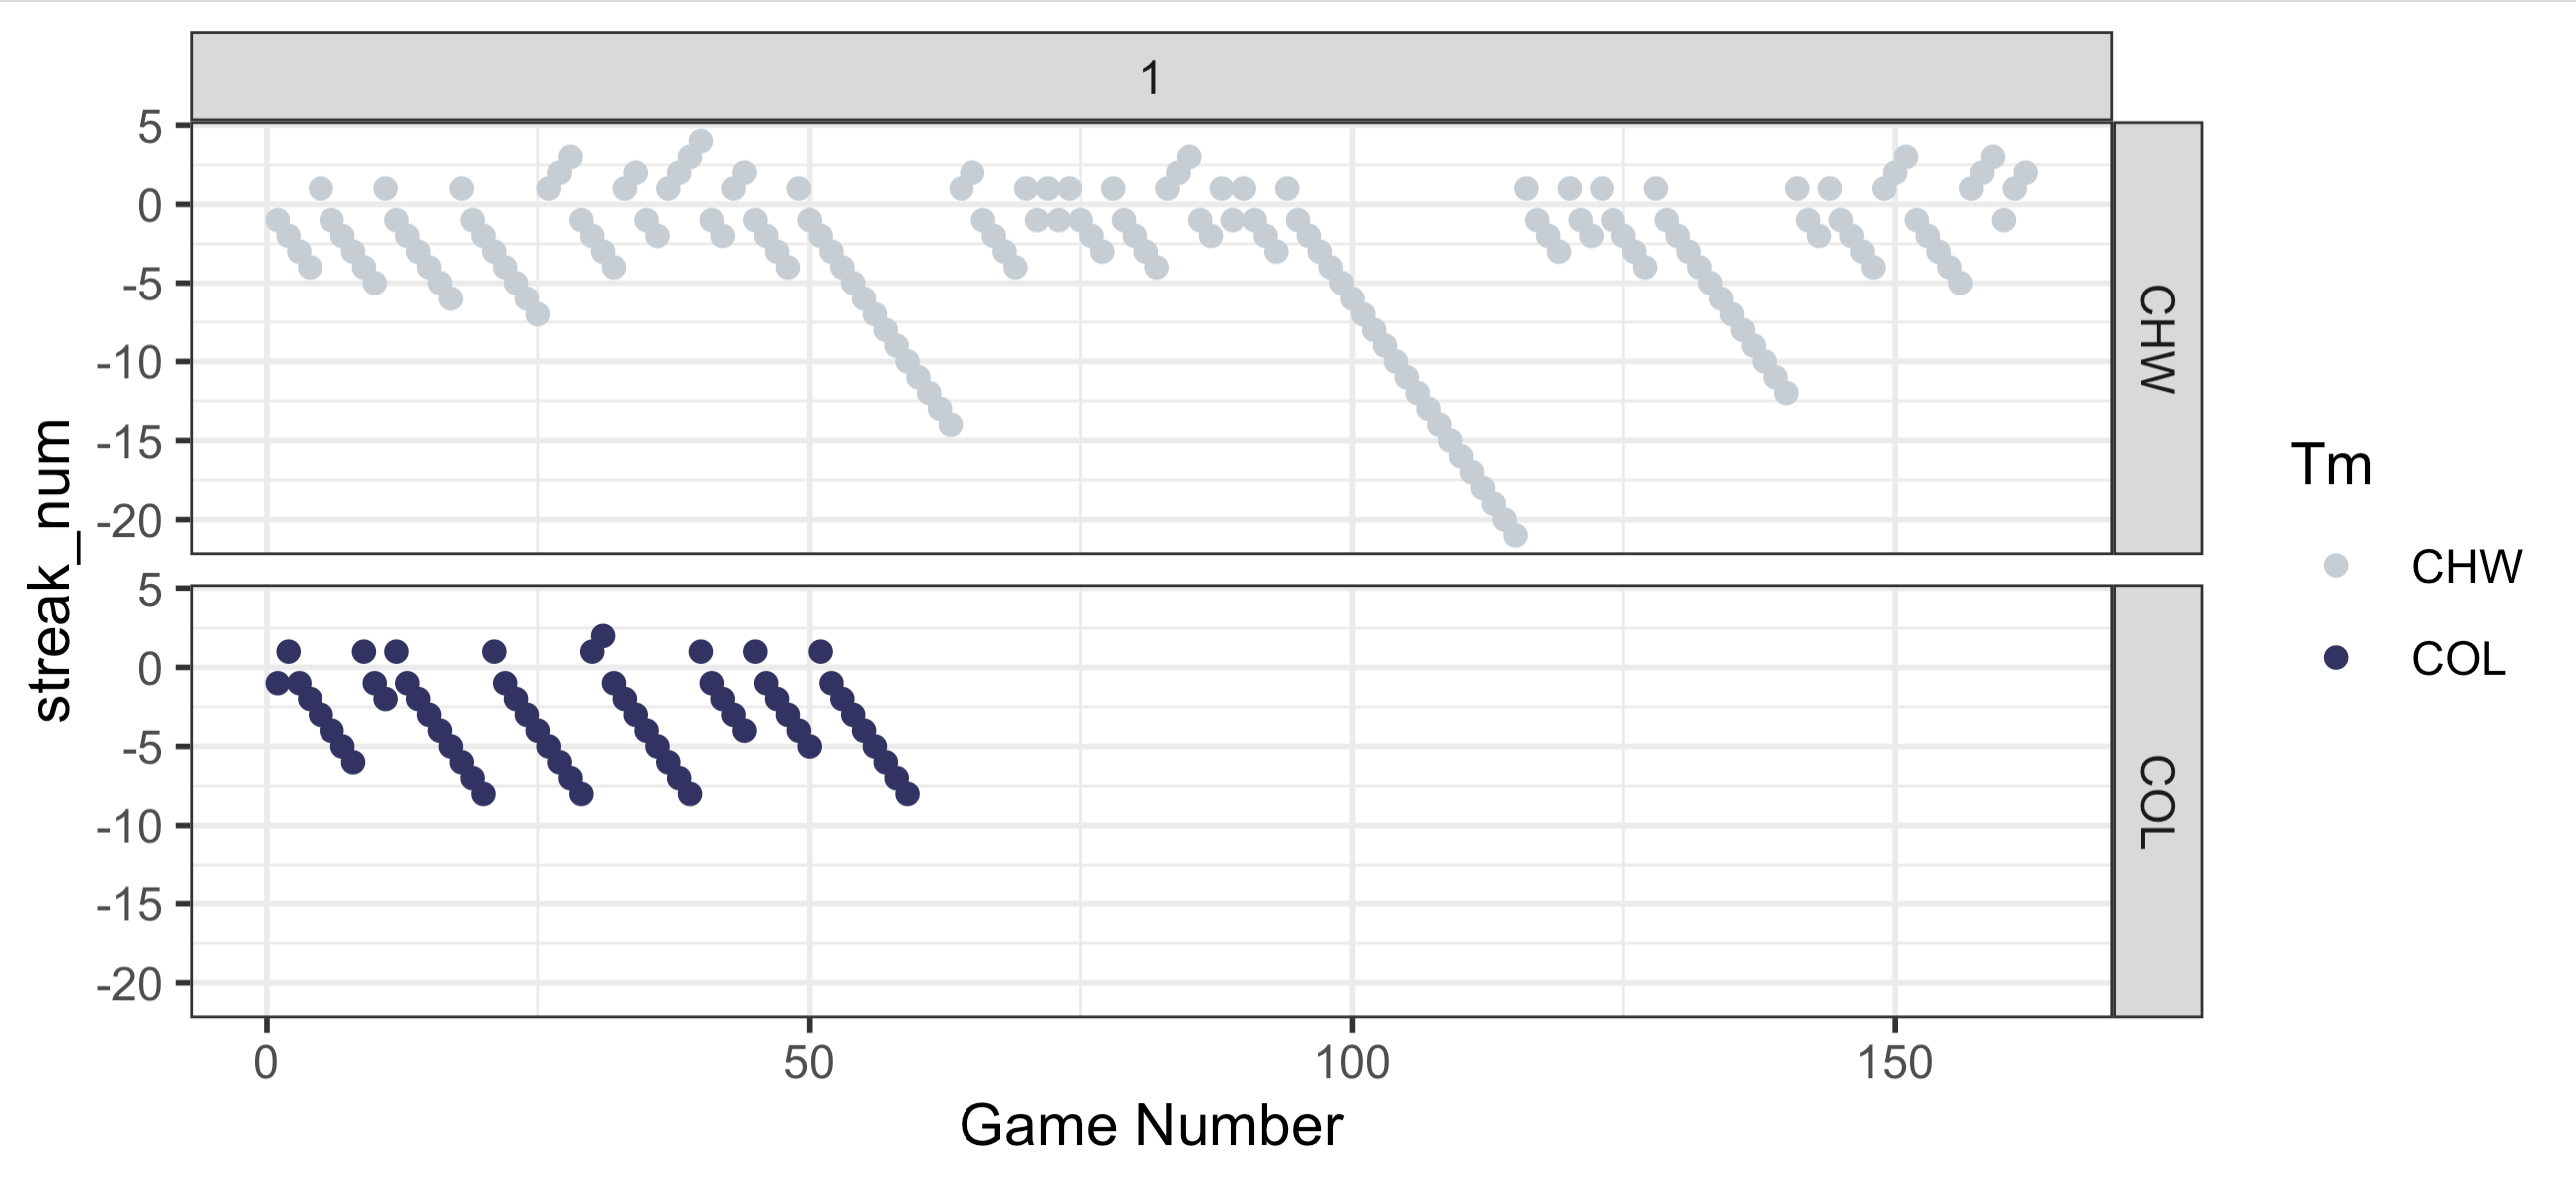
Below, you’ll find a plot of game number on the x axis and the win/loss streak on the y-axis. Positive numbers are winning streaks and negative numbers are losing streaks. You can see that the Rockies have already had FOUR 8 game losing streaks. But even more impressive than that is that they’ve only won back to back games a single time this season. Let me repeat this: Their largest win streak of the season is 2 games and it’s happened exactly once. The White Sox last year has winning streak of 2 or more 9 times total and 4 up to this point in the season,. They even had a nifty little 4 game winning streak (They also had losing streaks of 12, 14, and 21(!!!) games).
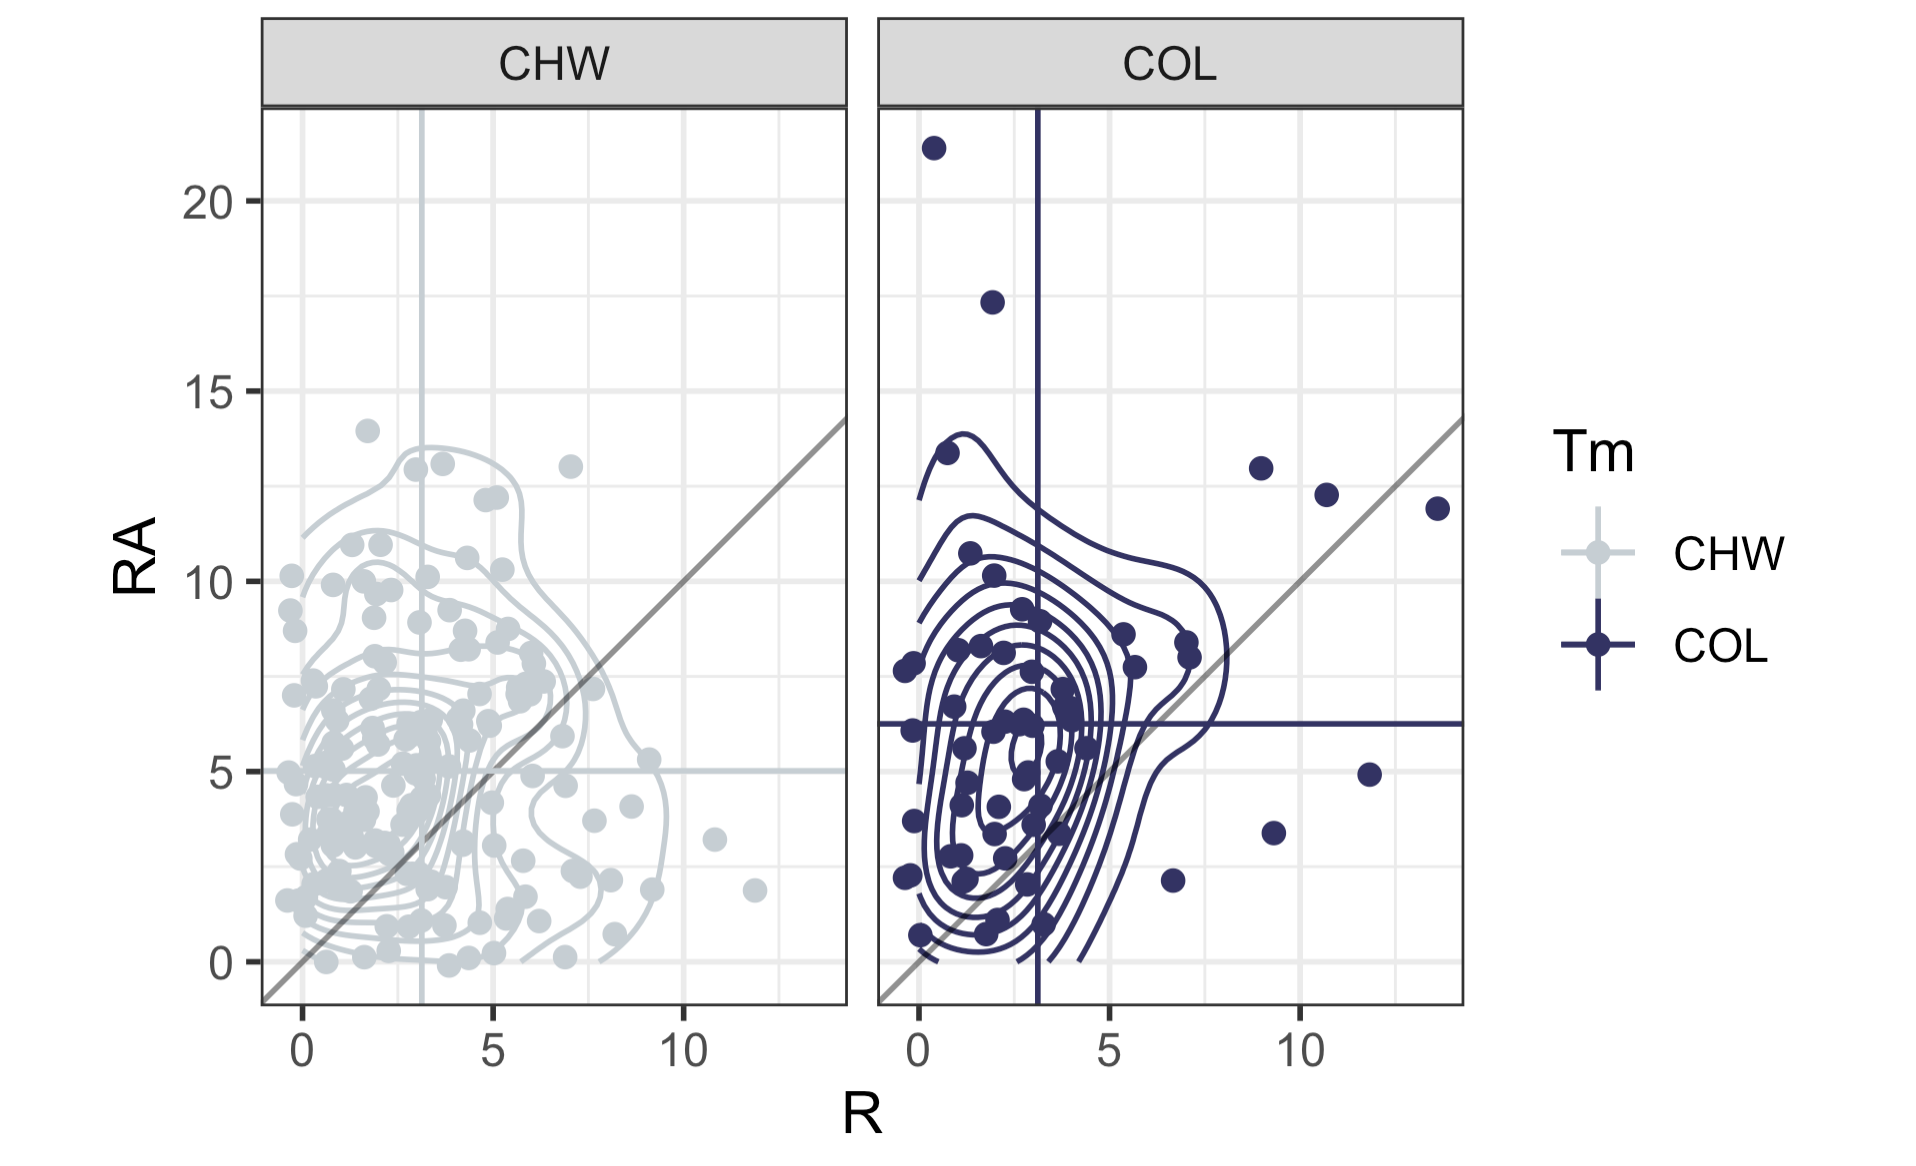
Now let’s take a look at scoring for the Rockies. Below is a 2d contour plot of for the runs for and runs against for every game from the White Sox 2024 season in the left panel and every game of the current Rockies season. The horizontal and vertical lines are the mean number of runs for and against and the diagonal lines shows whether the game was won or lost by the respective team (above the line is a loss, below the line if a win). What’s really interesting about this is that in the entire season last year, the White Sox only score 10 or more runs TWICE. The Rockies have already done this 3 times. Also, the most runs that the White Sox gave up all season was 14 runes. The Rockies have given up more than 14 runs twice already. (a 17-2 loss to the Brewers and a 21-0 loss to the Padres).
Here is what these plots look like on top of one another. What you’ll notice is that it’s hard to see the vertical line for the White Sox (i.e. their mean number of runs) because it’s nearly identical to the Rockies. The White Sox average 3.13 runs per game last year and the Rockies are just slightly below that at 3.12 runs per game. But where Colorado really “shines” is their defense. While the White Sox gave up an average of just over 5 runs per game (5.02, to be exact), the Rockies are currently allowing, and I can’t believe this is true, 6.25 runs per game. That 1.23 more runs per game on average than the worst team in the modern history of baseball. Incredible work.
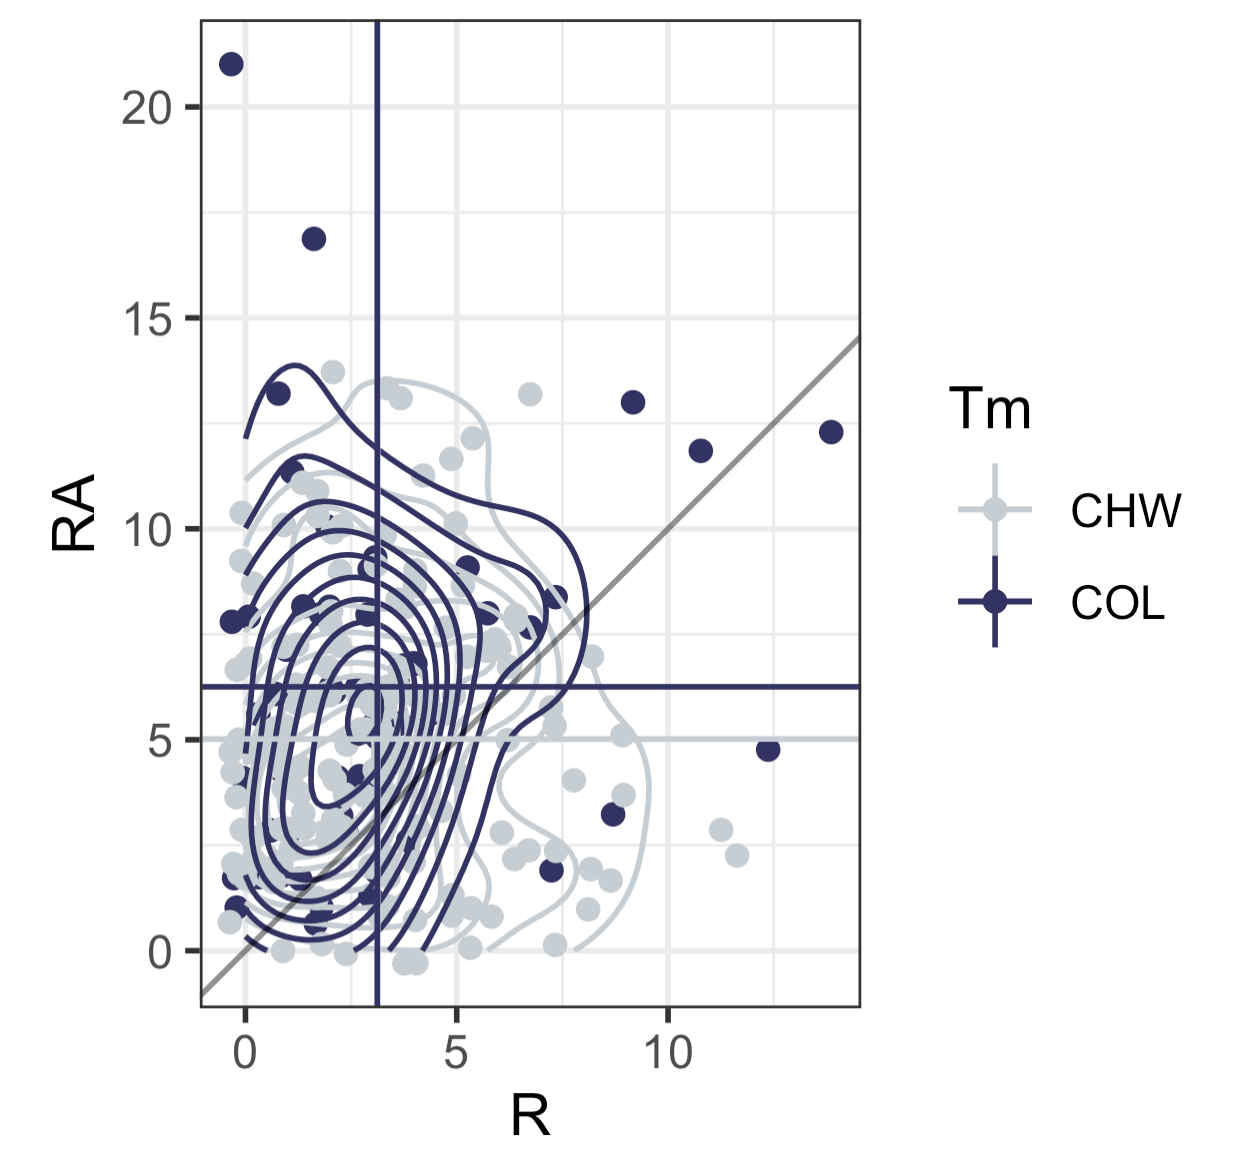
If you’re a median type of person, I computed those two. The White Sox last year scored a median of 3 runs and allowed a median of 5 runs. For the Rockies this year, they are scoring a median of 2 runs and allowing a median of 6 runs.
Anyway, the point is that the Rockies are [really]+ bad.
My code is below.
Cheers.
rock <- read.csv("/Users/gregorymatthews/Dropbox/statsinthewild/rockies2025_20250602.csv")
ws <- read.csv("/Users/gregorymatthews/Dropbox/statsinthewild/whitesox2024.csv")

names(rock)[1] <- names(ws)[1] <- "gameno"
rock$streak_num <- as.numeric(paste0(substring(rock$Streak,1,1),nchar(rock$Streak)))
rock$W <- as.numeric(unlist(lapply(strsplit(rock$W.L.1,"-"),function(x){x[1]})))
rock$L <- as.numeric(unlist(lapply(strsplit(rock$W.L.1,"-"),function(x){x[2]})))

ws$streak_num <- as.numeric(paste0(substring(ws$Streak,1,1),nchar(ws$Streak)))
ws$W <- as.numeric(unlist(lapply(strsplit(ws$W.L.1,"-"),function(x){x[1]})))
ws$L <- as.numeric(unlist(lapply(strsplit(ws$W.L.1,"-"),function(x){x[2]})))
both <- rbind(rock,ws)

library(tidyverse)
library(teamcolors)
small <- teamcolors %>% filter(name %in% c("Chicago White Sox","Colorado Rockies"))
ggplot(aes(x = gameno, y = W,color = Tm), data =both) +
  geom_path() +
  theme_bw() +
  scale_color_manual(values = c(small$secondary[1],small$primary[2])) +
  xlab("Game Number")

ggplot(aes(x = gameno, y = streak_num, col = Tm), data = both) + geom_point() + theme_bw() + facet_grid(Tm~1) + scale_color_manual(values = c(small$secondary[1],small$primary[2])) + xlab("Game Number")

ggplot(aes(x = R, y = RA, color = Tm), data = both) +
  geom_jitter() +
  geom_density2d() +
  scale_color_manual(values = c(small$secondary[1],small$primary[2])) +
  theme_bw() + geom_abline(slope = 1, color = rgb(0,0,0,.5)) +
  geom_vline(aes(xintercept = R, color = Tm), data = both %>% group_by(Tm) %>% summarise(R = mean(R),RA = mean(RA))) +
  geom_hline(aes(yintercept = RA, color = Tm), data = both %>% group_by(Tm) %>% summarise(R = mean(R),RA = mean(RA))) + coord_fixed() +

both %>% group_by(Tm) %>% summarise(median(R),median(RA))
both %>% group_by(Tm) %>% summarise(mean(R),mean(RA))

both %>% filter(Tm == "COL") %>% pull(R) %>% table()
both %>% filter(Tm == "CHW") %>% pull(R) %>% table()
My completely uninformed guide to March Madness and some thoughts on my kaggle entry
I submitted my March Madness Machine Learning Mania today. My two entries consist of picks made using the actual spread for first round games and then a simple Bradley-Terry model for the games past that. In my second bracket, which I called the “aggressive” one, I picks UConn in the men’s bracket and South Carolina in the women’s bracket to win each round (and thus the tournament) with probability 1. So is UConn and South Carolina win, maybe I have a shot at winning. I also manually adjusted two teams on the women’s side (South Carolina and USC). The problem with South Carolina is that they haven’t lost any games and Bradley-Terry basically can’t handle that. I adjusted their regression coefficients to match the market price that they win the tournament. I also adjusted USC on the women’s side because they were way off their market price too. I didn’t make any adjustments to the men’s side because the futures prices were generally in the ball park with what I was estimating (i.e. there are three truly top teams in the men’s bracket (Purdue, UConn, Houston), then a sizable gap down to the next team (which I think is Iowa State. North Carolina got a gift of a 1 seed.)
I’m really excited about the new scoring system for Kaggle this year. And I think they got the scoring system right. A few weeks ago I believe I read that the scoring system was going to be average bracket score with traditional bracket scoring (1-2-4-8-16-32). My first thought when I saw this was that the best strategy is to just enter one bracket and hope. I think other people figured this out and they change it to a Brier score metric. But what they really got right this year is that that don’t take the average over all the GAMES, they take the average over the 6 ROUNDS. This weights the game in the finals much more heavily than a game in the first round, much closer to traditional bracket games.
Anyway, here are some probabilities below are based on my 10000 brackets that I submitted:
To win the championship:
UConn – 29.3%
Houston – 20.9%
Purdue – 19.4%
Iowa St – 5.19%
North Carolina – 4.96%
Tennessee – 3.39%
Marquette – 2.49%
Auburn – 1.94%
Illinois – 1.51%
Baylor – 1.43%
Everyone else < 1%
To make the finals:
UConn – 45.5%
Houston – 34.8%
Purdue – 32.4%
North Carolina – 12.6%
Iowa St – 11.4%
Tennessee – 7..92%
Marquette – 6.51%
Auburn – 5.8%
Illinois – 4.54%
Baylor – 4.34%
Arizona – 3.16%
Alabama – 2.68%
South Carolina – 2.46%
Kansas – 2.31%
Kentucky – 2.13%
Creighton 2.03%
Everyone else < 2%
And finally, here are my pre-tournament rankings 1 through UMass:
| Rank | TeamName |
| 1 | Connecticut |
| 2 | Houston |
| 3 | Purdue |
| 4 | Iowa St |
| 5 | North Carolina |
| 6 | Tennessee |
| 7 | Auburn |
| 8 | Marquette |
| 9 | Illinois |
| 10 | South Carolina |
| 11 | Baylor |
| 12 | Kansas |
| 13 | Utah St |
| 14 | Creighton |
| 15 | Arizona |
| 16 | Duke |
| 17 | Nevada |
| 18 | Kentucky |
| 19 | Alabama |
| 20 | San Diego St |
| 21 | BYU |
| 22 | Florida |
| 23 | Texas Tech |
| 24 | New Mexico |
| 25 | Wisconsin |
| 26 | Gonzaga |
| 27 | Nebraska |
| 28 | Colorado St |
| 29 | Dayton |
| 30 | Clemson |
| 31 | Virginia |
| 32 | Mississippi St |
| 33 | Boise St |
| 34 | Texas |
| 35 | St Mary’s CA |
| 36 | TCU |
| 37 | Drake |
| 38 | Oklahoma |
| 39 | Grand Canyon |
| 40 | Northwestern |
| 41 | Colorado |
| 42 | Texas A&M |
| 43 | Washington St |
| 44 | Indiana St |
| 45 | Pittsburgh |
| 46 | NC State |
| 47 | FL Atlantic |
| 48 | Syracuse |
| 49 | Providence |
| 50 | Michigan St |
| 51 | Oregon |
| 52 | St John’s |
| 53 | James Madison |
| 54 | Seton Hall |
| 55 | Mississippi |
| 56 | Kansas St |
| 57 | Ohio St |
| 58 | Indiana |
| 59 | Princeton |
| 60 | Wake Forest |
| 61 | Cincinnati |
| 62 | Iowa |
| 63 | Butler |
| 64 | Virginia Tech |
| 65 | Villanova |
| 66 | Samford |
| 67 | Richmond |
| 68 | Duquesne |
| 69 | McNeese St |
| 70 | Utah |
| 71 | Memphis |
| 72 | Loyola-Chicago |
| 73 | South Florida |
| 74 | UNLV |
| 75 | Florida St |
| 76 | Boston College |
| 77 | Xavier |
| 78 | UCF |
| 79 | LSU |
| 80 | Georgia |
| 81 | VCU |
| 82 | Minnesota |
| 83 | UAB |
| 84 | Washington |
| 85 | Bradley |
| 86 | San Francisco |
| 87 | Appalachian St |
| 88 | Arkansas |
| 89 | Rutgers |
| 90 | Cornell |
| 91 | Vermont |
| 92 | Miami FL |
| 93 | Col Charleston |
| 94 | Maryland |
| 95 | Penn St |
| 96 | Georgia Tech |
| 97 | St Joseph’s PA |
| 98 | Yale |
| 99 | USC |
| 100 | UC Irvine |
| 101 | St Bonaventure |
| 102 | Santa Clara |
| 103 | George Mason |
| 104 | Massachusetts |
NFL Picks – Week 3
Total – SU: 32-16-0 (66.67%) ATS: 27-20-1 (57.29% +5 Units) O/U: 31-17-0 (64.58% +12.3 Units)
Week 1 – SU: 10-6-0 ATS: 8-8-0 O/U: 13-3-0
Week 2 – SU: 10-6-0 ATS: 10-6-0 O/U: 10-6-0
Week 3 – SU: 12-4-0 ATS: 9-6-1 O/U: 8-8
Tampa Bay at Atlanta
Prediction: Falcons 24-20 (62.5%)
Pick: Buccaneers +6.5 (55.8%)
Total: Under 45
San Francisco at Arizona
Prediction: 49ers 22-20 (55.9%)
Pick: Cardinals +3 (52.7%)
Total: Under 42.5
San Diego at Buffalo
Prediction: Bills 23-22 (51.8%)
Pick: Chargers +2.5 (55.3%)
Total: Over 44.5
Tennessee at Cincinnati
Prediction: Bengals 24-19 (64.5%)
Pick: Titans +7 (55.1%)
Total: Under 43.5
Baltimore at Cleveland
Prediction: Ravens 22-21 (53.5%)
Pick: Browns +2 (52.2%) PUSH
Total: Over 42
Green Bay at Detroit
Prediction: Lions 25-24 (53.4%)
Pick: Lions -1 (50.5%)
Total: Under 52.5
Indianapolis at Jacksonville
Prediction: Colts 23-20 (57.4%)
Pick: Jaguars +7 (62.3%)
Total: Under 45.5
Kansas City at Miami
Prediction: Dolphins 21-19 (55.9%)
Pick: Chiefs +5 (58.2%)
Total: Under 41.5
Oakland at New England
Prediction: Patriots 29-19 (77.2%)
Pick: Raiders +14.5 (61.5%)
Total: Over 47
Minnesota at New Orleans
Prediction: Saints 27-20 (68.3%)
Pick: Vikings +9.5 (58.0%)
Total: Under 51
Houston at NY Giants
Prediction: Giants 22-21 (51.1%)
Pick: Giants +2.5 (58.2%)
Total: Over 42
Washington at Philadelphia
Prediction: Eagles 25-22 (59.8%)
Pick: Washington Football Team +6.5 (58.6%)
Total: Under 50
Denver at Seattle
Prediction: Seahawks 24-22 (54.6%)
Pick: Broncos +4.5 (58.2%)
Total: Under 49
Dallas at St. Louis
Prediction: Cowboys 23-22 (53.0%)
Pick: Rams +2 (52.7%)
Total: Under 45.5
Pittsburgh at Carolina
Prediction: Panthers 23-20 (59.4%)
Pick: Steelers +3.5 (50.5%)
Total: Over 41.5
Chicago at NY Jets
Prediction: Bears 21-20
Pick: Bears +2.5 (60.1%)
Total: Under 45.5
Obama’s gonna win because the Red Sox didn’t win at least 75 games
Many people may be aware of the so called Redskins Rule for predicting presidential elections. Basically, the rule states:
If the Redskins win their last home game before the election, the party that won the previous election wins the next election and that if the Redskins lose, the challenging party’s candidate wins.
This basically means that Romney is a virtual lock to win the presidency after the Redskins fell 21-13 to the Carolina Panthers at home. The Redskins rule has successfully predicted the results of the presidential election 17 out of 18 times since 1937, only failing once in 2004. 17 out of 18 is pretty good, but it’s also only been successful 50% of the time in the last 2 elections; Not so great recently. Football has had it’s run as the go-to sport for projecting presidential elections, but it’s time for it to step aside and let America’s past time take over predicting political outcomes. After all, who knows America better than baseball?
Consider this: Boston has won 75 or more games AND Philly has won 91 or fewer games in the same season 11 times in the last 16 years that presidential election was held (1948, 1952, 1956, 1968, 1972, 1980, 1984, 1988, 1996, 2000, and 2004). In 9 of these 11 years, the Republican party won the presidency. The two exceptions were Clinton in 1996 and Truman in 1948. Conversely, Boston has won less than 75 games OR Philly won 92 or more games in 5 times in the last 16 presidential election years (1960, 1964, 1976, 1992, and 2008). The Democratic party has won all five of those elections. So, if either Boston is terrible or Philly is very good, the Democrat wins. Otherwise the Republicans win with high probability. Using just Boston and Philadelphia, the model correctly chooses the winner 14 out of 16 times.
But let’s take a closer look at what went wrong in the two years that were mis-classified: 1948 and 1996. What happened the year Clinton ran for re-election? The Indians won 99 games. And what happened in 1948? The Indians won 97 games. In fact, in the past 16 presidential election years, the Indians have only won more than 93 games twice. And both of those years were misclassified using only Boston and Philadelphia as predictors. By adding in Cleveland to the model, we can now correctly classify all of the past 16 presidential elections. In hind sight it seems obvious that we need to add the Indians into our model as everyone knows how important it is to include Ohio in any model predicting the presidential race. (I wonder if “Dewey defeats Truman” could have been avoided entirely if the newspapers had relied on the number of Indians regular season wins rather than polls based on biased samples.) The point here is that Ohio really is the most important state in the electoral college.
So, let’s review the three events that need to occur for a Republican to win the presidency and see how they apply to this years race:
1. The Phillies need to win less than 92.
This is great for Romney as the Phillies were a completely average 81-81.
2. The Indians needs to win les than 97 games.
The Indians were atrocious in 2012 finishing with a records of 68-94 more than 25 games below the 97 game barrier. This is second step toward a Romney victory.
3. The Red Sox need to win at least 75 games.
Now, as every Red Sox fan knows, the Red Sox did not win 75 games this year. In fact, they finished 69-93, so we have to predict an Obama victory, even in the face of the Redskins rule.
So, for the record: I’m predicting an Obama victory.
However, this is only where things start to get interesting. For a team to win 76 games, they need a winning percentage of 46.91%, and the Red Sox finished with a winning percentage of 42.6% and missing the mark needed to ensure victory for Romney. Would anyone care to hazard a guess what the Red Sox winning percentage was at the end of August? The Red Sox were 62-70 for a winning percentage of 46.97% on August 31. They were on pace to win exactly 76 games and ensure a Republican triumph. However, they went one to finish the season 7-23, missing the necessary win total to ensure a Romney presidency. Now, clearly, an organization as sophisticated as the Red Sox would be aware of such an obvious statistical relationship as this one; Bill James wasn’t born yesterday after all. Further, the Red Sox and everyone else were aware at the beginning of the 2012 season that it was unlikely that the Phillies nor the Indians would likely reach the magic win marks for the Democratic Party. Therefore, it seems likely, even probable, that the Red Sox goal in 2012 was to lose at least 86 games in order to ensure a second Obama term. Does that sound crazy? Well, here are two key pieces of evidence to support my argument: Bobby Valentine and “the trade”. Clearly, if they were trying to win baseball games, a baseball organization wouldn’t hire Bobby Valentine. Secondly, the Red Sox traded away some of the core players of their team. Specifically, on August 25, the Red Sox traded away Adrian Gonzalez, Josh Beckett, and Carl Crawford to the Los Angeles Dodgers. Sure, the Red Sox front office will claim that it was to “dump salary”, but isn’t it possible that the Red Sox front office realized that on August 25 their record was 60-66 and on pace to win 77 games and made the trade to affect the outcome of the election in November? Just think about the two parties involved in the trade: Boston, which is the capital of one of the most liberal states in the country, involved in a trade with Los Angeles, which is in a state that could not be more blue if it tried. So, like I said, we’re the Red Sox JUST a terrible baseball team in 2012 who hired a manager who has never won anything and traded away some of it’s best players to get some expensive contracts off the books? Maybe. But isn’t that also exactly the story you’d use to cover up your tracks if you were the owner of a baseball team who was intentionally trying to lose at least 88 games in order to guarantee a victory and second term for Barack Obama? I’m just saying.
See you back in reality on November 7.
Cheers.
NCAA Football Rankings – 11/4/2012
|
What does MVP mean anyway?
By James O’Connor
What does it mean to be the Most Valuable Player in Major League Baseball? Is it the player who added the most wins to his team? The player who added the most wins to his team, so long as they made the playoffs? Can it ever be a pitcher? Is it the player who contributed the most to his team down the stretch?
Admittedly, MVP is always going to be a subjective award, based on the perception of the members of Baseball Writers Association of America selected, in any given year, to vote for the award. But modern statistics give us some insight into how those writers make their decisions—even if it is not entirely clear to them when they are voting.
First, let’s look at a few possible methods of selecting the MVP. Wins Against Replacement or WAR is a fairly recent statistical calculation that measures (words). It quite literally measures what player had the most valuable impact on his team in a given year. Yet, only five times in the past 25 years has the American League leader in WAR been awarded the MVP.
How about awarding the MVP to the highest WAR player on a playoff team? This may help. 21 of the previous 25 AL MVP’s were on teams that went to the playoffs (including for the purposes of this article, Frank Thomas, whose Chicago White Sox were in first place in the AL West in 1994 before the player’s strike ended the season). But even this doesn’t completely answer our question. Many of the players who won the award were not even the top WAR players on teams that made the post season. In 2006, Justin Mourneau won the MVP with a WAR of 4, while his teammate, Johan Santana led the league in WAR with 7.3 wins against replacement.
Some may argue that a pitcher should not be eligible for the award, anyway. This is where things get particularly tricky. One issue is that the voters change on a yearly basis. If a voter doesn’t believe a pitcher should not win the award, he can simply leave the pitcher off the ballot and doom his chances. See Martinez, Pedro, 1999. But the reality is, pitchers, do win the award on occasion. It has been posited that this honor is saved for pitchers only when they have had a truly transcendent and historic year. This theory is simply not backed up by the numbers.
In 2011, Justin Verlander was the AL MVP with a WAR of 8.2, good for second in the league. It was a truly awesome season by any measure. The league leader in WAR? You guessed it: Ben Zobrist. Zobrist carried an 8.5 WAR and his Rays made the playoffs. He finished 16th in MVP voting. You can’t entirely blame the writers for going with Verlander though. He was a monster.
Going back for a moment though, how good was Verlander’s year historically? Obviously, WAR is not set up to measure 2011 Verlander to 1999 Pedro Martinez, but the statistic does measure them against their competition for the award. Over the last 25 years, the following pitchers led the league in WAR, but did not win the MVP: Roger Clemens (1987, 1992, 1997), Brett Saberhagen (1989), Kevin Appier (1993), Randy Johnson (1995), Pedro Martinez (1999, 2000), Santana (2006), Zack Greinke (2009). In fact, Clemens’ 1997 campaign (11.8) and Martinez’s 1999 season (11.4), are the two best seasons as measured by WAR in the last 25 years. So, was Verlander’s 2011 season more deserving of the MVP? Probably not.

It’s not as if the MVP voters are picking completely randomly, though. In fact, over the last ten years, seven AL MVPs were in the top three in WAR. Of course, the other three (Mourneau, 2006; Vladimir Guerrero, 2004; and Miguel Tejada, 2002), were 10th or worse in the league in WAR. What happened and how did they win the MVP award?
A couple things to look at here. First, all three of those teams made the playoffs. That helps. As I mentioned earlier, despite the fact that Mourneau was not even first on his team in WAR, he was second to pitcher Santana, who undoubtedly lost votes based on the perception that pitchers should not win the award (however inconsistent this theme is, it’s impossible to ignore that it often does affect voting). Same story for Tejada in 2002, who was behind teammate Barry Zito (6.4) in WAR.
In 2004, the league leader in WAR was Ichiro Suzuki (7.5), whose team won 63 games. You can understand why the voters might not associate “valuable” with a team that lost 99 games. Guerrero took home this prize that year despite a WAR of 5.2, which was good for only 10th in the league. Likewise, in 2002, Tejada and his 5.3 WAR won the award over Alex Rodriguez and his 8.6 WAR. Of course, Alex’s Rangers won 72 games.
So, the argument against the WAR winners from those seasons makes (some) sense. Two played for dreadful teams, one suffered from anti-pitcher bias. But what about the rest of the players ahead of Mourneau, Guerrero and Tejada? This is where intangibles step in. The question in voters minds: Did you have a MOMENT?
Let’s look, for example, at Guerrero’s 2004 season. His OPS for the final month of the season was 161 points higher than his full season OPS. While his Anaheim Angels only went 17-14 over that stretch, they finished on a tear going 7-2 and slipping into the playoffs. While his full season WAR was not at the top of the league, it looked (probably accurately) like he single handedly dragged them into the playoffs in the end. He had a MOMENT. It was fresh in the voters’ minds and he got the MVP.
So is it a great September performance that puts a player on the top of the MVP head? Not necessarily. In 2006, Mourneau put up a beefy .926 OPS, but in the final month of the season his OPS was only .884. What gives? Mourneau’s moment was not the end of the season, but rather the eight week period in June and July when the world was really introduced to the Twins first baseman. In June and July, Mourneau put up 1.137 and 1.130 respectively. Meanwhile his team went 37-15, a win/loss percentage of .711. For the season, the Twins won at a .596 clip. Mourneau had eight weeks where he played his best ball while his team tore through the league. He had a MOMENT.
Ok, so what about Tejada? He must have had one stretch where he absolutely crushed it, right? Not really. Tejada had a relatively so start in 2002, but for the most part he was consistent throughout the season. His monthly OPS was as follows: .813, .807, .867, .910, .879, .888. Definitely stronger in the second half, but not the major swings of Guerrero and Mourneau. So what was his moment? You’ve read or seen Moneyball, right? Yea, the most memorable thing to happen in 2002 (probably even more so than who won the World Series), was the Oakland A’s 20 game winning streak from August 13 to September 4. In a season in which the A’s lost Jason Giambi (who, interestingly led the league in WAR the previous year, but did not win the MVP) and Johnny Damon, Tejada was widely considered the best position player on the most memorable team of the regular season. In other words, that winning streak? It was a MOMENT.
A statistics purist would, of course point out that if these players were more consistent like, say all of the people ahead of them in WAR, then they would not have needed these MOMENTS. Undoubtedly true, but also sort of missing the point. Baseball is a game of memories. Intangibles. It’s about that Oakland fan who will never forget for the rest of his life the run the A’s made in 2002 or the heroics of Vlad Guerrero seemingly dragging his team into the playoffs in 2004. Yes, Rodriguez and Ichiro had great years in 2002 and 2004, but chances are most people (their agents aside), would just as soon forget those seasons ever happened. They were the most valuable players for their teams, but they were not the Most Valuable Players for baseball.
MVP will always be a contentious issue. Lots of times it won’t make sense. I mean, who had more of a MOMENT then Pedro Martinez in 1999 or Roger Clemens’ “twilight year” of 1997? But perhaps, through all the fog, there is some semblance of a rationale for how the writers vote for this thing—whether they know it or not.
NFL Predictions – Week 9
Overall Records for 2012
SU: 84-48
ATS: 72-60
O/U: 71-57-1
Week 9 (11-3 SU, 6-8 ATS, 6-7-1 O/U)
Week 8 (10-4 SU, 9-5 ATS, 9-4 O/U)
Week 7 (10-3 SU, 6-7 ATS, 6-7 O/U)
Week 6 (6-8 SU, 7-7 ATS, 6-7 O/U)
Week 5 (10-4 SU, 7-7 ATS, 7-7 O/U)
Week 4 (10-5 SU, 10-5 ATS, 12-2 O/U)
Week 3 (5-11 SU, 9-7 ATS, 9-7 O/U)
Week 2 (11-5 SU, 9-7 ATS, 8-8 O/U)
Week 1 (11-5 SU, 9-7 ATS, 8-8 O/U)
Week 9
Thursday @8:25pm
Kansas City Chiefs at San Diego Chargers
Prediction: Chargers win 25-19
Pick: Chiefs +8.5
O/U: Over 42.5
Sunday @1pm
Denver Broncos at Cincinnati Bengals
Prediction: Broncos win 24-23
Pick: Bengals +3
O/U: Over 47
Arizona Cardinals at Green Bay Packers
Prediction: Packers win 27-21
Pick: Cardinals +11
O/U: Over 44.5
Miami Dolphins at Indianapolis Colts
Prediction: Colts win 25-21
Pick: Colts +2
O/U: Over 43 PUSH
Baltimore Ravens at Cleveland Browns
Prediction: Ravens 24-18
Pick: Ravens -3.5
O/U: Under 42.5
Buffalo Bills at Houston Texans
Prediction: Texans win 27-24
Pick: Bills +10.5
O/U: Over 47
Carolina Panthers at Washington Redskins
Prediction: Redskins 27-24
Pick: Panthers +3.5
O/U: Over 46
Detroit Lions at Jacksonville Jaguars
Prediction: Lions win 28-15
Pick: Lions -4
O/U: Under 44
Chicago Bears at Tennessee Titans
Prediction: Bears win 24-22
Pick: Titans +3.5
O/U: Over 43.5
Sunday @4:05pm
Minnesota Vikings at Seattle Seahawks
Prediction: Vikings win 24-23
Pick: Vikings +5
O/U: Over 39.5
Sunday @4:25pm
Tampa Bay Buccaneers at Oakland Raiders
Prediction: Buccaneers win 22-21
Pick: Buccaneers +1.5
O/U: Under 45
Sunday @8:30pm
Pittsburgh Steelers at New York Giants
Prediction: Giants win 27-25
Pick: Steelers +3.5
O/U: Over 47
Sunday @8:30pm
Dallas Cowboys at Atlanta Falcons
Prediction: Falcons win 26-22
Pick: Cowboys +5
O/U: Over 47.5
Monday @8:40pm
Philadelphia Eagles at New Orleans Saints
Prediction: Saints win 27-26
Pick: Eagles +3.5
O/U: Over 52.5
Cheers.
BCS: Why bother with the computers?
The BCS is either unbelievably brilliant or completely idiotic. They use computer rankings to legitimize themselves, while at the same time, completely ignoring the computer rankings.
Louisiana Tech is a perfect example of this. Currently, Louisiana Tech is 25th in the BCS standings in spite of the fact that exactly ZERO computer polls have them in the top 25. They crack the BCS standings by coming in at 23 and 24 in the USA Today and Harris polls, respectively. The polls outweigh the computers in such a way that they practically don’t matter.
Another good example of this is Florida State who currently sits at 9 in the BCS rankings. Five of the six rankings have the Seminoles in the top 25 with ranks of 12, 18, 21, 22, and 25, while Sagarin leaves them out entirely. Their average computer rank is 21. In both polls, however, they are currently ranked 7th. And thanks to the way the BCS performs the weighting the average of 7, 7, and 21 is 9. That’s BCS math for you.
The weighting for the BCS is one-third each for the two polls and one-third for the computer rankings. However, if you look at the top 13 in both BCS polls, they are exactly the same. This has the effect of essentially using only one poll but giving it two-thirds weight and giving the computers only one-third. Voters can simply get together and vote in such a way that renders the computers meaningless. Only one of the six computer rankings, Richard Billingsley, has Alabama ranked number 1, and yet they are nearly a unanimous number one in the voting. Some more solid BCS math for you.
Whoever set up the BCS either had no idea what they were doing, tried to set-up a fair, rational system of ranking incorporating human voters and computers, and failed spectacularly, or knew exactly what they were doing, incorporated computers to make themselves look legitimate, and was wildly successful in maintaining the status quo. Sometimes it’s hard to tell the difference between genius and insanity.
Cheers.
RIPPEN after week 8
Alex Smith’s performance on Monday night was the best performance by a quarterback in any game this season with a RIPPEN of 57.977. The next closest performance was Aaron Rodgers in week 7 with a RIPPEN of 43.235.
Smith’s incredible performance on Monday night wasn’t perfect though according to passer rating. He only charted a 157.1, which is, of course, absolutely ridiculous. Take a look at the list of games where the QB has ended with a perfect rating and try to tell me with a straight face that Alex Smith’s Monday night performance was worse than all of these. For instance, in 2005 Roethlisberger finished a game 9 for 11 with 232 passing yards and 2 TD and a perfect passer rating. How in the world can that be better than Alex Smith’s 18 for 19 performance for 232 yards and three touchdowns? It’s because passer rating is terrible.
RIPPEN rankings for week 8 performances:
| Player | Team | RIPPEN | QB rating |
| Smith, A. | SF | 57.977 | 157.1 |
| Manning, P. | DEN | 32.232 | 138.9 |
| Ryan, M. | ATL | 30.023 | 137.4 |
| Brady, T. | NE | 26.385 | 131.1 |
| Roethlisberger, B. | PIT | 24.045 | 121.0 |
| Stafford, M. | DET | 23.692 | 101.7 |
| Luck, A. | IND | 21.747 | 89.5 |
| Wilson, R. | SEA | 19.716 | 96.8 |
| Cutler, J. | CHI | 18.324 | 83.3 |
| Freeman, J. | TB | 17.853 | 104.2 |
| Newton, C. | CAR | 17.054 | 57.0 |
| Ponder, C. | MIN | 16.026 | 74.8 |
| Bradford, S. | STL | 16.004 | 88.9 |
| Cassel, M. | KC | 14.130 | 85.1 |
| Gabbert, B. | JAX | 13.057 | 80.6 |
| Manning, E. | NYG | 12.378 | 58.4 |
| Rodgers, A. | GB | 12.331 | 95.7 |
| Romo, T. | DAL | 12.222 | 58.3 |
| Palmer, C. | OAK | 10.750 | 83.8 |
| Vick, M. | PHI | 10.046 | 84.3 |
| Griffin, III, R. | WAS | 9.623 | 72.8 |
| Sanchez, M | NYJ | 8.801 | 65.6 |
| Skelton, J. | ARI | 8.159 | 68.6 |
| Brees, D. | NO | 8.158 | 72.8 |
| Weeden, B. | CLE | 7.906 | 55.9 |
| Tannehill, R. | MIA | 3.299 | 50.4 |
| Rivers, P. | SD | 2.015 | 65.1 |
Season RIPPEN rankings through 8 weeks of games:
| Player | Team | RIPPEN | QB rating |
| Manning, P. | DEN | 30.093 | 109.0 |
| Rodgers, A. | GB | 24.579 | 107.9 |
| Brady, T. | NE | 23.768 | 100.6 |
| Griffin, III, R. | WAS | 23.374 | 97.3 |
| Smith, A. | SF | 22.617 | 102.1 |
| Ryan, M. | ATL | 22.566 | 103.0 |
| Schaub, M. | HOU | 22.415 | 93.1 |
| Newton, C. | CAR | 21.982 | 75.2 |
| Roethlisberger, B. | PIT | 20.834 | 101.4 |
| Brees, D. | NO | 18.954 | 93.0 |
| Freeman, J. | TB | 18.242 | 93.3 |
| Manning, E. | NYG | 17.580 | 89.1 |
| Bradford, S. | STL | 17.485 | 82.4 |
| Locker, J. | TEN | 17.147 | 90.2 |
| Romo, T. | DAL | 16.548 | 78.8 |
| Stafford, M. | DET | 16.317 | 82.1 |
| Tannehill, R. | MIA | 16.205 | 75.8 |
| Ponder, C. | MIN | 16.113 | 85.8 |
| Cutler, J. | DEN | 15.904 | 78.9 |
| Dalton, A. | CIN | 15.372 | 87.7 |
| Luck, A. | IND | 14.992 | 74.6 |
| Vick, M. | PHI | 14.703 | 78.6 |
| Wilson, R. | SEA | 14.229 | 82.4 |
| Palmer, C. | OAK | 14.062 | 85.7 |
| Flacco, J. | BAL | 13.770 | 84.0 |
| Rivers, P. | SD | 13.328 | 82.4 |
| Fitzpatrick, R. | BUF | 12.039 | 86.1 |
| Weeden, B. | CLE | 11.485 | 70.8 |
| Sanchez, M. | NYJ | 11.484 | 72.8 |
| Cassel, M. | KC | 10.430 | 69.0 |
| Kolb, K. | ARI | 9.662 | 86.1 |
| Gabbert, B. | JAX | 8.943 | 77.9 |
| Skelton, J. | ARI | 8.363 | 64.5 |
| Hasselbeck, M. | TEN | 8.039 | 83.3 |
Cheers.
