Blog Archives
However bad you think the Rockies are, they are worse. Even worse than the White Sox last year (so far).
Update: They swept the Marlins and are now on a 3 game winning streak and sit at 12-50. They are 25 games out of first place with 100 games to play.
Update: They won last night and are now 10-50 as of noon on June 3.
The Rockies are 9-50. That’s 50 losses in 59 games. A winning percentage of .153. That’s the fastest any team has gotten to 50 losses since 1901. But didn’t we just get a new worst ever team last year in the Chicago White Sox? Yup! The Chicago White Sox lost 121 games last year, the most ever. And the Rockies are currently on pace to shat. ter. the White Sox loss record from last year. They are currently on pace to go 25-137. How bad is this? At this point in the season, the White sox were 15-44. SIX games ahead of where the Rockies are right now. To see this, let’s look at some data viz that I made.
Below is a plot of game number versus cumulative wins. Up until about game 30 the Rockies were merely just as bad as the White Sox. Since then they have really stepped down their game thanks to multiple 8 game losing streaks. Speaking of streaks, let’s take a look at that.

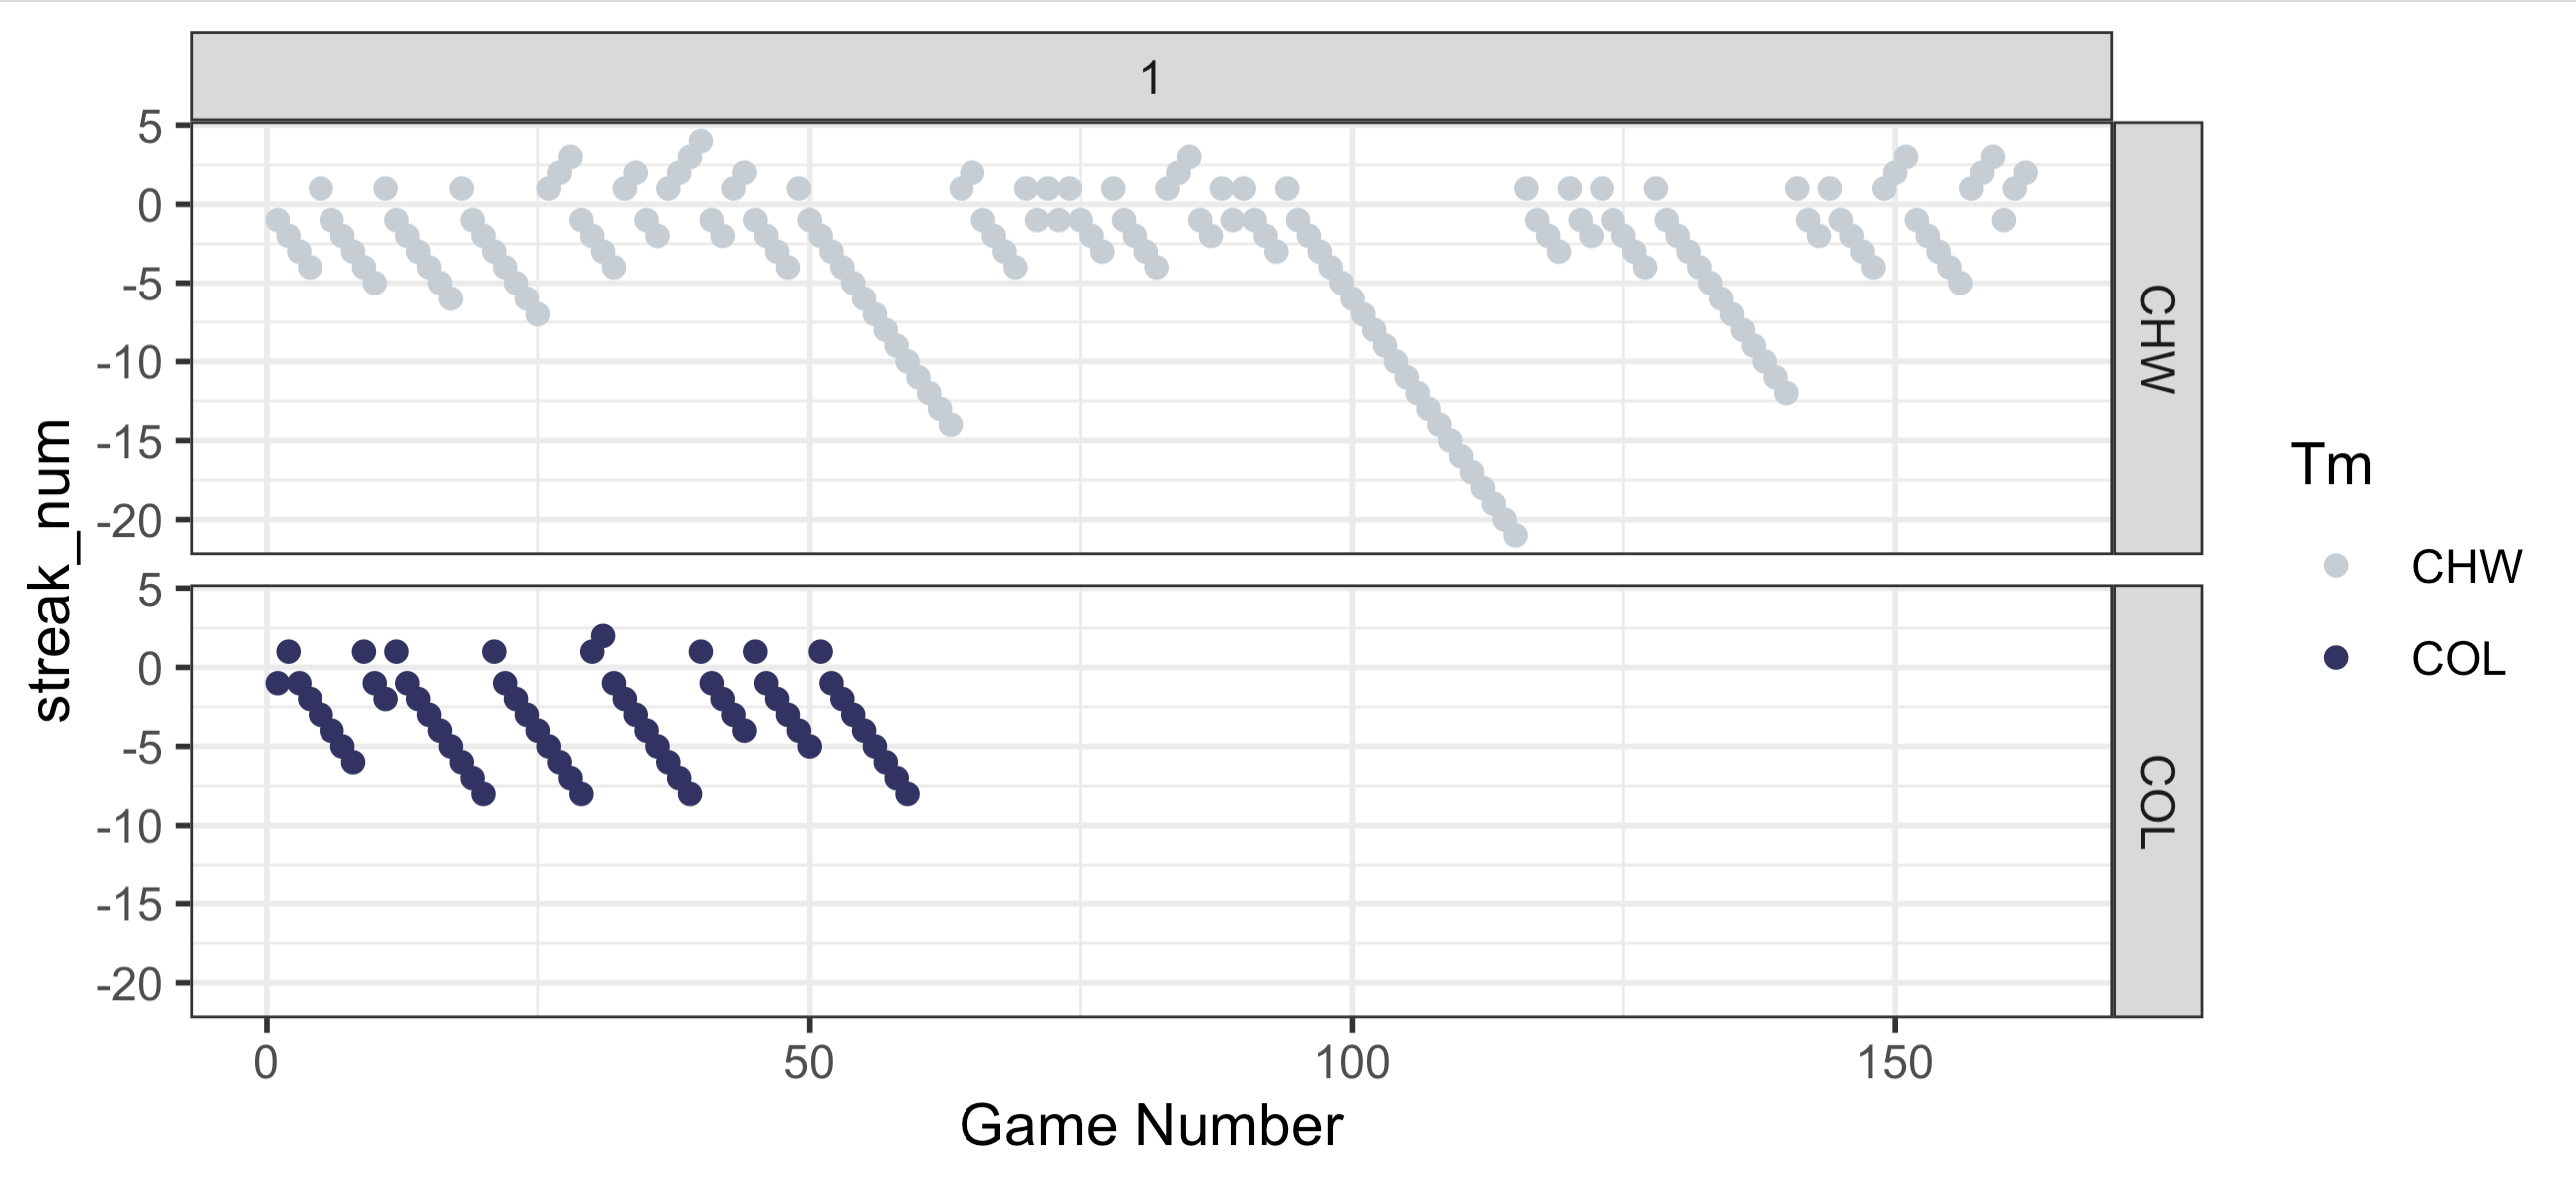
Below, you’ll find a plot of game number on the x axis and the win/loss streak on the y-axis. Positive numbers are winning streaks and negative numbers are losing streaks. You can see that the Rockies have already had FOUR 8 game losing streaks. But even more impressive than that is that they’ve only won back to back games a single time this season. Let me repeat this: Their largest win streak of the season is 2 games and it’s happened exactly once. The White Sox last year has winning streak of 2 or more 9 times total and 4 up to this point in the season,. They even had a nifty little 4 game winning streak (They also had losing streaks of 12, 14, and 21(!!!) games).
Now let’s take a look at scoring for the Rockies. Below is a 2d contour plot of for the runs for and runs against for every game from the White Sox 2024 season in the left panel and every game of the current Rockies season. The horizontal and vertical lines are the mean number of runs for and against and the diagonal lines shows whether the game was won or lost by the respective team (above the line is a loss, below the line if a win). What’s really interesting about this is that in the entire season last year, the White Sox only score 10 or more runs TWICE. The Rockies have already done this 3 times. Also, the most runs that the White Sox gave up all season was 14 runes. The Rockies have given up more than 14 runs twice already. (a 17-2 loss to the Brewers and a 21-0 loss to the Padres).
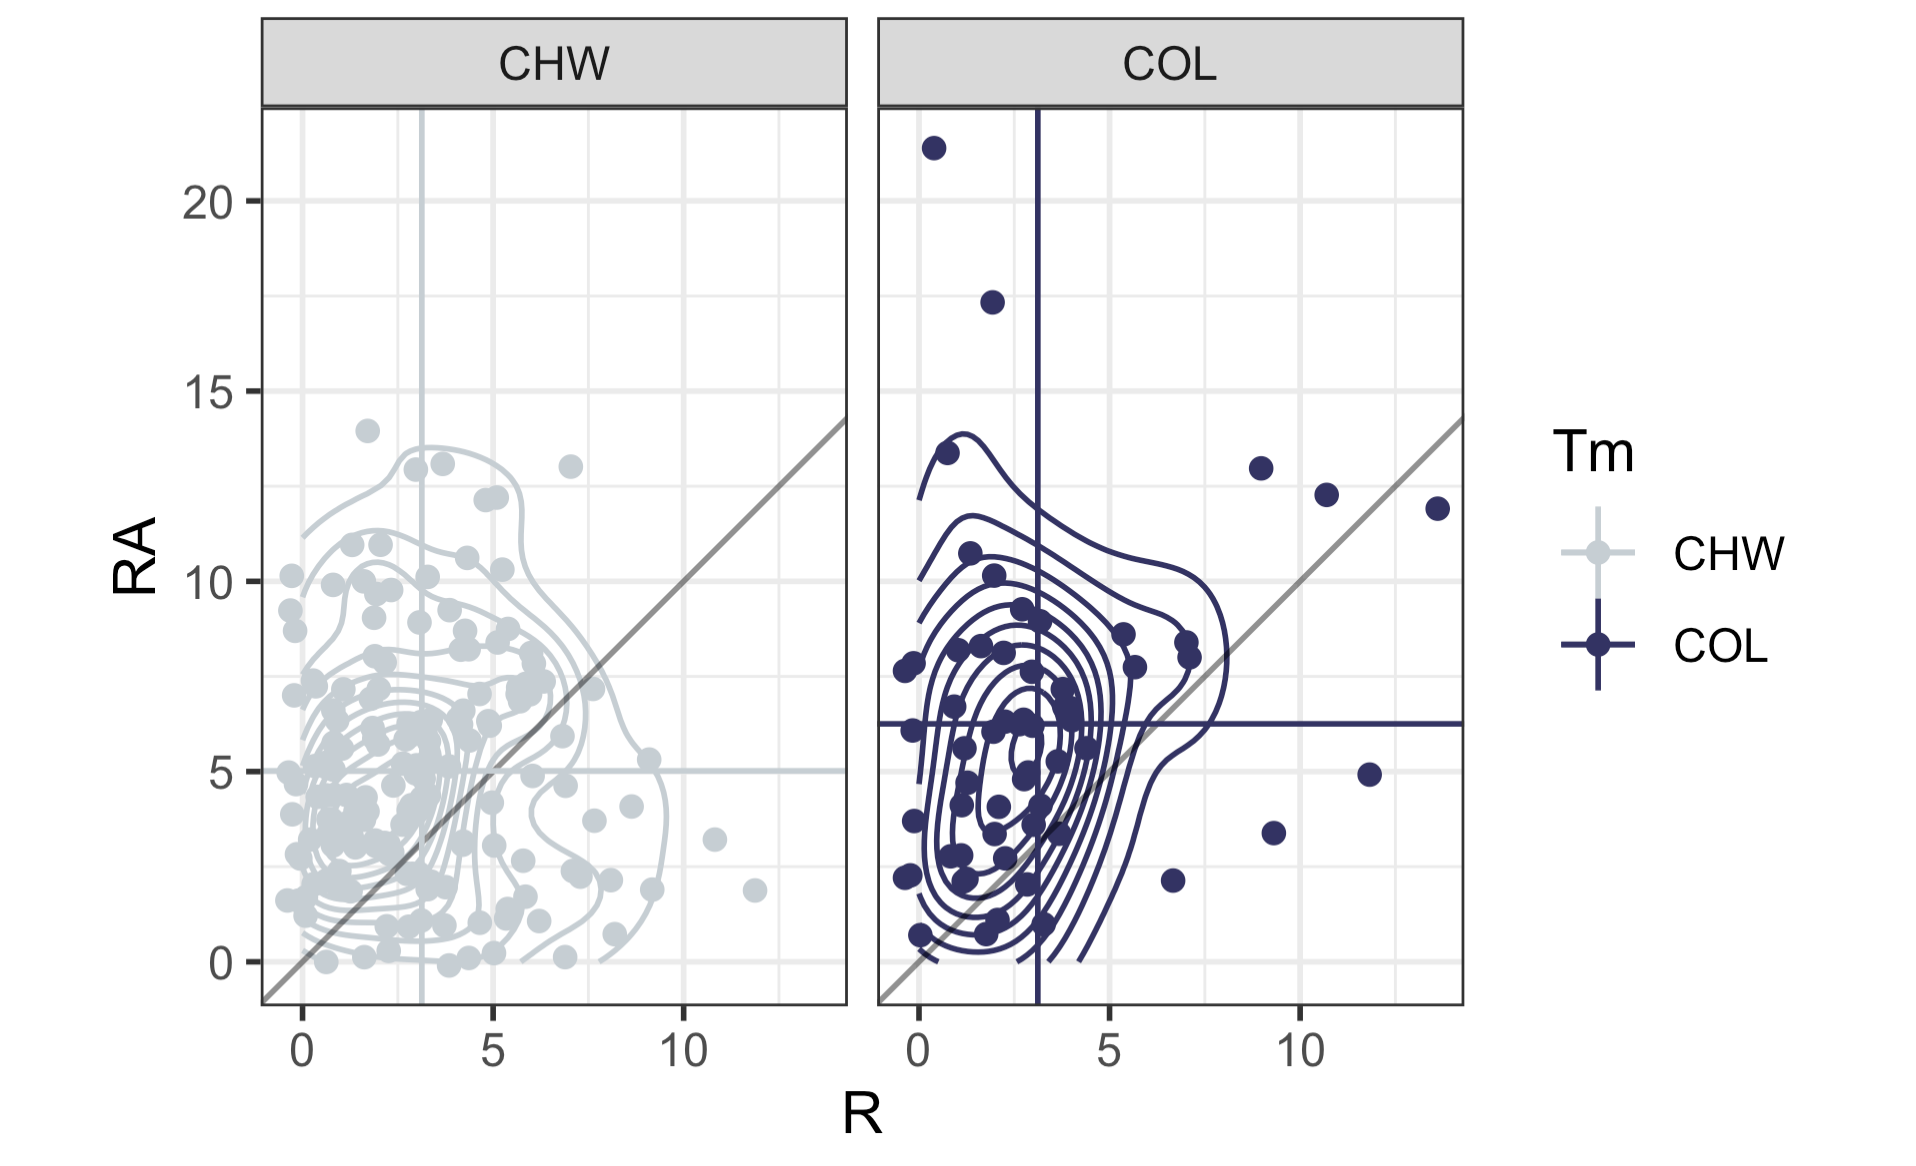
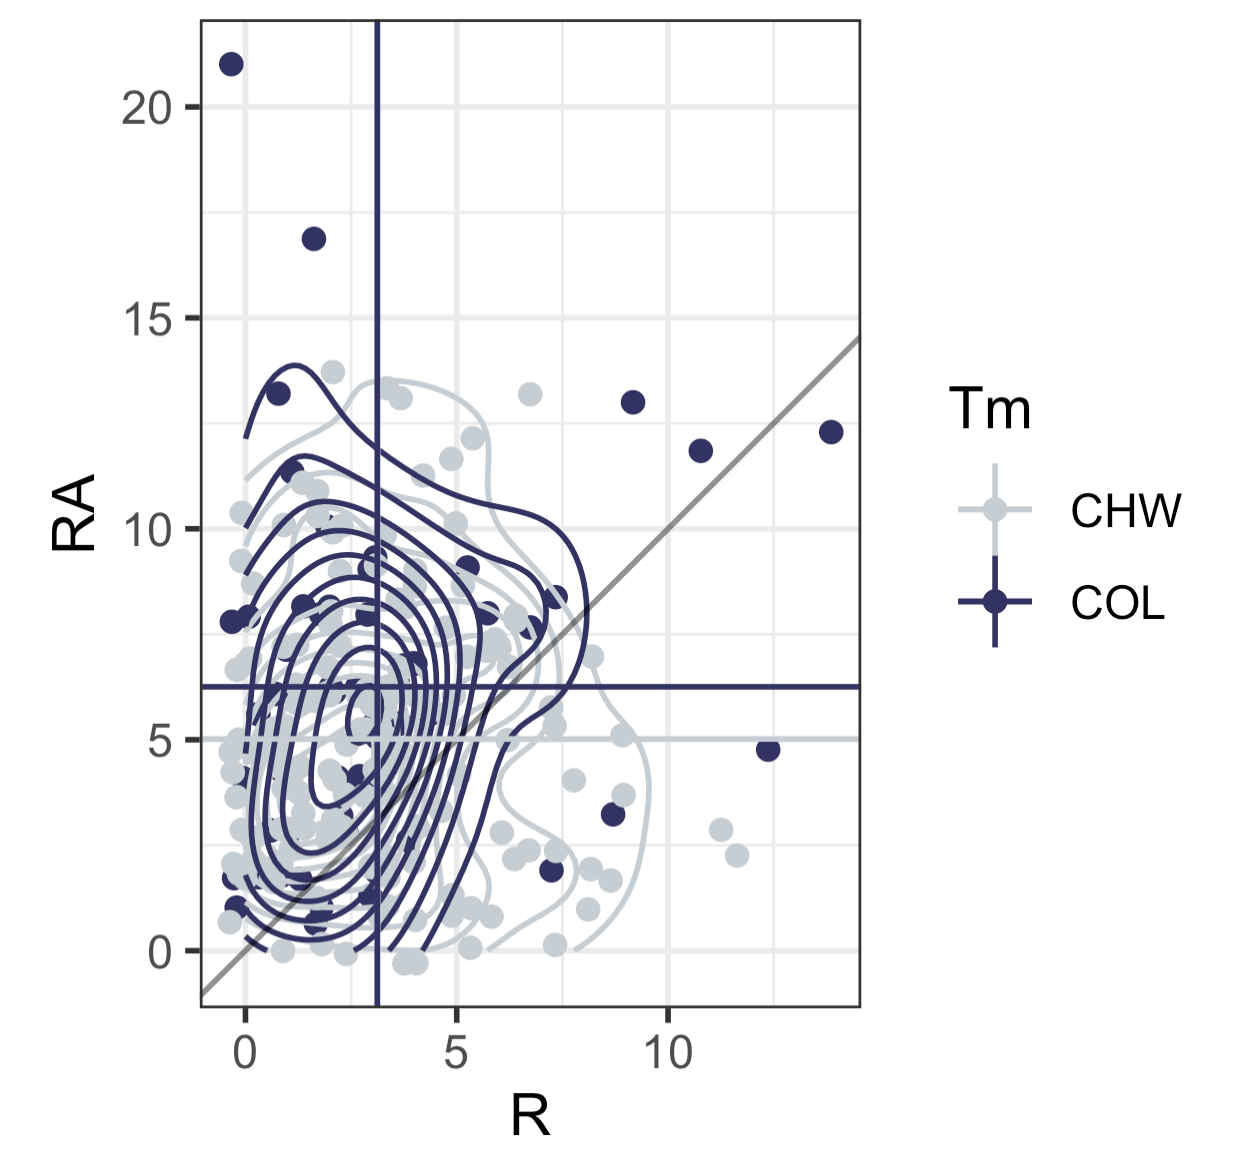
Here is what these plots look like on top of one another. What you’ll notice is that it’s hard to see the vertical line for the White Sox (i.e. their mean number of runs) because it’s nearly identical to the Rockies. The White Sox average 3.13 runs per game last year and the Rockies are just slightly below that at 3.12 runs per game. But where Colorado really “shines” is their defense. While the White Sox gave up an average of just over 5 runs per game (5.02, to be exact), the Rockies are currently allowing, and I can’t believe this is true, 6.25 runs per game. That 1.23 more runs per game on average than the worst team in the modern history of baseball. Incredible work.
If you’re a median type of person, I computed those two. The White Sox last year scored a median of 3 runs and allowed a median of 5 runs. For the Rockies this year, they are scoring a median of 2 runs and allowing a median of 6 runs.
Anyway, the point is that the Rockies are [really]+ bad.
My code is below.
Cheers.
rock <- read.csv("/Users/gregorymatthews/Dropbox/statsinthewild/rockies2025_20250602.csv")
ws <- read.csv("/Users/gregorymatthews/Dropbox/statsinthewild/whitesox2024.csv")

names(rock)[1] <- names(ws)[1] <- "gameno"
rock$streak_num <- as.numeric(paste0(substring(rock$Streak,1,1),nchar(rock$Streak)))
rock$W <- as.numeric(unlist(lapply(strsplit(rock$W.L.1,"-"),function(x){x[1]})))
rock$L <- as.numeric(unlist(lapply(strsplit(rock$W.L.1,"-"),function(x){x[2]})))

ws$streak_num <- as.numeric(paste0(substring(ws$Streak,1,1),nchar(ws$Streak)))
ws$W <- as.numeric(unlist(lapply(strsplit(ws$W.L.1,"-"),function(x){x[1]})))
ws$L <- as.numeric(unlist(lapply(strsplit(ws$W.L.1,"-"),function(x){x[2]})))
both <- rbind(rock,ws)

library(tidyverse)
library(teamcolors)
small <- teamcolors %>% filter(name %in% c("Chicago White Sox","Colorado Rockies"))
ggplot(aes(x = gameno, y = W,color = Tm), data =both) +
  geom_path() +
  theme_bw() +
  scale_color_manual(values = c(small$secondary[1],small$primary[2])) +
  xlab("Game Number")

ggplot(aes(x = gameno, y = streak_num, col = Tm), data = both) + geom_point() + theme_bw() + facet_grid(Tm~1) + scale_color_manual(values = c(small$secondary[1],small$primary[2])) + xlab("Game Number")

ggplot(aes(x = R, y = RA, color = Tm), data = both) +
  geom_jitter() +
  geom_density2d() +
  scale_color_manual(values = c(small$secondary[1],small$primary[2])) +
  theme_bw() + geom_abline(slope = 1, color = rgb(0,0,0,.5)) +
  geom_vline(aes(xintercept = R, color = Tm), data = both %>% group_by(Tm) %>% summarise(R = mean(R),RA = mean(RA))) +
  geom_hline(aes(yintercept = RA, color = Tm), data = both %>% group_by(Tm) %>% summarise(R = mean(R),RA = mean(RA))) + coord_fixed() +

both %>% group_by(Tm) %>% summarise(median(R),median(RA))
both %>% group_by(Tm) %>% summarise(mean(R),mean(RA))

both %>% filter(Tm == "COL") %>% pull(R) %>% table()
both %>% filter(Tm == "CHW") %>% pull(R) %>% table()
The Hall of Fame Pitch for Curt Schilling
This is a guest post written by Ted.
Curt Schilling has always been a very polarizing figure to the fans and media that follow Major League Baseball. Outspoken and controversial, Schilling has never shied away from making his political, social, and baseball opinions public knowledge. In addition, the recent catastrophic failure of his video game company, 38 Studios, and their default on a $75 million loan to the state of Rhode Island have left many shaking their head at the very mention of Curt Schilling’s name. However, when it comes to Curt Schilling the baseball player, polarization should not exist.
Last January, Schilling was eligible for the Hall of Fame for the first time. He ironically received votes from 38.8% of Hall of Fame voters (Schilling’s uniform number for the majority of his career was 38) for induction. 75% is needed for induction into the Hall of Fame. Needless to say, Schilling was far off from being immortalized in Cooperstown. Was this right? Did the voters give Schilling fair consideration? I have no vote for the Baseball Hall of Fame, but I’ve studied Curt Schilling’s career at length, and I’m convinced that the Baseball Writers Association of America (BBWAA) who vote for the Hall of Fame inductees every year got this one very wrong.
In my opinion, there are two factors to analyze when considering any player for the Hall of Fame – qualitative and quantitative. I want to focus on the quantitative factors first and then discuss Curt Schilling’s qualitative Hall of Fame attributes.
Schilling finished his regular season career with a record of 216-146 and a 3.46 ERA in 569 games (436 starts). He also pitched 3,261 innings and had 22 saves. He walked 711 batters and struck out 3,116. His career WHIP was 1.137. In the postseason, he had a record of 11-2 in 19 games with an ERA of 2.23. He pitched in 133 1/3 postseason innings, walking 25 and striking out 120 with a WHIP of 0.968. He won World Series Championships with Arizona (2001) and Boston (2004 & 2007). This is the extent of many traditional voters’ analysis of Schilling’s career. Many of these voters looked at his regular season career ERA as being a little high and most importantly in their mind, his win total of 216 much too low.
In order to truly analyze Schilling’s career, it’s important to go much deeper. First, wins are an extremely flawed statistic. The pitcher can only control so much during a baseball game. Lack of run support or a bad bullpen can hurt the starting pitcher’s chances of picking up a win in any start. In addition, pitchers are often victimized by poorly positioned fielders, fielding errors, and just plain bad luck on batted balls in play. A pitcher should be judged on what he can control, namely allowing runners to reach base. In this regard, walks and strikeouts should be emphasized. The pitcher can prevent runners from getting on base via a walk, and he can take the risk out of batted balls in play by striking the batter out. When it comes to walks and strikeouts, Schilling was a master at his craft.
Schilling is 22nd all-time in strikeouts per 9 innings pitched at 8.6. He is 82nd all-time in walks per 9 innings pitched at 1.962. However, Schilling’s most telling statistic is he’s 2nd all-time with a strikeout/walk ratio of 4.383. Over a 20 year career as mostly a starting pitcher, this is truly remarkable. Schilling’s knack for being a power pitcher with excellent control consistently gave his team a great chance at winning his starts by limiting the amount of runners on base with a free pass and the chance of batted balls in play producing runs. He excelled at what he could control as a pitcher.
From an advanced statistical standpoint, Schilling belongs amongst the greats of the game. He is 62nd on the all-time Wins Above Replacement (WAR) list at 79.9 and 26th all-time on the WAR for Pitchers list at 80.7. There are several Hall of Fame pitchers on that list ranked behind Schilling including Old Hoss Radbourn, Don Sutton, Red Faber, Amos Rusie, Jim Palmer, Carl Hubbell, Bob Feller, Dennis Eckersley, Juan Marichal, and Don Drysdale. Schilling is equally impressive in the career rankings of various Hall of Fame advanced metrics. He’s 36th all time for pitchers in Baseball-Reference.com’s Black Ink and Gray Ink. He’s also 27th all time for pitchers in Jay Jaffe’s JAWS which measures Hall of Fame credentials based upon players already enshrined. It emphasizes the 7 best WAR seasons in a player’s career which demonstrates a player’s level of dominance during their prime. In short, Schilling is statistically right in the thick of some of the best pitchers the game has ever seen.
Qualitatively, Schilling has provided baseball with some of its greatest moments. Known as a big game pitcher, Schilling, along with Randy Johnson, was a rock for the 2001 Arizona Diamondbacks en route to the franchise’s first World Series Championship. He shared the 2001 World Series MVP award with Johnson and went 4-0 during those playoffs with a 1.12 ERA. In 2004, Schilling was crucial in the Red Sox’ first World Series Championship in 86 years. During that postseason, Schilling won Game 6 of the American League Championship Series while having a severely injured tendon sheath in his right ankle. This is famously referred to as the “bloody sock” game. Schilling went on to pitch successfully in the World Series against the Cardinals with that same injured ankle. In 2007, Schilling again played a major role in bringing another World Series Championship to the Boston Red Sox. For those writers who look at a player’s careers in terms of championships and how they perform on the big stage, it doesn’t get much better than Curt Schilling.

While I expect Schilling’s vote total for the Hall of Fame to increase this year, I don’t expect him to be inducted in 2014 as this year’s Hall of Fame ballot is exceptionally strong and many voters are known for limiting their ballots to only a few, select players even though they can vote for up to ten. First year players on the ballot include Tom Glavine, Mike Mussina, Frank Thomas, and Greg Maddux. In addition, second year eligible players that should see a boost in their vote totals include Craig Biggio, Mike Piazza, Roger Clemens, and Barry Bonds. However, I hope that many voters will look at their ballots more closely this year and really dig into the career numbers of Curt Schilling. If they do, they’ll find a pitcher who has more than enough quantitative and qualitative attributes to be immortalized in Cooperstown.
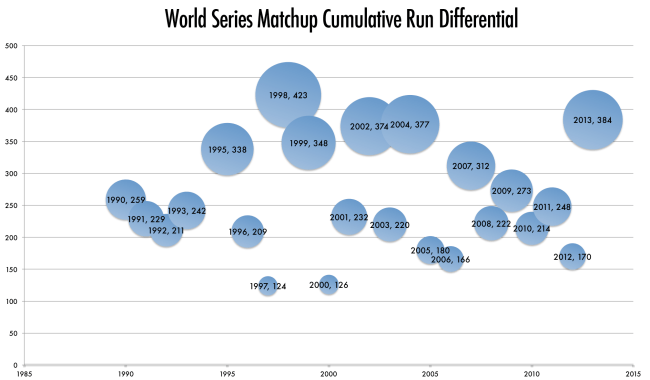
Fun with World Series Run Differentials
The Red Sox and Cardinals meeting in the Fall Classic represents the top run differentials in each league squaring off. Baseball statheads should feel the warm glow of empiricism peeking through, especially after last year when we had to hear from some about the overrating of run differential. Why is it at all controversial to say that the team largest difference between runs scored and runs allowed over 162 games? Is that a radical notion? I think part of it is the basic notion that most people don’t understand randomness (or “luck” or “fortuosity” or “midichlorians” or whatever you want to call it) and that even in a large sample of 162 games, you can have smaller sub-samples (like the Orioles’ 38 one-run games last season, in which they went an insane 29-9) where randomness can take over, and then the whole sample ends up a bit screwy.
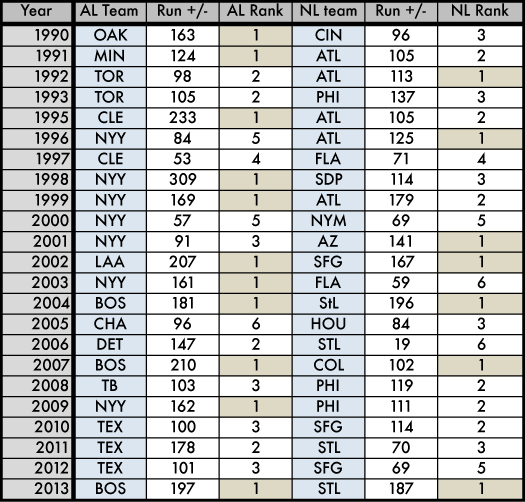

* One fact that always seems to be left out when narratives are being created about the 2004 Red Sox is that they led the AL in run differential and it was about as close as Reagan vs Mondale. The Red Sox scored 181 more runs than they allowed. The second place AL team was the Angels, at +102, third was the Yankees at +89. The Red Sox’ expected record was 98 wins, same as their actual record. It was the 2004 Yankees whose record was grossly out of tune with their expected win-loss, as they won 101 games but were expected to win only 89 (which actually would have placed them behind the A’s for the Wild Card). It wasn’t that the Red Sox were scrappy and overcame obstacles, it was more that they were the much better team, best in the AL, and the Yankees’ magic dust finally wore out. It’s not as fun of a narrative, but it’s got a better empirical basis. Of course, it still doesn’t explain why the Yankees never bunted on Curt Schilling and his bloody sock, but that’s strategy, not empiricism.
Stat Pundit Rankings: MLB win over-unders
About two weeks ago, I used some familiar metrics to analyze how analytics-based websites performed as far as predicting MLB win totals. With the regular season now complete, winning bets have been cashed, and the official performance for each site is listed below:
O/U: The Hilton’s over/under for each team
BP: Baseball prospectus
TR: Team Rankings (caveat on the linked page: the site stresses their MLB predictions are a work in progress)
DP: Davenport
Zips: ZIPS projection system (espn.com)
PM: Prediction Machine
TB: Trading bases, an avid blogger and book-writer
Here are my metrics
MSE: Averaged squared error between the prediction and the win totals (lower is better)
MAE: Averaged absolute error between the prediction and the win totals (lower is better)
Corr: Correlation between the predicted and the win totals (higher is better)
Results
| O/U | BP | TR | DP | Zips | PM | TB | |
| MSE | 82.65 | 74.40 | 98.60 | 85.43 | 87.53 | 94.27 | 71.53 |
| MAE | 7.37 | 7.33 | 8.40 | 7.37 | 7.40 | 7.86 | 6.93 |
| Corr | 0.66 | 0.70 | 0.58 | 0.64 | 0.64 | 0.59 | 0.71 |
Baseball Prospectus and Trading Bases appear to offer the only clear advantage over the Las Vegas line, at least among these predictions, as judged by a higher correlation and a lower MSE between observed and predicted values. On average, TB was the only prediction site to finish, on average, within seven wins of the actual results.
A savvy bettor would’ve finished 12-9 on bets where BP differed by the Las Vegas O/U by more than two wins, and 10-6 using the same cutoff for TB. Picks that BP and TB agreed (by more than 2 predicted wins) on finished 7-4
Here are the Vegas lines and each site’s picks. In some cases, the projected total wins might not add up to 82 per team, most likely due to rounding errors.
| Team | O/U | BP | TR | DP | Zips | PM | TB | Actual |
| Diamondbacks | 82.5 | 85 | 83 | 81 | 85 | 76.8 | 80 | 81 |
| Braves | 86.5 | 83 | 85 | 85 | 91 | 86.6 | 82 | 96 |
| Orioles | 78.5 | 75 | 81 | 75 | 82 | 79.2 | 76 | 85 |
| Red Sox | 82.5 | 85 | 79 | 85 | 84 | 80.5 | 83 | 97 |
| Cubs | 72.5 | 77 | 73 | 76 | 74 | 75.8 | 69 | 66 |
| White Sox | 80.5 | 76 | 83 | 76 | 80 | 85 | 78 | 63 |
| Reds | 90.5 | 92 | 84 | 86 | 90 | 91.1 | 84 | 90 |
| Indians | 78.5 | 80 | 74 | 79 | 80 | 76.8 | 85 | 92 |
| Rockies | 71.5 | 71 | 75 | 74 | 70 | 77.5 | 70 | 74 |
| Tigers | 92.5 | 91 | 86 | 95 | 91 | 89.7 | 95 | 93 |
| Marlins | 63.5 | 67 | 75 | 65 | 65 | 65.3 | 64 | 62 |
| Astros | 58.5 | 63 | 67 | 72 | 57 | 62.5 | 66 | 51 |
| Royals | 78.5 | 76 | 78 | 80 | 79 | 75 | 77 | 86 |
| Angels | 91.5 | 91 | 86 | 91 | 93 | 93.3 | 88 | 78 |
| Dodgers | 91.5 | 91 | 83 | 88 | 90 | 90.6 | 91 | 92 |
| Brewers | 81.5 | 78 | 83 | 78 | 81 | 77.6 | 78 | 74 |
| Twins | 68.5 | 65 | 74 | 69 | 66 | 70.9 | 66 | 66 |
| Mets | 75.5 | 80 | 78 | 76 | 66 | 76.8 | 74 | 74 |
| Yankees | 86.5 | 91 | 90 | 86 | 83 | 84.7 | 87 | 85 |
| Athletics | 84.5 | 83 | 86 | 84 | 78 | 85.3 | 85 | 96 |
| Phillies | 85.5 | 81 | 84 | 81 | 82 | 81 | 86 | 73 |
| Pirates | 77.5 | 80 | 77 | 81 | 77 | 74.8 | 79 | 94 |
| Padres | 73.5 | 76 | 78 | 76 | 73 | 72.7 | 81 | 76 |
| Giants | 87.5 | 85 | 85 | 92 | 87 | 85.1 | 88 | 76 |
| Cardinals | 82.5 | 85 | 86 | 83 | 85 | 85.1 | 90 | 97 |
| Rays | 86.5 | 87 | 88 | 86 | 88 | 89.5 | 93 | 91 |
| Rangers | 86.5 | 89 | 88 | 85 | 91 | 86.8 | 85 | 91 |
| Blue Jays | 88.5 | 84 | 78 | 86 | 94 | 87.5 | 82 | 74 |
| Nationals | 91.5 | 87 | 86 | 85 | 94 | 92.5 | 90 | 86 |
| Mariners | 77.5 | 78 | 79 | 73 | 74 | 74 | 78 | 71 |
MLB over-unders: Can anyone beat Las Vegas?
Back in March, several dozen websites, written by either professionals, bloggers, or, in some cases, professional bloggers, came out with predicted MLB win totals.
A predicted win total represents the number of wins this website or individual predicted for each major league team. These numbers can be easily compared to the Las Vegas line for each team (I used the one set by the Hilton) to determine if these predictions are worth our time, and, in some cases, our money.
Here are the sites I used:
O/U: The Hilton’s over/under for each team
BP: Baseball prospectus
TR: Team Rankings (caveat on the linked page: the site stresses their MLB predictions are a work in progress)
DP: Davenport
Zips: ZIPS projection system (espn.com)
PM: Prediction Machine
TB: Trading Bases, an avid blogger and book-writer
Here are my metrics
MSE: Averaged squared error between the prediction and the win totals*
MAE: Averaged absolute error between the prediction and the win totals*
Corr: Correlation between the predicted and the win totals*
*For win totals, I’m use each team’s estimated win totals from here (I’m too excited to wait until the end of the season!)
Results
| O/U | BP | TR | DP | Zips | PM | TB | |
| MSE | 68.59 | 62.50 | 84.56 | 70.47 | 75.37 | 79.76 | 61.04 |
| MAE | 6.65 | 6.75 | 7.73 | 6.75 | 7.01 | 7.22 | 6.53 |
| Corr | 0.68 | 0.71 | 0.59 | 0.67 | 0.66 | 0.61 | 0.72 |
Baseball prospectus appears to offer the only clear advantage over the Las Vegas line, at least among these predictions, as judged by a higher correlation and a lower MSE between observed and predicted values. As for team rankings & prediction machine, their results were both disappointingly bad. (Note: Trading Bases came into the picture after the initial post, and also appears to be a clear winner).
TeamRankings does offer this disclaimer about their projections:
A word of caution — while our preseason projections for other sports have proven to be useful indicators of where values may lie among the various full season futures bets, we’re not nearly as confident in our MLB preseason ratings. We’re publishing these in the interest of full disclosure, so that you know what the initial rating in our projection system was for each team. We’re most definitely not recommending that you use these ratings and forecasts to go place preseason bets.
Here’s the table of predicted wins for each site.
| Team | O/U | BP | TR | DP | Zips | PM | TB | Simulated Wins |
| Diamondbacks | 82.5 | 85 | 83 | 81 | 85 | 76.8 | 80 | 82.5 |
| Braves | 86.5 | 83 | 85 | 85 | 91 | 86.6 | 82 | 95.8 |
| Orioles | 78.5 | 75 | 81 | 75 | 82 | 79.2 | 76 | 86.2 |
| Red Sox | 82.5 | 85 | 79 | 85 | 84 | 80.5 | 83 | 97.2 |
| Cubs | 72.5 | 77 | 73 | 76 | 74 | 75.8 | 69 | 67.5 |
| White Sox | 80.5 | 76 | 83 | 76 | 80 | 85 | 78 | 64.2 |
| Reds | 90.5 | 92 | 84 | 86 | 90 | 91.1 | 84 | 92 |
| Indians | 78.5 | 80 | 74 | 79 | 80 | 76.8 | 85 | 87.9 |
| Rockies | 71.5 | 71 | 75 | 74 | 70 | 77.5 | 70 | 72.9 |
| Tigers | 92.5 | 91 | 86 | 95 | 91 | 89.7 | 95 | 94.5 |
| Marlins | 63.5 | 67 | 75 | 65 | 65 | 65.3 | 64 | 60.1 |
| Astros | 58.5 | 63 | 67 | 72 | 57 | 62.5 | 66 | 54.9 |
| Royals | 78.5 | 76 | 78 | 80 | 79 | 75 | 77 | 85.1 |
| Angels | 91.5 | 91 | 86 | 91 | 93 | 93.3 | 88 | 79 |
| Dodgers | 91.5 | 91 | 83 | 88 | 90 | 90.6 | 91 | 92.5 |
| Brewers | 81.5 | 78 | 83 | 78 | 81 | 77.6 | 78 | 73.3 |
| Twins | 68.5 | 65 | 74 | 69 | 66 | 70.9 | 66 | 69.6 |
| Mets | 75.5 | 80 | 78 | 76 | 66 | 76.8 | 74 | 73 |
| Yankees | 86.5 | 91 | 90 | 86 | 83 | 84.7 | 87 | 84.9 |
| Athletics | 84.5 | 83 | 86 | 84 | 78 | 85.3 | 85 | 94.6 |
| Phillies | 85.5 | 81 | 84 | 81 | 82 | 81 | 86 | 75.7 |
| Pirates | 77.5 | 80 | 77 | 81 | 77 | 74.8 | 79 | 92.1 |
| Padres | 73.5 | 76 | 78 | 76 | 73 | 72.7 | 81 | 76.1 |
| Giants | 87.5 | 85 | 85 | 92 | 87 | 85.1 | 88 | 75.2 |
| Cardinals | 82.5 | 85 | 86 | 83 | 85 | 85.1 | 90 | 94.6 |
| Rays | 86.5 | 87 | 88 | 86 | 88 | 89.5 | 93 | 89.2 |
| Rangers | 86.5 | 89 | 88 | 85 | 91 | 86.8 | 85 | 88.1 |
| Blue Jays | 88.5 | 84 | 78 | 86 | 94 | 87.5 | 82 | 73.8 |
| Nationals | 91.5 | 87 | 86 | 85 | 94 | 92.5 | 90 | 86.3 |
| Mariners | 77.5 | 78 | 79 | 73 | 74 | 74 | 78 | 71.4 |
What does MVP mean anyway?
By James O’Connor
What does it mean to be the Most Valuable Player in Major League Baseball? Is it the player who added the most wins to his team? The player who added the most wins to his team, so long as they made the playoffs? Can it ever be a pitcher? Is it the player who contributed the most to his team down the stretch?
Admittedly, MVP is always going to be a subjective award, based on the perception of the members of Baseball Writers Association of America selected, in any given year, to vote for the award. But modern statistics give us some insight into how those writers make their decisions—even if it is not entirely clear to them when they are voting.
First, let’s look at a few possible methods of selecting the MVP. Wins Against Replacement or WAR is a fairly recent statistical calculation that measures (words). It quite literally measures what player had the most valuable impact on his team in a given year. Yet, only five times in the past 25 years has the American League leader in WAR been awarded the MVP.
How about awarding the MVP to the highest WAR player on a playoff team? This may help. 21 of the previous 25 AL MVP’s were on teams that went to the playoffs (including for the purposes of this article, Frank Thomas, whose Chicago White Sox were in first place in the AL West in 1994 before the player’s strike ended the season). But even this doesn’t completely answer our question. Many of the players who won the award were not even the top WAR players on teams that made the post season. In 2006, Justin Mourneau won the MVP with a WAR of 4, while his teammate, Johan Santana led the league in WAR with 7.3 wins against replacement.
Some may argue that a pitcher should not be eligible for the award, anyway. This is where things get particularly tricky. One issue is that the voters change on a yearly basis. If a voter doesn’t believe a pitcher should not win the award, he can simply leave the pitcher off the ballot and doom his chances. See Martinez, Pedro, 1999. But the reality is, pitchers, do win the award on occasion. It has been posited that this honor is saved for pitchers only when they have had a truly transcendent and historic year. This theory is simply not backed up by the numbers.
In 2011, Justin Verlander was the AL MVP with a WAR of 8.2, good for second in the league. It was a truly awesome season by any measure. The league leader in WAR? You guessed it: Ben Zobrist. Zobrist carried an 8.5 WAR and his Rays made the playoffs. He finished 16th in MVP voting. You can’t entirely blame the writers for going with Verlander though. He was a monster.
Going back for a moment though, how good was Verlander’s year historically? Obviously, WAR is not set up to measure 2011 Verlander to 1999 Pedro Martinez, but the statistic does measure them against their competition for the award. Over the last 25 years, the following pitchers led the league in WAR, but did not win the MVP: Roger Clemens (1987, 1992, 1997), Brett Saberhagen (1989), Kevin Appier (1993), Randy Johnson (1995), Pedro Martinez (1999, 2000), Santana (2006), Zack Greinke (2009). In fact, Clemens’ 1997 campaign (11.8) and Martinez’s 1999 season (11.4), are the two best seasons as measured by WAR in the last 25 years. So, was Verlander’s 2011 season more deserving of the MVP? Probably not.

It’s not as if the MVP voters are picking completely randomly, though. In fact, over the last ten years, seven AL MVPs were in the top three in WAR. Of course, the other three (Mourneau, 2006; Vladimir Guerrero, 2004; and Miguel Tejada, 2002), were 10th or worse in the league in WAR. What happened and how did they win the MVP award?
A couple things to look at here. First, all three of those teams made the playoffs. That helps. As I mentioned earlier, despite the fact that Mourneau was not even first on his team in WAR, he was second to pitcher Santana, who undoubtedly lost votes based on the perception that pitchers should not win the award (however inconsistent this theme is, it’s impossible to ignore that it often does affect voting). Same story for Tejada in 2002, who was behind teammate Barry Zito (6.4) in WAR.
In 2004, the league leader in WAR was Ichiro Suzuki (7.5), whose team won 63 games. You can understand why the voters might not associate “valuable” with a team that lost 99 games. Guerrero took home this prize that year despite a WAR of 5.2, which was good for only 10th in the league. Likewise, in 2002, Tejada and his 5.3 WAR won the award over Alex Rodriguez and his 8.6 WAR. Of course, Alex’s Rangers won 72 games.
So, the argument against the WAR winners from those seasons makes (some) sense. Two played for dreadful teams, one suffered from anti-pitcher bias. But what about the rest of the players ahead of Mourneau, Guerrero and Tejada? This is where intangibles step in. The question in voters minds: Did you have a MOMENT?
Let’s look, for example, at Guerrero’s 2004 season. His OPS for the final month of the season was 161 points higher than his full season OPS. While his Anaheim Angels only went 17-14 over that stretch, they finished on a tear going 7-2 and slipping into the playoffs. While his full season WAR was not at the top of the league, it looked (probably accurately) like he single handedly dragged them into the playoffs in the end. He had a MOMENT. It was fresh in the voters’ minds and he got the MVP.
So is it a great September performance that puts a player on the top of the MVP head? Not necessarily. In 2006, Mourneau put up a beefy .926 OPS, but in the final month of the season his OPS was only .884. What gives? Mourneau’s moment was not the end of the season, but rather the eight week period in June and July when the world was really introduced to the Twins first baseman. In June and July, Mourneau put up 1.137 and 1.130 respectively. Meanwhile his team went 37-15, a win/loss percentage of .711. For the season, the Twins won at a .596 clip. Mourneau had eight weeks where he played his best ball while his team tore through the league. He had a MOMENT.
Ok, so what about Tejada? He must have had one stretch where he absolutely crushed it, right? Not really. Tejada had a relatively so start in 2002, but for the most part he was consistent throughout the season. His monthly OPS was as follows: .813, .807, .867, .910, .879, .888. Definitely stronger in the second half, but not the major swings of Guerrero and Mourneau. So what was his moment? You’ve read or seen Moneyball, right? Yea, the most memorable thing to happen in 2002 (probably even more so than who won the World Series), was the Oakland A’s 20 game winning streak from August 13 to September 4. In a season in which the A’s lost Jason Giambi (who, interestingly led the league in WAR the previous year, but did not win the MVP) and Johnny Damon, Tejada was widely considered the best position player on the most memorable team of the regular season. In other words, that winning streak? It was a MOMENT.
A statistics purist would, of course point out that if these players were more consistent like, say all of the people ahead of them in WAR, then they would not have needed these MOMENTS. Undoubtedly true, but also sort of missing the point. Baseball is a game of memories. Intangibles. It’s about that Oakland fan who will never forget for the rest of his life the run the A’s made in 2002 or the heroics of Vlad Guerrero seemingly dragging his team into the playoffs in 2004. Yes, Rodriguez and Ichiro had great years in 2002 and 2004, but chances are most people (their agents aside), would just as soon forget those seasons ever happened. They were the most valuable players for their teams, but they were not the Most Valuable Players for baseball.
MVP will always be a contentious issue. Lots of times it won’t make sense. I mean, who had more of a MOMENT then Pedro Martinez in 1999 or Roger Clemens’ “twilight year” of 1997? But perhaps, through all the fog, there is some semblance of a rationale for how the writers vote for this thing—whether they know it or not.
MLB Playoff Probabilities – 9/25/2012
The big move from last week is Detroit who jumps from a 23.3% to a 55.3% chance to make the playoffs. Moving in the opposite direction you have the White Sox who lost five game in a row at the end of last week including being swept by the Angels. This have dropped them from 88.2%, where they were on September 18, to 45.5% today. They also fell 4 spots in the rankings to number 11.
Philadelphia, after climbing to 6.1% last week, appears to be done with their hot streak as they drop back to 1.7% and are all but done.
Baltimore has more or less locked up a spot in the playoffs getting to 99.6%, which is made even more impressive since their run differential is currently -7 (Update: -11). How can you not root for these guys?
StatsInTheWild MLB rankings as of September 25, 2012 at 8:15am. SOS=strength of schedule
| Team | Rank | Change | Record | Projected Record | Prob make playoffs | SOS | Run Diff |
| NYY | 1 | ↑1 | 89-64 | 94-68 | 100% | 5 | +107 |
| Texas | 2 | ↓1 | 91-62 | 95-67 | 100% | 11 | +119 |
| Tampa Bay | 3 | ↑3 | 83-70 | 87-75 | 11.8% | 7 | +102 |
| Washington | 4 | ↓1 | 93-60 | 98-64 | 100% | 24 | +142 |
| LA Angels | 5 | – | 84-69 | 87-75 | 5.7% | 6 | +81 |
| Oakland | 6 | ↓2 | 86-67 | 89-73 | 73.2% | 8 | +72 |
| Baltimore | 7 | ↑1 | 88-66 | 92-70 | 99.6% | 4 | -7 |
| Atlanta | 8 | ↑2 | 88-65 | 92-70 | 100% | 19 | +89 |
| Detroit | 9 | – | 81-72 | 86-76 | 55.3% | 13 | +49 |
| Cincinnati | 10 | ↑1 | 92-61 | 96-66 | 100% | 30 | +85 |
| Chi WSox | 11 | ↓4 | 82-72 | 86-76 | 45.5% | 14 | +65 |
| SF | 12 | – | 89-64 | 93-69 | 100% | 26 | +68 |
| St. Louis | 13 | – | 83-71 | 85-77 | 81.9% | 29 | +100 |
| Seattle | 14 | ↑2 | 72-81 | 75-87 | 0% | 2 | -36 |
| Arizona | 15 | ↑3 | 77-76 | 80-82 | 0.1% | 25 | +46 |
| Boston | 16 | ↓1 | 69-85 | 72-90 | 0% | 3 | -34 |
| Toronto | 17 | ↓3 | 67-86 | 71-91 | 0% | 1 | -62 |
| LA Dodgers | 18 | ↓1 | 79-74 | 83-79 | 5.7% | 23 | +10 |
| Milwaukee | 19 | – | 79-74 | 82-80 | 10.6% | 28 | +41 |
| Philadelphia | 20 | – | 77-76 | 81-81 | 1.7% | 21 | +7 |
| Kansas City | 21 | – |
70-83 | 74-88 | 0% | 12 | -50 |
| NY Mets | 22 | ↑2 | 70-83 | 74-88 | 0% | 15 | -58 |
| Pittsburgh | 23 | ↓1 | 75-78 | 78-84 | 0% | 27 | -20 |
| San Diego | 24 | ↓1 | 73-80 | 76-86 | 0% | 22 | -48 |
| Minnesota | 25 | ↑1 | 64-90 | 68-94 | 0% | 10 | -122 |
| Miami | 26 | ↓1 | 66-87 | 69-93 | 0% | 16 | -101 |
| Cleveland | 27 | – | 64-91 | 66-96 | 0% | 9 | -176 |
| Colorado | 28 | – | 59-94 | 63-99 | 0% | 17 | -129 |
| Chi Cubs | 29 | – | 59-94 | 62-100 | 0% | 20 | -122 |
| Houston | 30 | – | 50-104 | 52-110 | 0% | 18 | -218 |
Past Rankings:
Cheers.
Chernoff faces (in the wild)
I took a multivariate class several years ago and towards the end of the semester the professor showed us Chernoff faces. I was thinking about them for some reason tonight, and so I figured I’d do a search for Chernoff faces on the internet. Here is an interesting application of Chernoff faces to MLB managers. This got me excited so I did a google search for “R faces” hoping to find an R package for Chernoff faces, however, this search yielded this web site. The headline on that web site says: “French rapper Monsieur R faces up to three years in prison and a 75,000-euro fine for referring to France as a ‘slut’ and a ‘bitch’ and saying ‘I piss on Napoleon and General de Gaulle’ on his latest album.” Not quite what I was looking for, but completely fantastic. God Bless the internet.
After another quick search, I downloaded this R Package. And now I’ve spent all night “Chern”-ing out Chernoff Faces.
Here is one for a few selected MLB hitters:

Here is one for a few selected MLB pitchers:

And here is my favorite about the economy (Data is from here):

I especially like how the Chernoff faces get smaller and actually appear to get sadder as the economy worsens. I guess it’s so bad that even Chernoff’s faces are feeling the recession.
Cheers.
