TIL: facet_grid edition
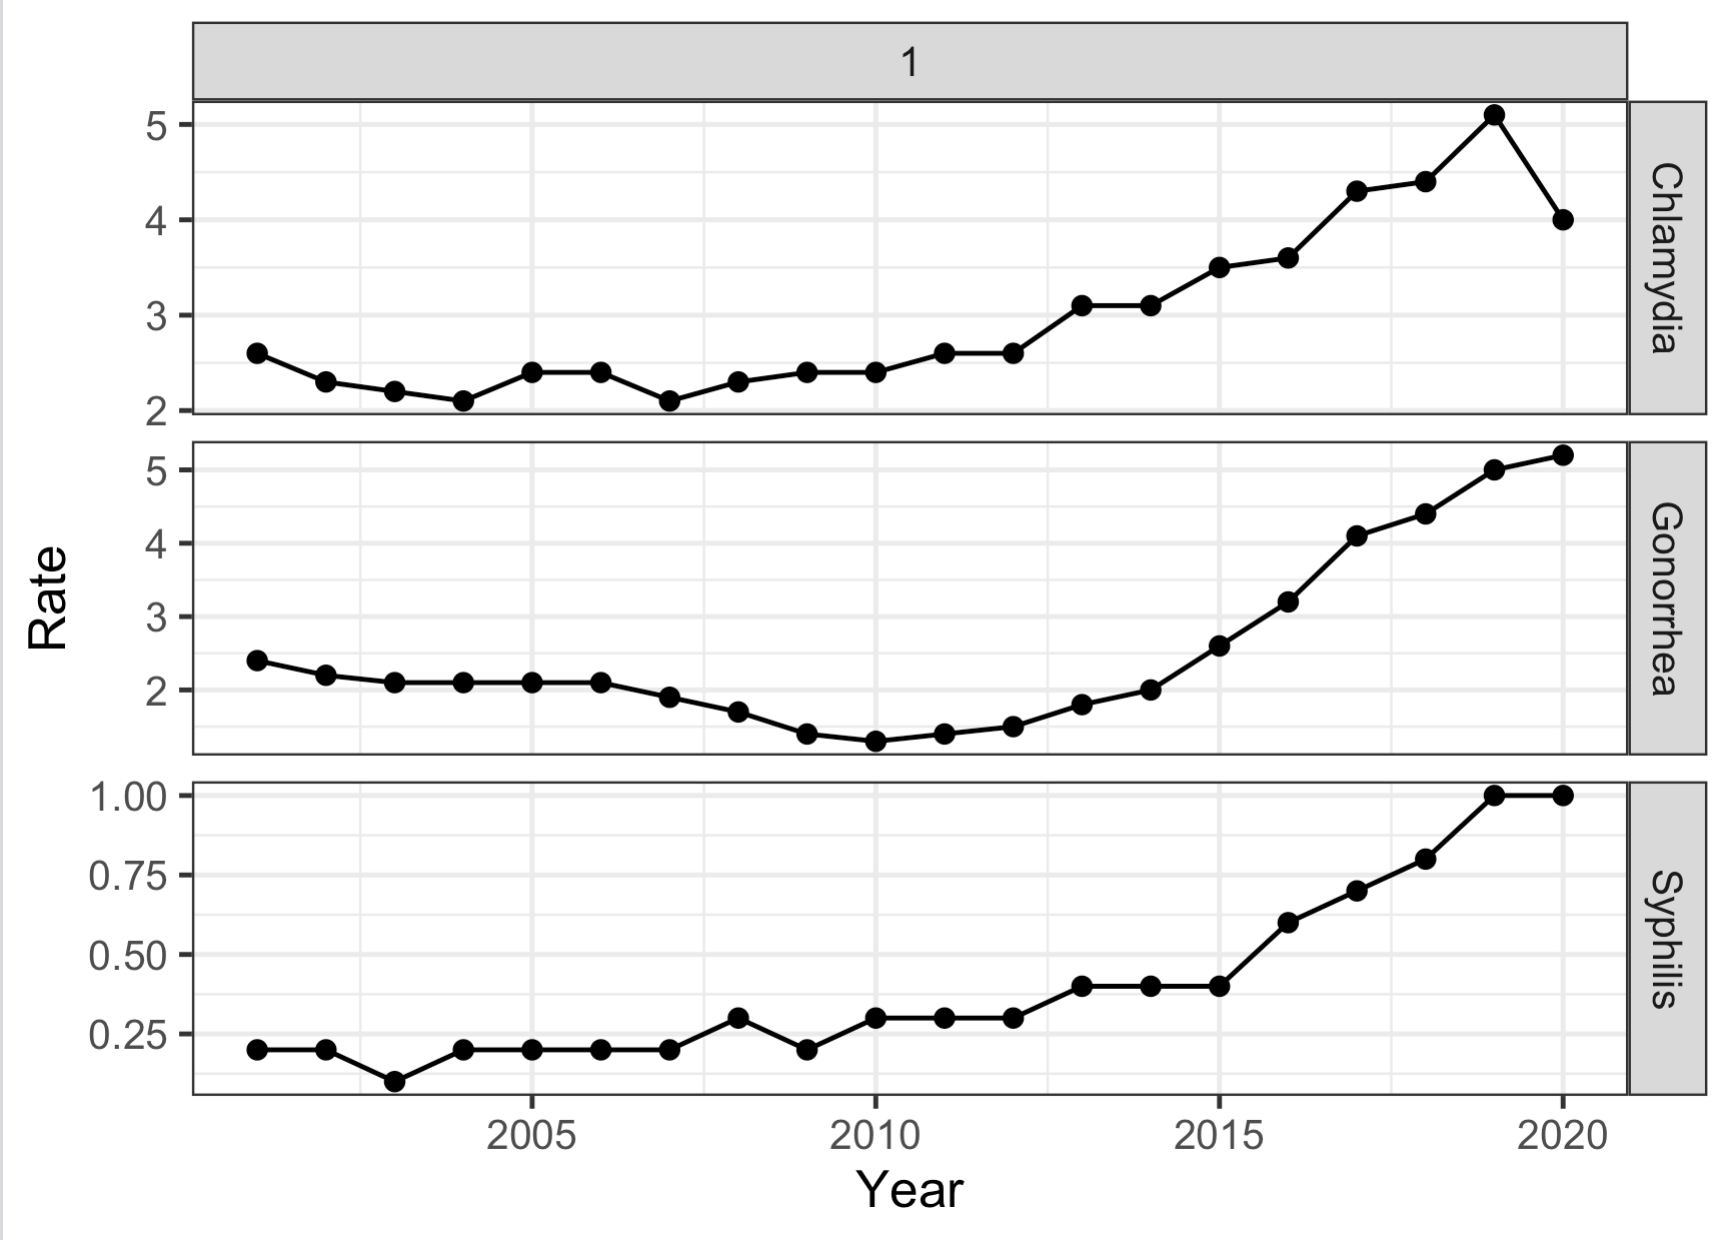
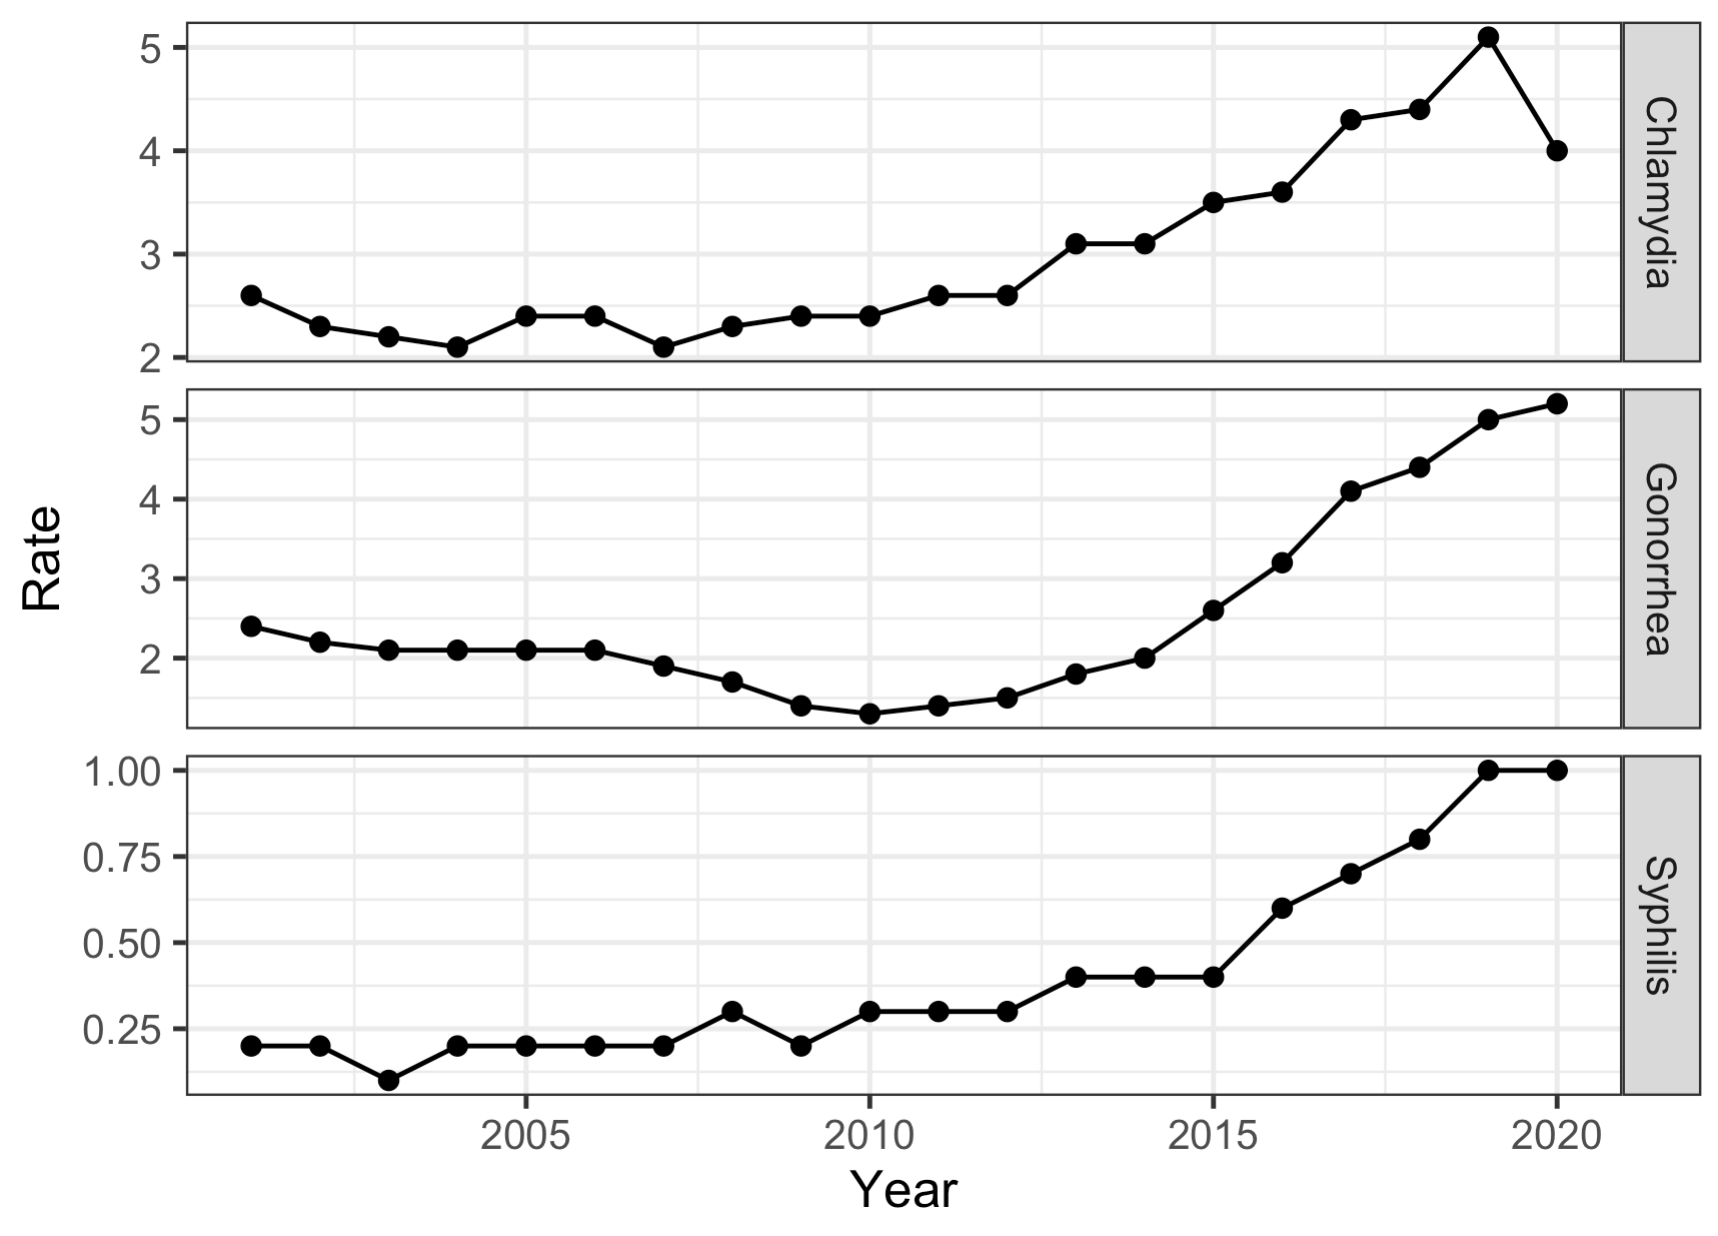
Today I learned how to get rid of the pesky “1” on the top of a ggplot facet_grid if I want to stack the plots vertically. Use facet_grid(rows = vars(group)). See my example below:
#Ugh. Why is there a 1?rbind(PSold %>% filter(Age == "65+") %>% mutate(STI = "Syphilis"), GCold %>% filter(Age == "65+") %>% mutate(STI = "Gonorrhea"), CTold %>% filter(Age == "65+") %>% mutate(STI = "Chlamydia")) %>% ggplot(aes(x = Year, y = Rate)) + geom_point() + geom_line() + theme_bw() + facet_grid(STI~1, scale = "free_y") #Get rid of the pesky 1 rbind(PSold %>% filter(Age == "65+") %>% mutate(STI = "Syphilis"), GCold %>% filter(Age == "65+") %>% mutate(STI = "Gonorrhea"), CTold %>% filter(Age == "65+") %>% mutate(STI = "Chlamydia")) %>% ggplot(aes(x = Year, y = Rate)) + geom_point() + geom_line() + theme_bw() + facet_grid(rows = vars(STI), scale = "free_y")
Cheers.
Posted on February 1, 2026, in Uncategorized. Bookmark the permalink. Leave a comment.

Leave a comment
Comments 0