Category Archives: Uncategorized
Guest Post: Buzzfeed, Box Office Grosses, and Bad Math
If the internet has done anything, and I’m not sure it has, but if it has it’s that it has glorified “Geek Culture;” to use a phrase I’m annoyed I even have in my brain. Back in the day, I had a certain amount of reservation talking as extensively as I wanted to about movies and TV, particularly the less “hip” movies (Star Wars and Monty Python and the Holy Grail), TV (Murder She Wrote) and words (“hip”). As such, now that it’s “Hip to be square” as Huey Lewis would say (I’ve lost all credibility now…). So I read articles like this, and decide to launch into internet tirades.
So what was it about that article that lead me to start tapping away? To be as succinct as possible (if anyone knows my writing, succinct isn’t how I roll) it was that it sucked. The article makes 12 comparisons that are supposed to make the geekier folks in the world be sad and upset. Buzzfeed has done it before, and it worked on me to a degree there, but this time I shout in reply a call that should always been on your lips- “LOGICAL FALLACY.” Logical fallacies are natural traps, and often are used not on purpose, but because the brain naturally wants to fall into them. There are three common fallacies that show up on this list- apples to oranges, ignoratio elenchi and the Texas sharpshooter. Every body knows apples to oranges; it’s the great party game. Wait, no it’s comparing two different, incomparable things. (from The Simpsons– Lenny: “Muhammad Ali in his prime was much better than anti-lock brakes.” Carl: “Yeah, what about Johnny Mathis versus Diet Pepsi?”) Ignoratio elenchi translates from Latin as “an ignoring of a refutation” but it means basically that an argument has come to irrelevant conclusions. If you know that all dogs bark and that all beagles are dogs, and from that you conclude that you should watch the movie Ghost Rider: Spirit of Vengeance, you have just committed ignoratio elenchi (and also made a horrible decision). The Texas sharpshooter comes from a joke about a Texan who shoots his gun at a barn and then paints targets over the bullet holes. In arguments, it’s when you take very specific data that support a claim you’re trying to make. It’s the Yankees giving Ichiro a $13m, 2 year deal after a hot September in 2012 following a cold April 2011 through August 2012 (I’d rather be watching Ghost Rider: Spirit of Vengeance than watching today’s Ichiro at the plate, yeesh!). In several entries, the facts that are so “depressing” are box office grosses. A few examples are Episode I made more money than Episode IV; Marky Mark’s Planet of the Apes out-grossed the original series combined; Transformers: Dark of the Moon is the sixth highest grossing film of all time. Mainly this is the Texas Sharpshooter hard at work. We have a theme we want to push (crappy movies out perform good movies) and then we find the facts that fit the argument.
The domestic gross of Phantom Menace is $474,544,677; domestic gross of A New Hope is $460,998,007. Hard to argue with that. Wait a minute, me- no it’s not. Phantom Menace has had two theatrical runs- it’s first in 1999 and the 3D re-release in 2012. A New Hope was released originally in 1977, and has had several re-releases since, the most recent being the 1997 special editions. You know what changed in those years? Movie ticket prices, inflation, tastes, Mark Hamill’s face. The Star Wars argument is a nice mix of Texas sharpshooter and apples to oranges.
Box office receipts are going to come up repeatedly on this list, but the basic fact is gross receipts are marketing tools for studios. They want to say “the number one family, christmas-themed movie in the box office last week was Christmas with Kranks” and James Cameron can prance about saying, “I have directed the top two, all-time grossing films, la di da.” (I know, my James Cameron impression is uncanny.) But in reality, what does it mean?
Let me show you something meaningful- Star Wars: A New Hope vs. Star Wars: The Phantom Menace. For the uninitiated, the estimate domestic ticket sales for the original Star Wars total 178,119,600, while the first prequel sold 90,312,100. This is going to make the rest of this entry shorter, but you can’t compare two movies released in different years based on their lifetime gross receipts- apples to oranges. Almost twice as many people bought tickets to see Episode IV than Episode I. If you’re sad about Phantom Menace out performing A New Hope, you’re actually just sad about inflation and the marginal price increases of theater tickets. So cheer up, I guess…
But wait, there’s more! Episode I was popular BECAUSE Episode IV was so popular (180 million tickets in the US, and that’s not even considering Empire and Jedi). The anticipation (not to mention marketing) that led up to the 1999 release of Phantom Menace guaranteed its success. It’s the same reason that The Matrix was out performed by the second two films. One made $170m, two made $280m, three made $200m. Part of this is inflation;The Matrix sold 33,755,900 domestic tickets, The Matrix Reloaded– 46,695,900 , and The Matrix Revolutions– 23,095,400. The sequels only earned their money off the sad sacks (myself included) who were excited and then disappointed by the films. To prove that point, consider that The Matrix made only 16.2% of its gross on opening weekend, while Reloaded was at 32.6%, and Revolutions 34.8%. Likewise, nearly half (15.2 million vs. 8 million) people saw the third film on opening weekend, which still ended up a higher percentage of total gross. The fact is that the sequels sucked and people learned their lesson and it showed at the box office. To me, that should reassure geeks- people learned (just like RAPTORS!)
The remarkable thing is the first movie, only the second film directed by the Wachowskis, who would go and give us almost nothing else worth watching, made such a good movie as The Matrix. Unless you count Speed Racer. Which I don’t, because it sucked too.
And that opening day weekend nonsense is also marketing. Not long ago, lifetime grosses were important. Often, movies opened on few screens, and an audience was built up by word of mouth. Looking back at the Star Wars boxoffice mojo numbers, it opened on 73 theaters. It’s “wide” release was 757 theaters. And it’s largest number of screens during its original run was 1750. This is why the Indiana Jones ‘fact’ is galling. Of course the crapfest that is Indy 4 outgrossed the three good movies on opening weekend. Here’s a handy chart:
| Movie | Opening Weekend Release (Theaters) | Opening Weekend Ticket Sales | Overall Ticket Sales | Opening Weekend % of Total Sales | Price of a Movie Ticket That Year | Inflation Adjusted Opening Weekend | Is This a Good Movie |
| Raiders of the Lost Ark | 1078 | 2,987,700 | 77,239,100 | 3.87% | $2.78 | $21,451,686 | Holy crap, yes |
| Temple of Doom | 1687 | 7540800 | 53,5328,00 | 14.09% | $3.36 | $54,142,944 | Solid, but third best |
| Last Crusade | 2327 | 7,394,200 | 49,416,500 | 14.96% | $3.97 | $53,090,356 | Connery. |
| Kingdom of the Crystal Skull | 4260 | 13,946,800 | 44,164,500 | 31.58% | $7.18 | $100,138,024 | Even if I only paid $7.18, I was robbed |
So, yeah, KotCS earned more opening weekend, but what does that mean? A third of its take was on opening weekend and it was in FOUR TIMES the theaters as Raiders. Also, like the time GWB gave Angela Merkel a shoulder massage at a G8 meeting, everyone wishes they never saw it in the first place.
5. The Resident Evil movies have made far, far more money than the Resident Evil video games.
According to the article, the movies have made a total of $674,764,589, while the games have made $36,290,000. So just another false equivalency. I have played no RE game and watched no RE movie, so I can’t speak on the merit of one over the other. I can say that according to VG Chartz the RE video game franchise has sold just under 24 million units of games in North America. And if you look at ticket sales for the five (holy crap!) (1, 2, 3, 4, 5) RE movies, you see that 35.4 million domestic tickets were sold to the films.
My math also says that 24 million games sold should be a higher gross sales than $36.3 million. If I have to shell out $60 just to play a game on my PS3 that I forget I own and never finish, I can’t believe the Resident Evil franchise is averaging $1.50 per game.
Additionally, much like the box office numbers are really a marketing tool for movie studios, look at each of the RE movies foreign vs domestic take. These are movies that are not made for American audiences. RE 1 had 60.8% of its gross from overseas, 2 had 60.4%, 3 had 65.7%, 4 had 79.7%, and 5 had a whopping 82.4% (for a total of $197.8 million in 2012 bucks. Someone should let me make Resident Evil and release it in Europe and Asia. I can retire from writing 3000 word essays about Buzzfeed entries that annoy me by misapplying math and facts. OR FOCUS ON IT!) Maybe Milla Jovovich’s Ukrainian family is just really huge and they’re just supporting little Milla.
3) Firefly lasted one season, and had terrible ratings.The Big Bang Theory is in its sixth season, and has incredible ratings.
Here is a combination of the Texas sharpshooter as well as ignoratio elenchi. The graphic on Buzzfeed says Firefly had one season, averaging 4.5 million viewers, and Big Bang Theory has six season (and counting), with an average of 19 million viewers.
There are about twleve dozen mitigating factors- Firefly was an hour-long drama, BBT is a traditional three-camera sitcom (the very definition of traditional). Firefly was on FOX, a channel notorious for canceling shows with dedicated followings, while Big Bang Theory is on CBS (not to mention like seventeen other channels in syndication). BBT does not average 19 million viewers, though it did approach that in its sixth season. It’s viewership trend has been increasing since it first debuted (it averaged 8.31 million per episode in season one). Firefly was also aired on Fridays and broadcast out of order, despite having a overarching story that spanned all of the episodes.
All that being said, I don’t think you need to run market analysis to figure out there will be a heck of a lot more viewers for a broad sitcom with quirky characters, airing on a network that has popular shows to lead-in and follow it than a western/space drama on a network that was last place during the 2002 fall sweeps. In the entire 2002 season , FOX had only two shows in the top 30, American Idol and Joe Millionaire. I invite you to read that sentence again if you want to feel dirty.
And finally, the last entry on the list is the most galling. This is our big apples to oranges one, not to mention the mind numbing corruption of facts. Hold on to your butts if you care a lick about the following: facts, numbers, reason, logic, not wanting to stab yourself in the face.
12. M. Night Shyamalan’s films have made more money than Joss Whedon’s films.
Yep. Let that one sink in, while I dunk my head in a toilet to make myself feel cleaner.
There are a number of problems with this. The basic facts are, through June 17, 2013, Joss Whedon’s films have an adjusted domestic gross of $641,316,200 and M. Night Shyamalan’s films have an adjusted domestic gross of $1,356,193,700. That is indisputable. But you’re comparing the gross of Joss Whedon’s three films (which includes his latest, Much Ado About Nothing, which currently is screening in five- yep, FIVE- theaters…) to M. Night’s nine movies (which, to be fair, includes Wide Awake, which made it into 43 theaters in 1998). To compare the numbers on these two fellas’ filmographies is like saying “How sad is it that a great hitter like Mike Trout, a good guy and one of the brightest stars in all of baseball has hit 334 fewer home runs than All-Time Jerk and General Ne’er-do-well Albert Belle.” And then Albert Belle would hit you with a bat for calling him names.
But hold on, I hear the whole planet saying, “We’re pretty sure Joss Whedon had a pretty big hit that earned scads of cash. You know, that one with Sean Connery and Uma Thurman and Ralph Fiennes.” And I say, calm down, planet earth- you’re thinking of the late 90’s The Avengers, the remake of the 60’s TV show. You’re close, but he directed 2012’s Marvel’s The Avengers, which made $1.5 billion worldwide and $623, 357,910 in 2012 money. Looking back at M. Night’s list, you’d be hard pressed to find any two movies (or even three, if you’re inclined to do that much adding) that can (in adjusted dollars) meet The Avengers. And The Avengers didn’t have a crazy M. Night Twist!
I’ll end by circling back to the claim about Transformers 3: The Absence of the Racist Cars being #6 on the all-time highest grossing list. What’s remarkable about this list is that you have to go to #18, Jurassic Park, to find a movie made earlier than 1997’s Titanic (and all three of the 90s movies in the top 20, #2 Titanic, #18 Jurassic Park, and #13 Episode I, all had 3D re-releases in the last two years.) In the top 40, Lion King (which also has a recent 3D rerelease) at #21, and #38 Independence Day round out the only pre-2000 releases. In the top 100, only three films from before 1990 appear (#41 ET, #44 Star Wars, and #100 Empire Strikes Back). So of the all-time top 100 all-time highest grossing films of all time, 97 are from the last 20 years (1993’s Jurassic Park is the oldest movie after ET). How can this be?
In a 2002 edition of Issues in Political Economy, “The Decline in Average Cinema Attendance 1930-2000” , Michelle Pautz of Elon University (it’s a real school, I looked it up) wrote about the change in movie-going habits. In 1930, 65% of Americans went to the movies once a week. In 2000, it was 9.7%. Additionally, in 1930, a ticket price was $0.25, which in 2012 dollars is $3.48. A 2012 movie ticket price was $8.12. So inflation doesn’t even cover the difference in movie grosses. So, much like comparing Whedon’s ouevre to Shyamalan’s, or Trout’s dinger output to Belle’s, the comparison is inappropriate and completely invalid. Without an adjustment, you’re comparing the Coolidge administration to central air conditioning- it can’t be done (Silent Cal did preside over one of the greatest periods of American prosperity, but he ain’t helping me come July)
This is the all-time adjusted gross list. As pointed out in probably a skajillion places, but well enough in the New York Times’ “Economix” blog by David Leonhardt, who, in March 2010, pointed out, things look a bit different from the reported list we normally see. Yes, as Leonhardt says, it’s domestic only because older movies don’t have great sales data for foreign releases. But this makes more sense, doesn’t it? A more representative mixture of crappy blockbusters from every era (Cleopatra, Grease), instead of just the crappy blockbusters from after I finished 7th grade. The fact that Mama Mia! or The Twilight Saga: Breaking Dawn 2 Electric Boogaloo don’t show up on the all-time is reassuring, but besides the point. It’s just applying math correctly.

But you won’t hear this on the TV or radio or the internets all that often, because when Johnny Depp is out pimping The Lone Ranger this month, it’s easier for the media and better for Disney to talk about the billions of dollars his Pirates series and Alice in Wonderland made, or that he is in four of the top 20 grossing movies of all time. And James Cameron looks better while prancing about, saying he’s got the #1 and #2 movies of all time, instead of being intellectually honest by saying he has the #5 and #14 (which, btw, is still awesome for him, especially since one movie is a super long suckfest and the other movie is a super long suckfest). But who will stand up for the inflation-adjusted success of Doctor Zhivago? Omar Sharif? He’s too busy with bridge. Without PR (and why does a 50 year old movie need PR?) or a good narrative, there is little reason for your average Joe-box-office-receipt-watcher to realize he’s being duped by shoddy math and incomplete context. Now, with that, I shall go curse Buzzfeed for reminding me I saw Lady in the Water in theaters.
This post was written by Tim.

Beamer, Sweave, and RStudio
If you’re going to use a Schunk in a beamer slide, make sure you open the slide with \begin{slide}[fragile]. I kept leaving out the “fragile” part and getting an error. Hopefully this post will save someone out there some time in the future.
Cheers.
“Nothing to hide, Nothing to worry about”: A Human Rights Issue
I was reading Flowingdata.com this morning and the blog post at the top of the page was about privacy. Nathan Yau says:
With all the stuff going on with surveillance and data privacy — especially the past week — it’s worthwhile to revisit this essay by Daniel J. Solove, a professor of law at George Washington University, on why privacy matters even if you “have nothing to hide.”
So, I went and read that article where they talk about the argument “nothing to hide, nothing to worry about.” It seems obvious to me that this argument is weak, but in case you need some quick counter arguments, here is a list of response from that article:
- My response is “So do you have curtains?” or “Can I see your credit-card bills for the last year?”
- So my response to the “If you have nothing to hide … ” argument is simply, “I don’t need to justify my position. You need to justify yours. Come back with a warrant.”
- I don’t have anything to hide. But I don’t have anything I feel like showing you, either.
- If you have nothing to hide, then you don’t have a life.
- Show me yours and I’ll show you mine.
- It’s not about having anything to hide, it’s about things not being anyone else’s business.
- Bottom line, Joe Stalin would [have] loved it. Why should anyone have to say more?
These are all great counter arguments to the “nothing to hide, nothing to worry about” argument, but I’d like to add another: Privacy is a basic human right. I realize that sounds dramatic, but go read the Universal Declaration of Human Rights for yourself.
Article 12: No one shall be subjected to arbitrary interference with his privacy, family, home or correspondence, nor to attacks upon his honour and reputation. Everyone has the right to the protection of the law against such interference or attacks.
And why are human rights important? From the preamble:
Whereas recognition of the inherent dignity and of the equal and inalienable rights of all members of the human family is the foundation of freedom, justice and peace in the world.
So, according to the United Nations, one of your basic human rights is your right to privacy, and human rights are the foundation of freedom, justice, and peace. That’s a big deal. A really big deal. Let me repeat this one more time: Your privacy is a big deal.
The UN does add the caveat of “arbitrary interference” because of course there are situations where you lose the right to privacy. So what does arbitrary mean? Just to be sure I looked up the definition. Google returns two definitions. The first is “Based on random choice or personal whim, rather than any reason or system” and the second is “(of power or a ruling body) Unrestrained and autocratic in the use of authority.” From what little I have read about the NSA privacy stuff, it sounds like these definitions are describing exactly this situation. The “51% sure” that a person is foreign sure sounds a lot like “personal whim” to me. Whether or not this data collection is an “arbitrary interference” is a debate that we need to have as a society. Where is the line?
The issue of privacy and where this line is is particularly interesting to me because when I was in graduate school I wrote my dissertation on statistical disclosure control. This involves attempting to balance the dissemination to researchers of useful data against the privacy of the individual. In terms of what I was studying, the benefit of data dissemination is useful research, often on topics of public health, whereas in the NSA situation the alleged benefit is in fighting terrorism. In both cases, the risk is the erosion of individual privacy. In public health neither extreme is an acceptable solution. Either you release none of the data and you have perfect privacy at the cost of halting scientific research, or you release all of the data to anyone who wants to use it for research (or any other purpose!) and you achieve maximum utility at the cost of total lack of privacy. Some balance between these two must be struck. I think it’s probably the same with the NSA and the government: Some balance must be struck between fighting terrorists, who are a real and legitimate threat, and the ideals that we have as citizens of the United States and as human beings.
One of the difficulties in having this debate, and again I’ll make a comparison to my research, is that quantifying utility and privacy in many situations is very difficult. This makes it hard to really quantify the costs and benefits associated with decisions on where to draw the line when releasing data to researchers. This is likely even more difficult to quantify with what the NSA is doing. If we could easily measure how much terrorism is prevented versus how much privacy we are losing, society could have a debate and reach some sort of conclusion. But we don’t have these measures. (One potential way to measure terrorism would be in attacks prevented, but it’s virtually impossible to do this with any accuracy. And measuring privacy might be even more challenging.) If this were an economic problem we could weigh the costs versus the benefits on some monetary scale. If this were drug testing we would weigh the benefits of the drug versus the side-effects. But in this situation there is no clear way to measure either of these concepts in an objective way, and even if we could, everyone has a different idea about where the bar should be set.
So ultimately, as a society, we’re in a situation where we need to have a debate about privacy protection versus terrorism prevention where both sides have important concerns that are often in conflict with one another. We need to decide where to tip the scale so that we balance these two things in a meaningful way that respects our American and international ideals of freedom, justice, and peace. But we need to do this without using any objective scale. It’s a an extremely difficult problem and it’s just going to get more complicated as we move further into a world dominated by data.
Cheers.
The most surprising numbers from the Bruins sweep of the Penguins
This is incredible: “Crosby had never been held without a point in any four consecutive NHL games, regular or postseason, until the Bruins series.”

Some quick notes to wrap up the Boston Bruins’ recent sweep of the Pittsburgh Penguins. Boston held Pittsburgh stars Sidney Crosby and Evgeni Malkin off the board, while as a team, the Penguins managed just two goals in four games (all data taken from hockey-reference.com).
1- Penguins star Sidney Crosby was held without a point in four games. Here are Crosby’s longest scoreless game streaks in his NHL career
05-06: 3 games
06-07: 3 games
07-08: 1 game
08-09: 3 games
09-10: 2 games
10-11: 2 games
11-12: 2 games
12-13: 1 game
In other words, Crosby had never been held without a point in any four consecutive NHL games, regular or postseason, until the Bruins series.
1a) In the 2008-09 season, Crosby went three games without a point in the final three games of the Stanley Cup finals against Detroit. That streak should come with an asterisk, as Crosby was…
View original post 453 more words
Top 25 MLB Pitchers – June 7, 2013
Updated June 7, 2013 at 12:34am
Total Prevention is a measure of runs prevented weighted by the number of batters they have faced (Higher is better).
Yearly Expected ER is approximately the expected number of runs that a team would allow is that pitcher pitched every inning of every game for a team (Lower is better).
|
Top 25 MLB Hitters – June 7, 2013
Updated June 7, 2013 at 12:34 am.
Yearly Production for a player is the approximate number of runs a team would score if the entire lineup consisted of the same player.
Total Production is weighted by the number of plate appearances.
|
MLB rankings – 6/7/2013
StatsInTheWild MLB rankings as of June 7, 2012 at 2pm. SOS=strength of schedule
| Team | Rank | Change | Record | ESPN | TeamRankings.com | SOS | Run Diff |
| St. Louis | 1 | ↑2 | 39-12 | 1 | 1 | 24 | +40 |
| Cincinnati | 2 | ↑3 | 36-24 | 3 | 7 | 20 | +29 |
| Boston | 3 | ↓2 | 37-24 | 4 | 2 | 9 | +23 |
| Texas | 4 | ↑3 | 36-23 | 2 | 3 | 22 | +21 |
| Pittsburgh | 5 | ↑3 | 35-25 | 6 | 12 | 17 | +25 |
| Detroit | 6 | ↑4 | 32-26 | 8 | 9 | 21 | +24 |
| Tampa Bay | 7 | ↑8 | 32-27 | 12 | 8 | 7 | +28 |
| Oakland | 8 | ↑6 | 37-25 | 7 | 5 | 15 | +4 |
| Baltimore | 9 | ↓5 | 34-26 | 9 | 11 | 6 | +17 |
| Atlanta | 10 | ↓4 | 37-23 | 5 | 4 | 30 | +22 |
| Arizona | 11 | ↓2 | 34-26 | 11 | 10 | 23 | +3 |
| NY Yankees | 12 | – | 35-25 | 10 | 6 | 5 | +7 |
| Colorado | 13 | ↓11 | 32-29 | 15 | 14 | 25 | +8 |
| Cleveland | 14 | ↑5 | 30-29 | 13 | 13 | 12 | +17 |
| SF | 15 | ↓4 | 31-28 | 14 | 15 | 18 | +6 |
| Kansas City | 16 | ↓3 | 25-32 | 24 | 20 | 8 | +1 |
| Minnesota | 17 | – | 26-31 | 21 | 18 | 16 | -2 |
| Toronto | 18 | ↑8 | 25-34 | 26 | 16 | 1 | -10 |
| Chi Cubs | 19 | ↑4 | 24-33 | 23 | 23 | 10 | -1 |
| San Diego | 20 | ↑4 | 28-32 | 17 | 21 | 19 | -12 |
| LA Angels | 21 | ↑7 |
26-34 | 18 | 25 | 11 | +2 |
| Washington | 22 | ↓2 | 29-30 | 16 | 17 | 28 | -24 |
| Chi WSox | 23 | ↑2 | 25-33 | 20 | 26 | 13 | -13 |
| Seattle | 24 | ↑3 | 26-35 | 25 | 22 | 4 | -28 |
| Philadelphia | 25 | ↓7 | 31-30 | 19 | 19 | 29 | -13 |
| Milwaukee | 26 | ↓10 | 22-37 | 28 | 27 | 3 | -35 |
| LA Dodgers | 27 | ↓5 | 26-33 | 22 | 24 | 14 | -28 |
| Houston | 28 | ↑1 | 22-39 | 29 | 28 | 2 | -24 |
| NY Mets | 29 | ↓8 | 23-33 | 27 | 29 | 27 | -42 |
| Miami | 30 | – | 16-44 | 30 | 30 | 26 | -45 |
Past Rankings:
Some polite comments on Mac Engel’s article “Mathematics is not a friend of baseball”
Perhaps Mac Engel is a brilliant satirist or perhaps he is just trying to get people to pay attention to him.
As a statistician, I’m going to make an assumption (that’s what us stats guys do), and I’ll start by assuming that Engel is indeed sincere in his belief that “Mathematics is not a friend of baseball” in his article of the same title. Assuming this is true, it seems clear to me that he doesn’t really have any idea what he is talking about.
Engel’s article opens with some jokey, over-the-top claims about math in sports (number-crunching will ruin your kid’s dodgeball game!). But his overall point appears to be in earnest. In his second paragraph (if you can call anything in this a paragraph; it’s more collection of individual sentences) he says (emphasis added):
Scores of math whizzes, nerds and live-in-their-parent’s-basement geeks are threatening to turn Royals at Rangers into a Bobby Fisher vs. Boris Spassky chess match, minus the intellect.
This sentence demonstrates clearly that Engel does not understand the nature of statistics today and how they are applied to baseball.
First, the phrase “live-in-their-parent’s-basement geeks” is being used derogatorily here to indicate that statisticians are losers unable to function in society, and are thus relegated to their parents’ basements because of their personal and professional failures. This was my first indication that Engel has no idea what he’s talking about. These “live-in-their-parent’s-basement” geeks surely exist , but in today’s world these geeks more often come in a different variety: the employed-in-a-recession-six-figure-income kind. (There’s also the rock-star-stats-geek like Nate Silver, who is more important to the New York Times’ website traffic than most of its regular journalists.) While journalism jobs are rapidly disappearing, jobs based on data are expanding so rapidly that there are not enough people with the skills to fill these positions. Nearly all of the successful businesses in the world know the value of data (see: Book, Face) and you can argue that one of the big differences between Obama and Romney in the last election was how the two campaigns handled, managed, and took action based on data and analysis (Obama embraced it, Romney largely ignored it; how did that work out?). The point is, the best way to make decisions is when those decisions are based on data and appropriate analysis. Baseball is a game where many decisions must be made, and those decisions can best be made when they are aided by data.
Secondly, Engel seems to fail to grasp a major difference between chess and baseball: chess is deterministic; baseball is not. Every time a chess player moves Bg5, the bishop gets there with certainty, whereas in baseball, not every routine fly ball will get caught (and sometimes they bounce off your head and go over the fence). He correctly notes that this uncertainty is what makes baseball exciting. As he says: “Math is never wrong. Baseball very much is, which is why I love it.” I’m not sure exactly what he means by “math is never wrong,” but when he says “baseball very much is,” I assume he is implicitly referring to random event outcomes. And this is precisely why math, specifically statistics and probability, is useful in making decisions in baseball. Statistics and probability give us a principled way to quantify uncertainty about events that have occurred in the past and events that will happen in the future. Statistics can’t say what is going to happen on any given play with certainty (e.g., Miguel Cabrera will hit a home run in this at-bat), but it can help someone to make statements about how likely an event is to occur (e.g., Miguel Cabrera is more likely to hit a home run in an at-bat than Norichika Aoki). And just because we can’t say with certainty what will happen on any given trial doesn’t mean that it isn’t useful. There are entire companies that exist based on events that might only occur 1 in 1000 times (think click-throughs on an ad, or responses to fake Viagra emails).
So what numbers and maths are specifically ruining baseball in the opinion of Engel? Is it the often cited and complicated wins above replacement (WAR) statistic? Nope. Is it the opaque Ultimate Zone Rating (UZR)? No, not that either. The entire rest of the article is about how math has ruined the game and made us a “prisoner to all of these bleepin’ numbers,” and his example is: PITCH COUNTS!
Pitch counts are an example of math in baseball in the same way that page numbers are an example of math in literature. If you think numbers and math are ruining baseball, which I disagree with thoroughly, I’m sure you can make a reasonable argument, but you need to be more persuasive than talking about pitch counts. There is a reason the Oakland A’s won all those regular season games with their tiny payroll, and it wasn’t simply luck. They were making better decisions that everyone else at the time because they were using data in a better way than their opponents, and it gave them an advantage in the long run.
So what I’m trying to say is that math and statistics aren’t ruining baseball. Now if you’ll excuse me I’ve got to go do the dishes. I can hear my mother yelling at me from upstairs.
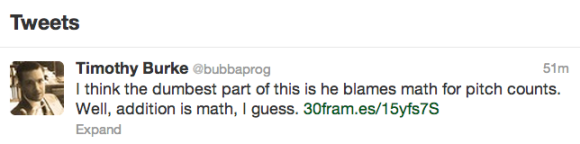
Bill Barnwell is still blocking me on Twitter
I’m still blocked from following @BillBarnwell on Twitter. But what I don’t quite understand is what is the point of blocking anyone if your account is public? I’m blocked from following him, but I can still read all his tweets because his account is public. So, what do you gain by blocking someone? There must be some benefit to it? Is it just that I can’t direct message him? 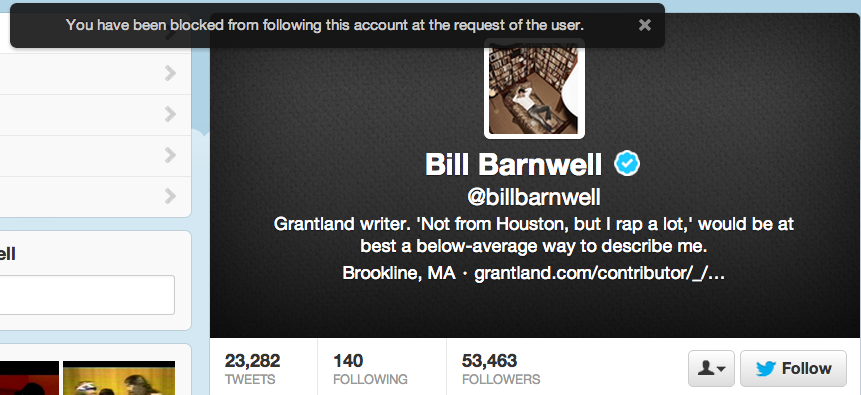
Cheers.
