NFL 2015: Just slightly below average or the year of the right skew
My friend sent me an email today commenting that there were a lot of mediocre NFL teams this year, and I think I read something somewhere that said there are more teams at or below .500 at this point in the season than in any year since 1990. So this got me thinking about some posts that I had written in like 2009 about entropy in the NFL (here and here).
I don’t really like the way I did them back then, so I did them differently today. What I did today was take the counts of wins for each team and did a goodness of fit test or a contingency table with probability 1/# of NFL teams for each cell. This is assuming that the the counts of the wins for NFL teams are randomly distributed across teams across the league. Below is a Manhattan style plot (like those used in GWAS) displaying the -log(p-value) for the league for each year from 2000 through 2015. Since, we are currently in the middle of 2015, I extrapolated win totals based on current win percentages (I don’t think this is great, but I’ll update it at the end of the season with the full results). What you can see is that 2015 is the only year with a p-value below the magical 0.05 level. (Of course, correcting for multiple tests with Bonferroni renders all of these tests insignificant).
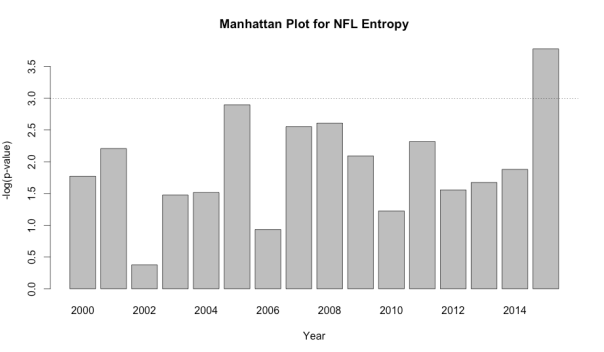
The next closest year was 2005, which was a very strange year. Only one team finished 8-8 (3.8 teams on average) and the distribution of wins for teams was essentially bimodal. You were either a pretty good team or a pretty bad team, but mediocrity was hard to come by in 2005. What’s so different about 2015 is that the rejection of the null hypothesis this year seems to be being driven by the large number of slightly below average teams (Dolphins, Colts, Texans, Chiefs, Raiders, Giants, Washington Football Team, Eagles, Bears, Buccaneers, Saints, Seahawks, and Rams) and a few teams that are very, very good (Bengals, Patriots and of course the 9-1 Panthers.) On the other end of spectrum was 2002 when it seemed like every team in the league was 9-7, no team won 13 or more games (only other time that has happened since 2000 was last year in 2014), and every team won at least 2 games.
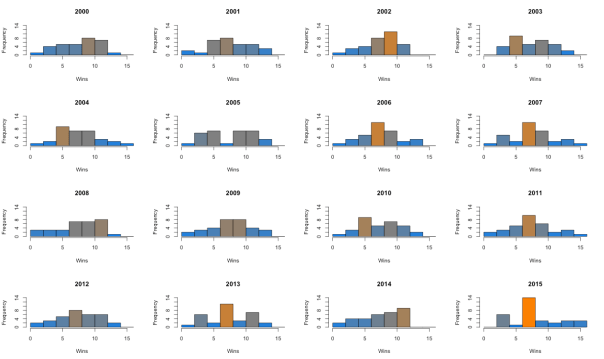
The plot below shows histograms for the distribution of win totals. Orange boxes indicate a higher count in that bin and blue indicates a lower count. (Note: 2015 win totals are extrapolated). Just take a look at the distribution of 2015! So many teams are just slightly below .500, which is distinctly different from any other year since 2000. I suspect that as the season finished, this shape we are seeing will diminish somewhat, but I think the general trend is interesting (I mean we are in week 11 right now).
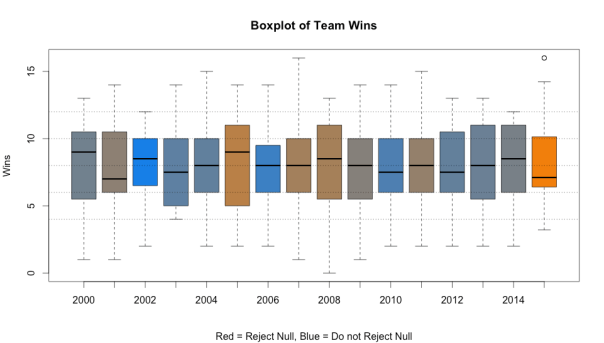
Finally, I made some side by side boxplots (because I love them) to look at the distribution of team wins across season. Orange boxes are related to small p-values (i.e. significantly different than the null hypothesis) and blue boxes correspond to large p-values. Here the win totals for 2015 are not extrapolated and……

I re-created the boxplots with 2015 win totals extrapolated.
In conclusion, 2015 is a weird year in the NFL.
Cheers.
Posted on November 22, 2015, in Uncategorized. Bookmark the permalink. Leave a comment.

Leave a comment
Comments 0