Blog Archives
Some thoughts on this election and the polls.
So someone pointed me to this article, “Weaponized Polling Is More Dangerous Than Ever” where the author argues that right leaning pollsters (or “pollsters”) are conducting polls that intentionally make Trump look like he’s in a stronger position than he is. (The author goes on to offer what I consider to be compelling reasons why they are doing this.)
But I wanted to check this for myself. So, I went and got the poll data from fivethirtyeight.com (Click here to download the latest polling data from fivethirtyeight as a .csv file). Fivethrityeight also includes grades for each of the pollsters based on past performance.
The lowest rated polls in fivethirtyeight are:
- McLaughlin – 0.5
- Peak Insights – 0.6
- Research America – 0.7
- The Political Matrix/The Listener Group – 07.
- Trafalgar Group – 0.7
- Hendrix College – 0.9
- Tulchin Research – 0.9
On the other end of the spectrum, fivethirtyeight gives only 8 pollsters their top grade of 3: ABC/Washington Post, Marquette Law School, McCourtney Institute/YouGov, Siena/NYT, The Washington Post, YouGov, and YouGov Blue. Many of the top University polls have just slightly lower ratings like Emerson, Marist, Suffolks, UMass – Lowell (all 2.9 out of 3). In total, there are 158 polls with 80 of them rated 2.0 or higher.
So what I want to look at is how the polls of different quality score the race right now. So here is what I did (with Pennsylvania as an example): I took all the polling data and and removed “duplicate” polls (I don’t quite understand why 538 seems to have these duplicates in their file, but there are records in the data that look exactly the same to me except for the percentage. So, I included only one of these records when there were multiple. If anyone can explain the difference in these records to me, I’m all ears). I then only kept polls consisting of “likely voters”. I then took all those polls over a certain period of time and combined all the polls over these period of time to come up with one single estimate for each candidate (basically mini meta-analysis). I then computed these estimates by filtering on a range of polling grades (i.e. 0.5-1.5, 1-2, 1.5-2.5, 2-3) and I plotted these estimates (with fun little error tails), on a plot. Here is Pennsylvania for August, September, and October, and then September and October pooled together at the end:
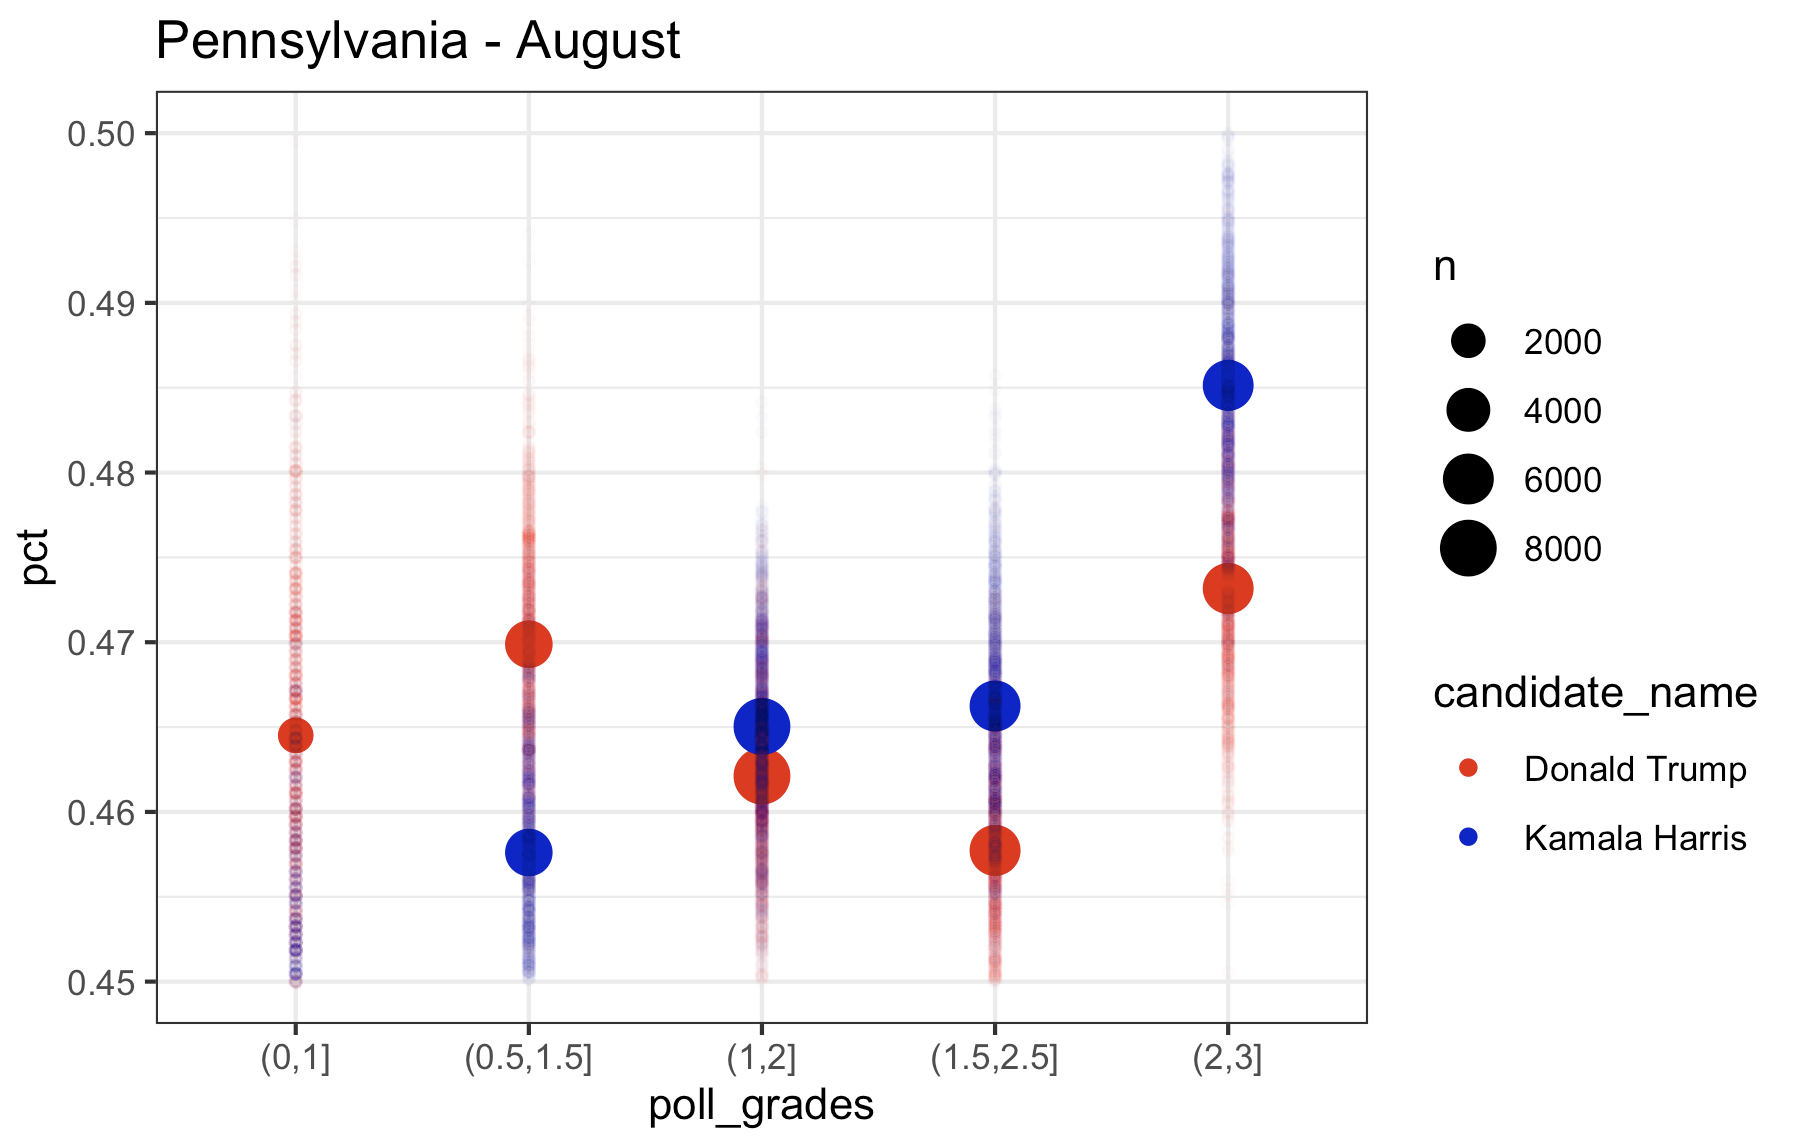
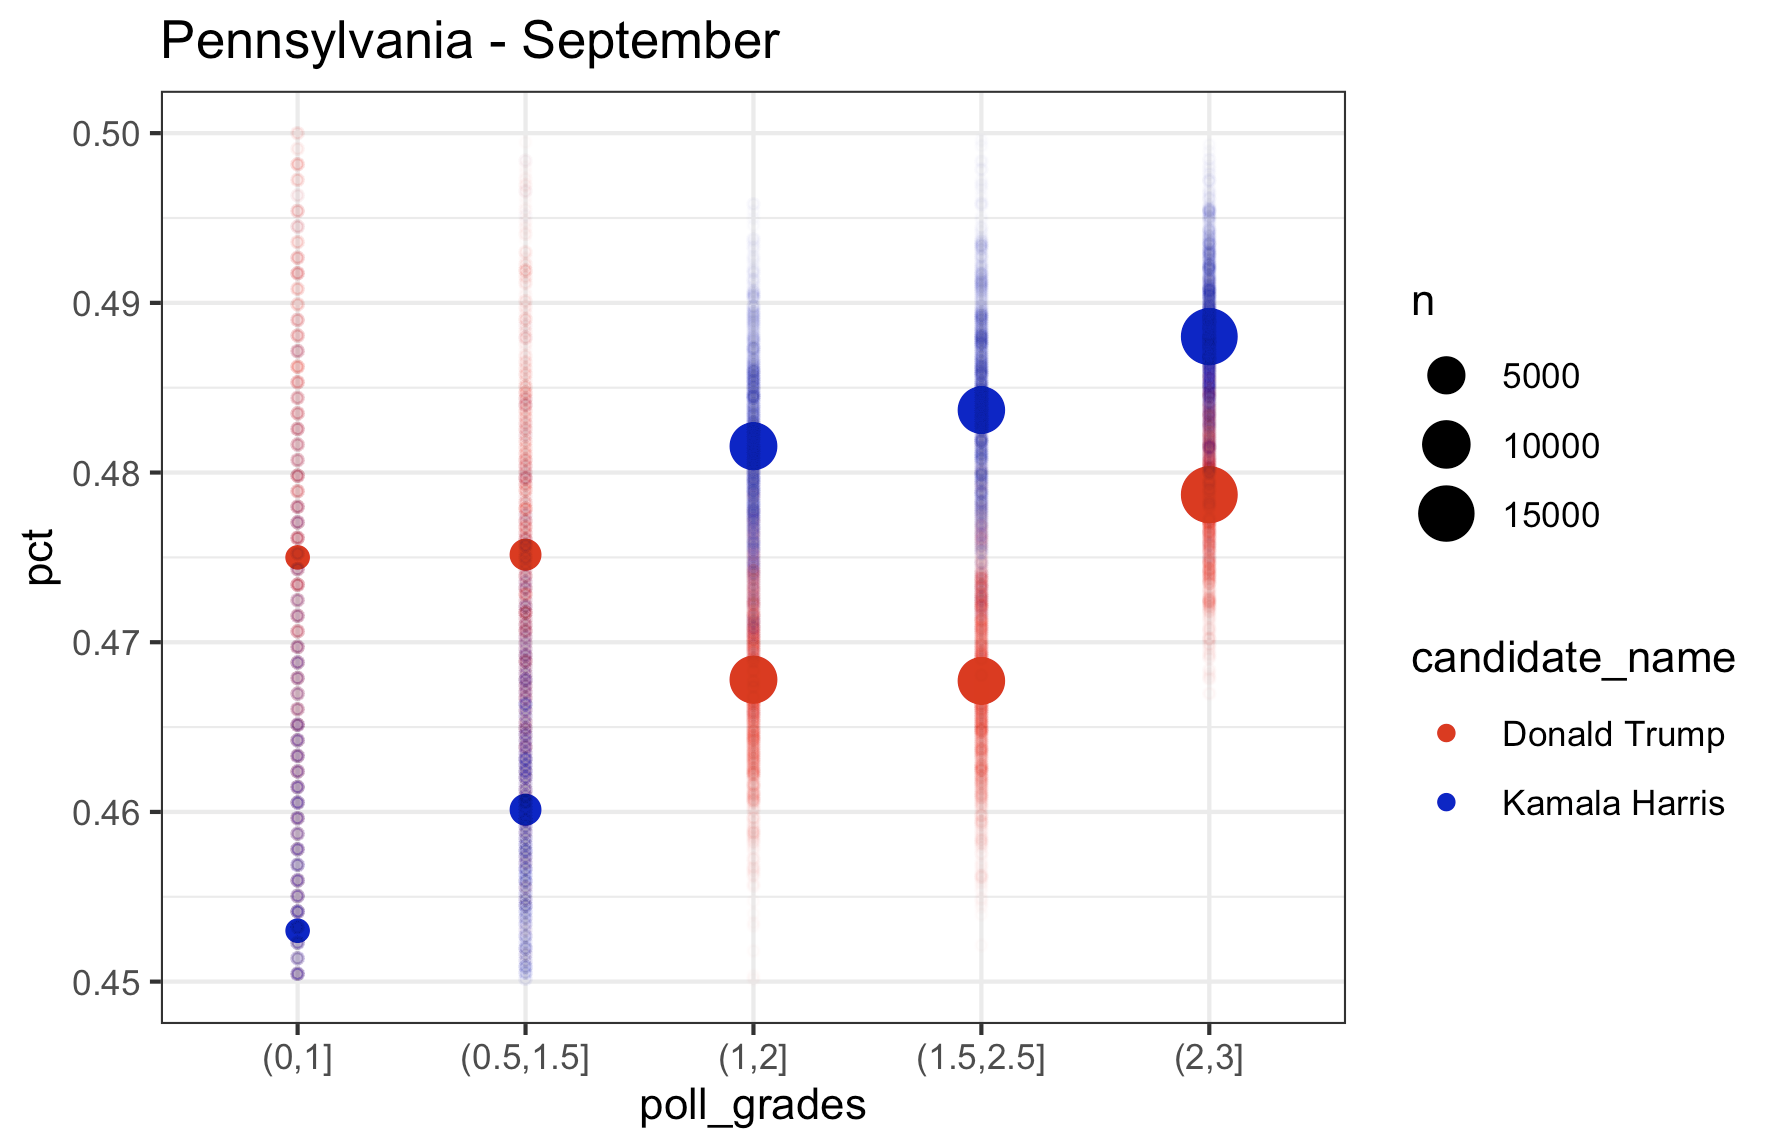
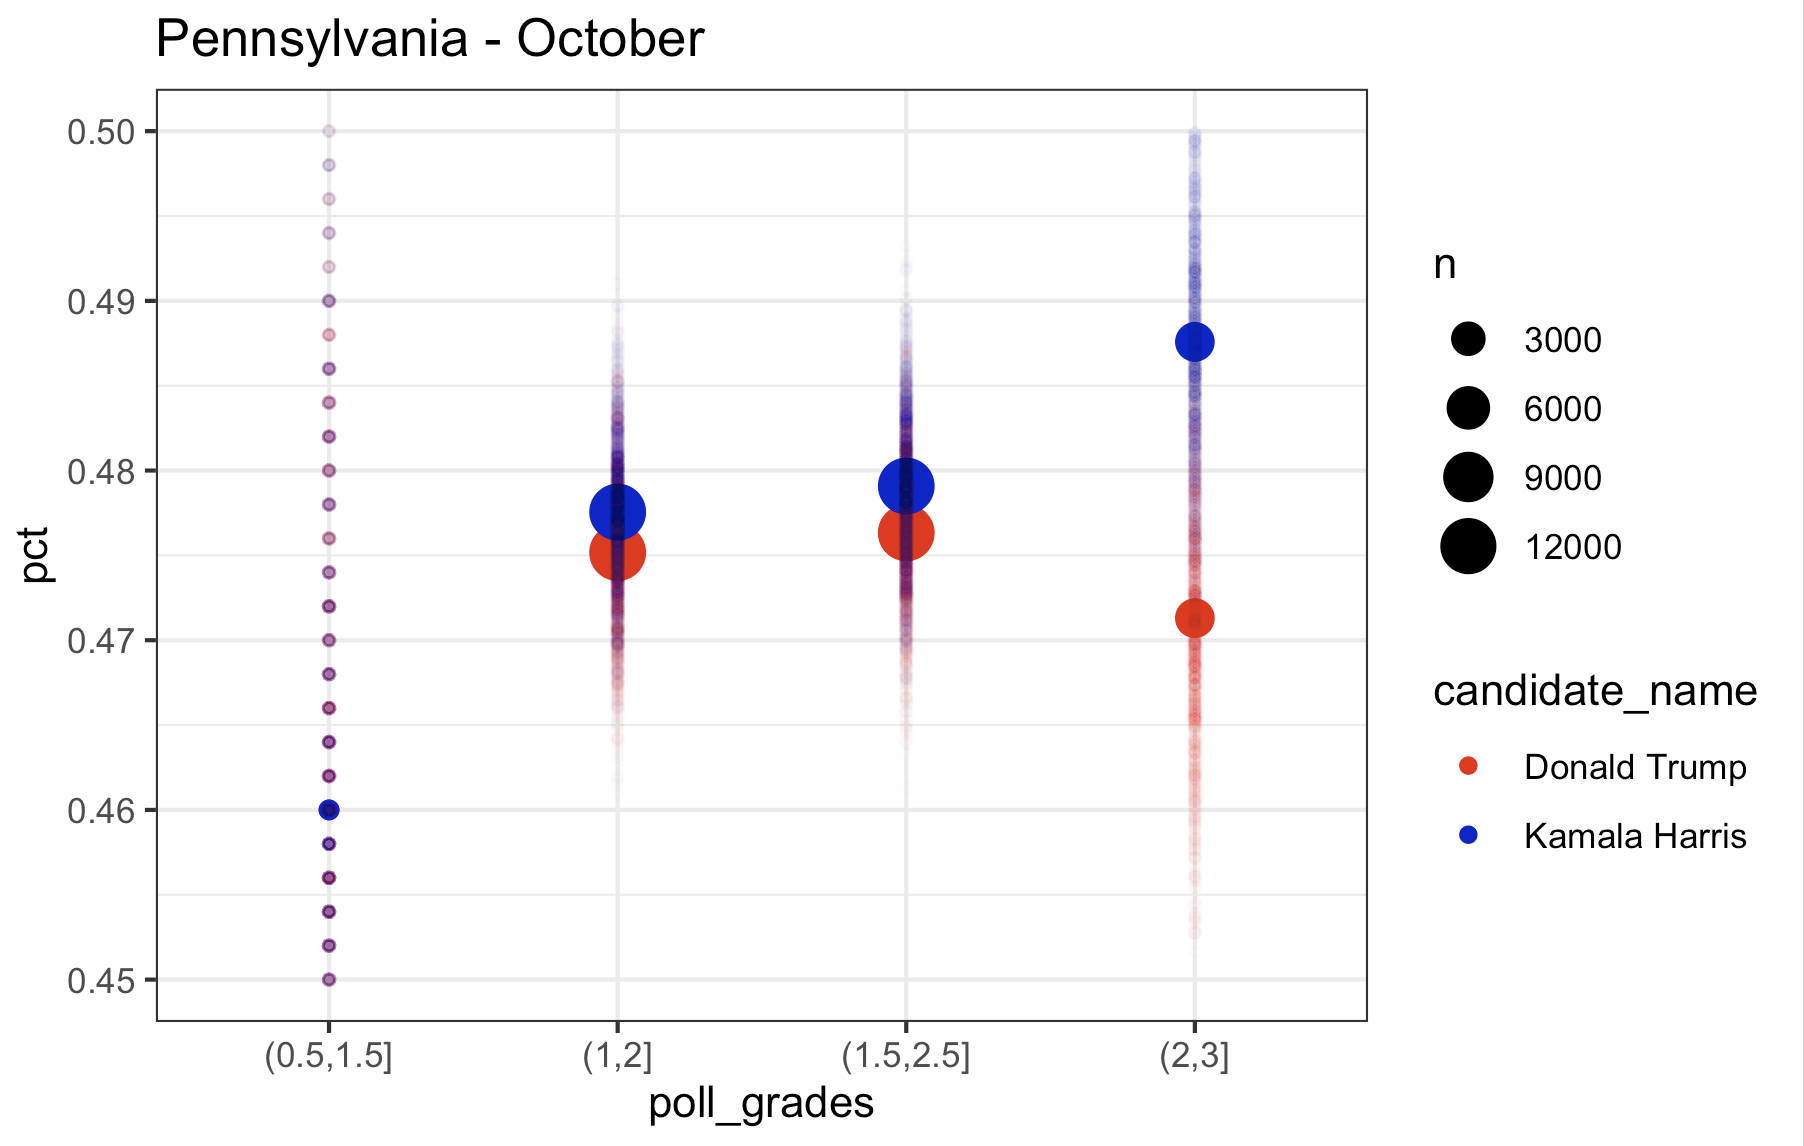
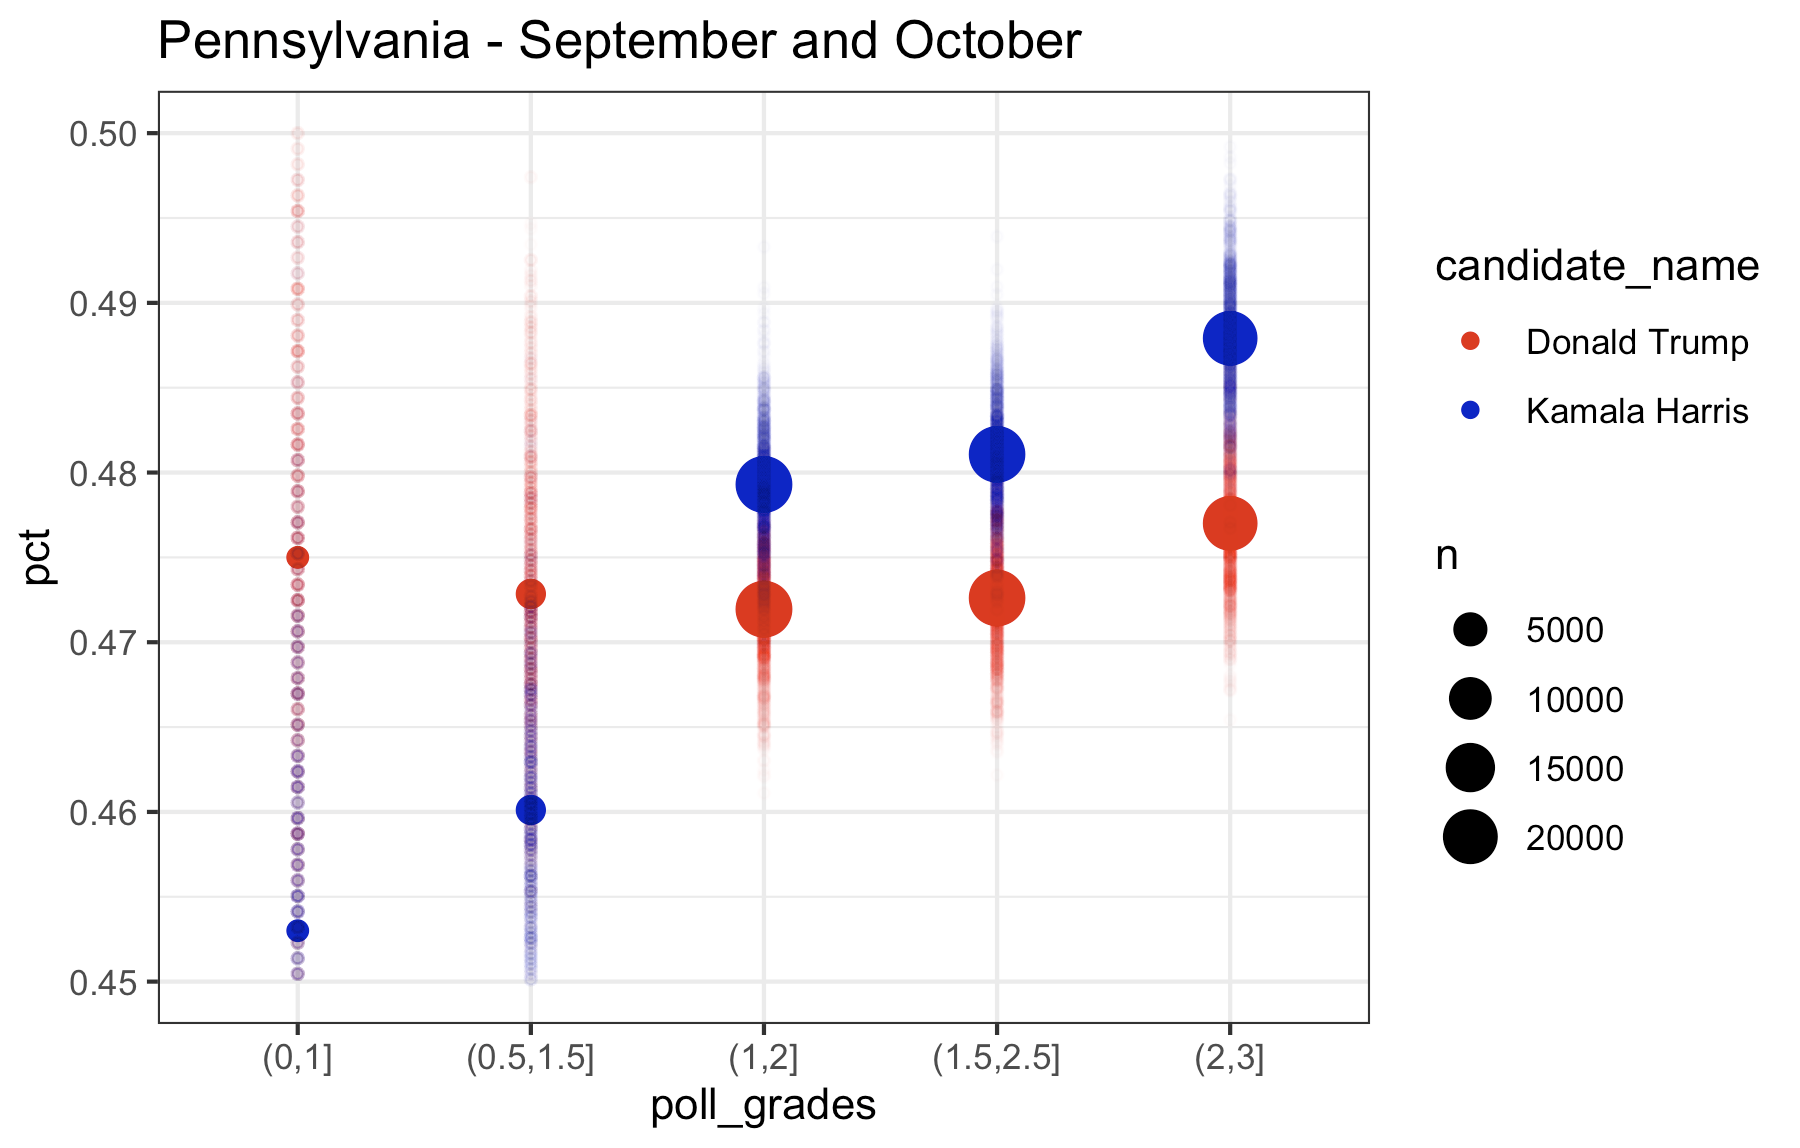
What you’ll notice is that the higher the rating on the filter of which polls to include, the higher the estimate is for Kamala, while Trump remains relatively consistent across polls. If you look at the last plot (September and October pooled together), the lowest rated polls have Kamala trailing in Pennsylvania by almost 2 points. The top rated polls have Kamala leading by a point. So, based on this it looks to me like…..Pennsylvania isn’t actually that close. Kamala is consistently leading in the top rated polls and and the polls in 2022 were, according to 538, “historically accurate“. So this is good news for Kamala. But there also appears to be some not so great news for Kamala, too. Let’s look at the other swing states, which I consider to be Michigan, Wisconsin, Georgia, Arizona, Nevada, and North Carolina (North Carolina is a swing state. Fight me.) Let’s start with the rest of the Midwest (Pennsylvania is Midwest. Fight me.)
Wisconsin
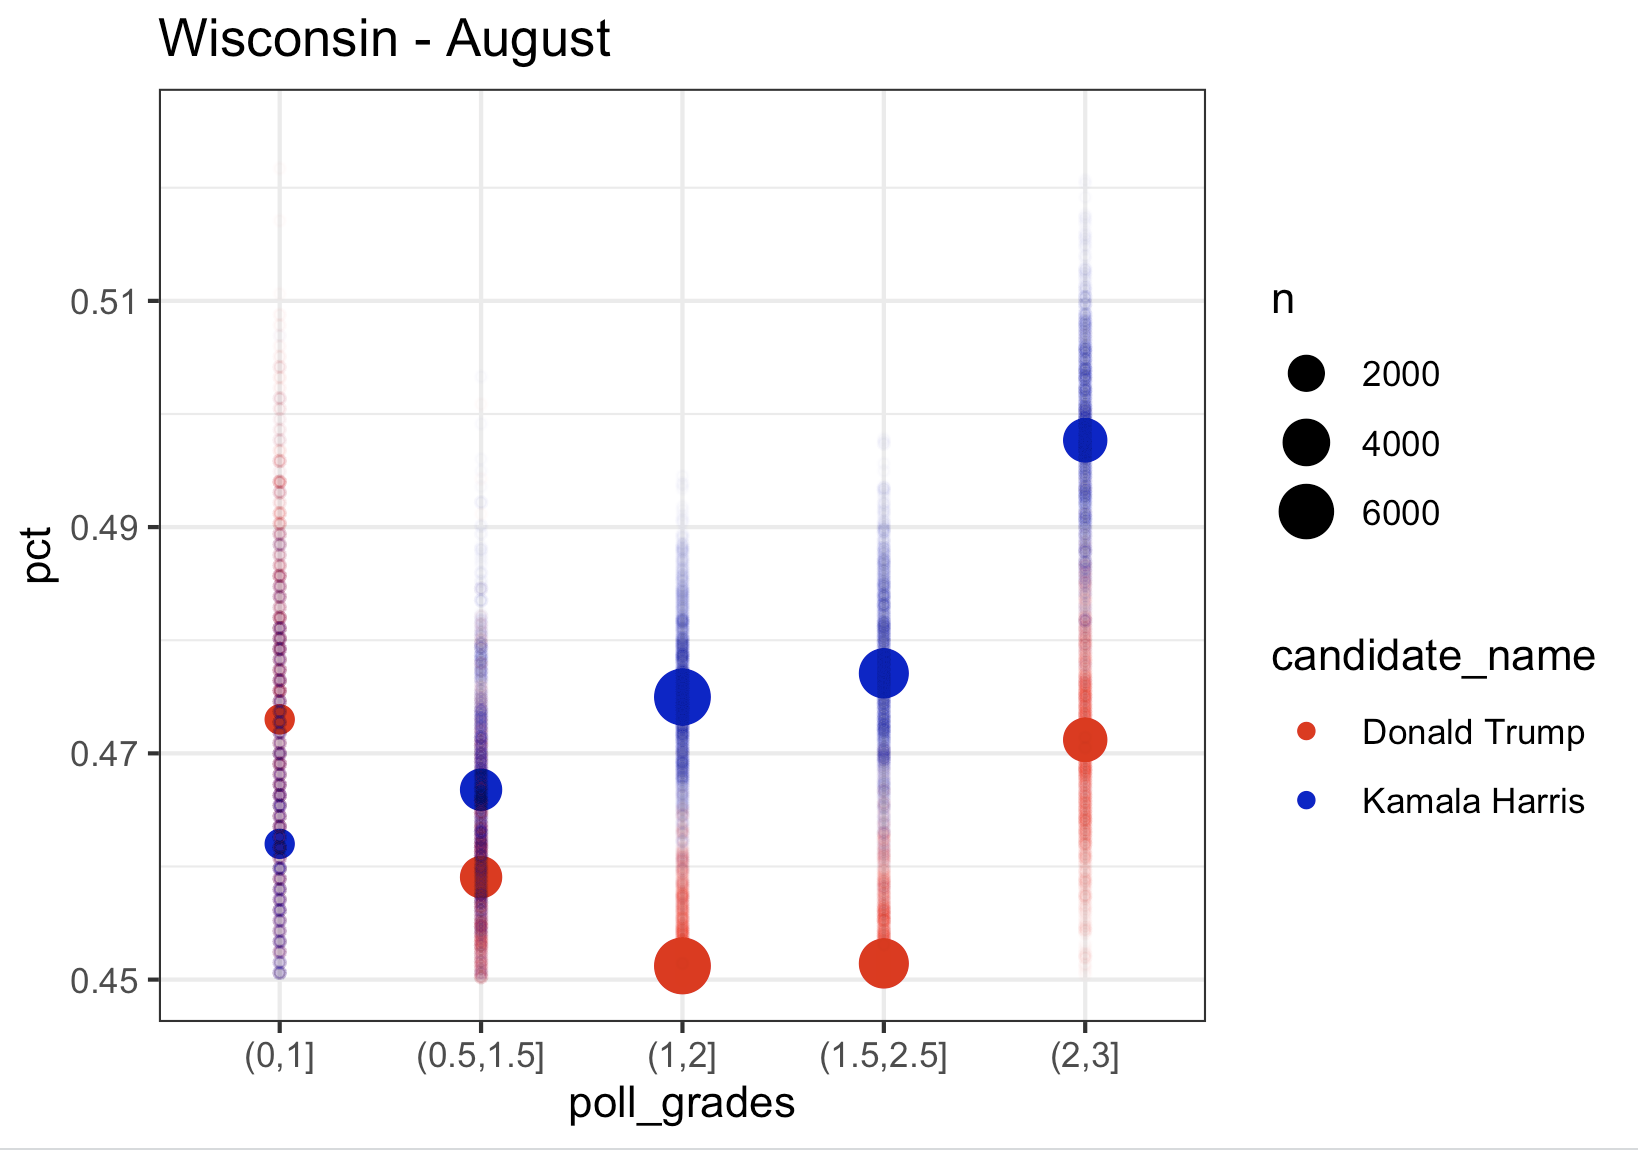
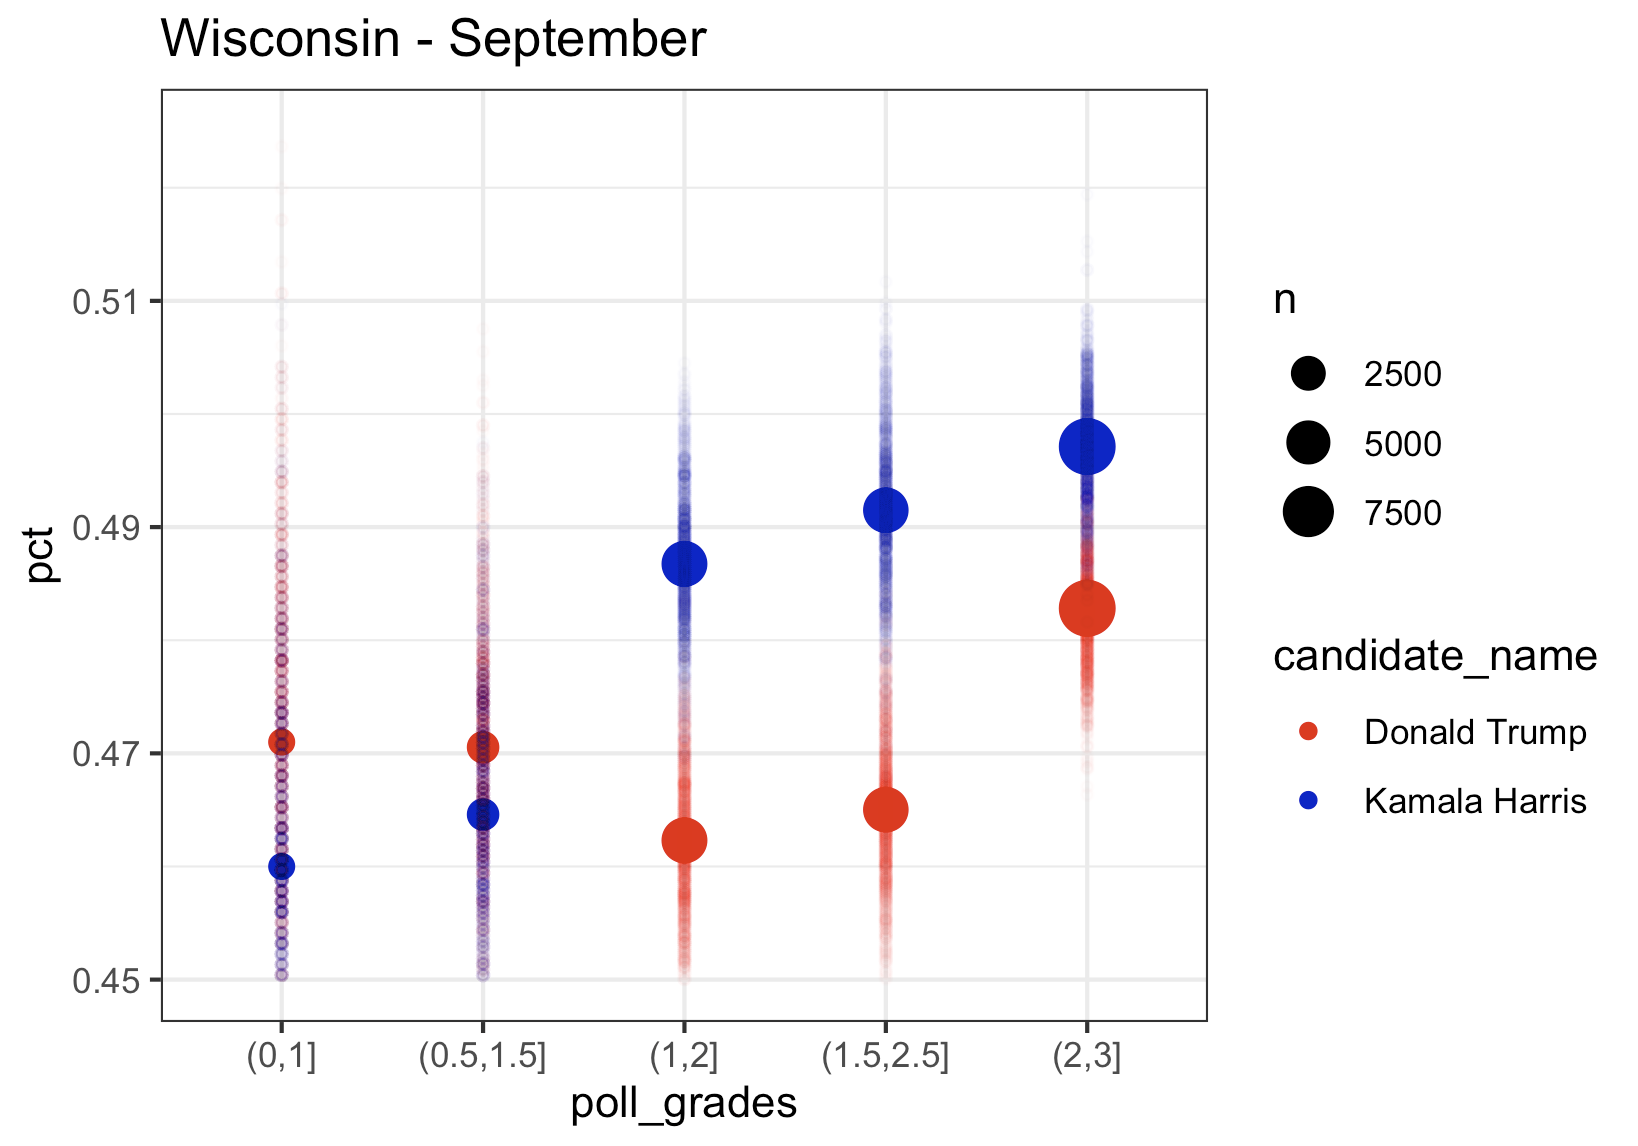
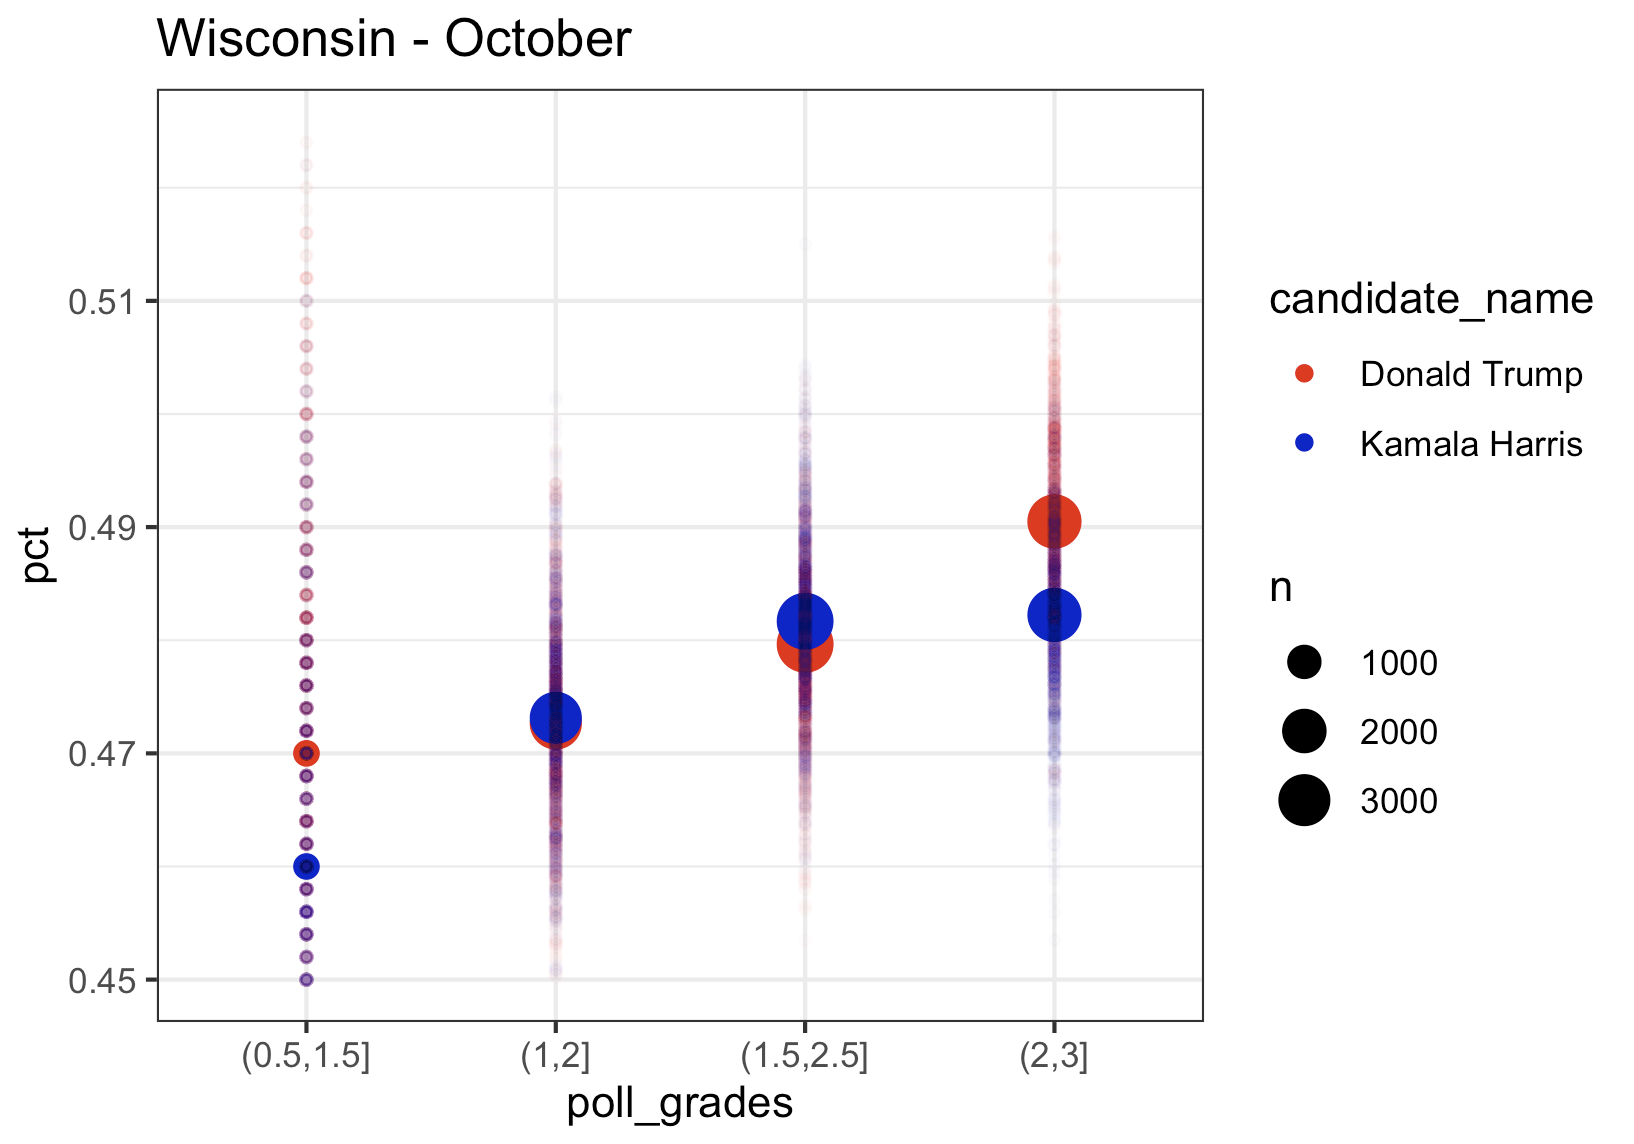
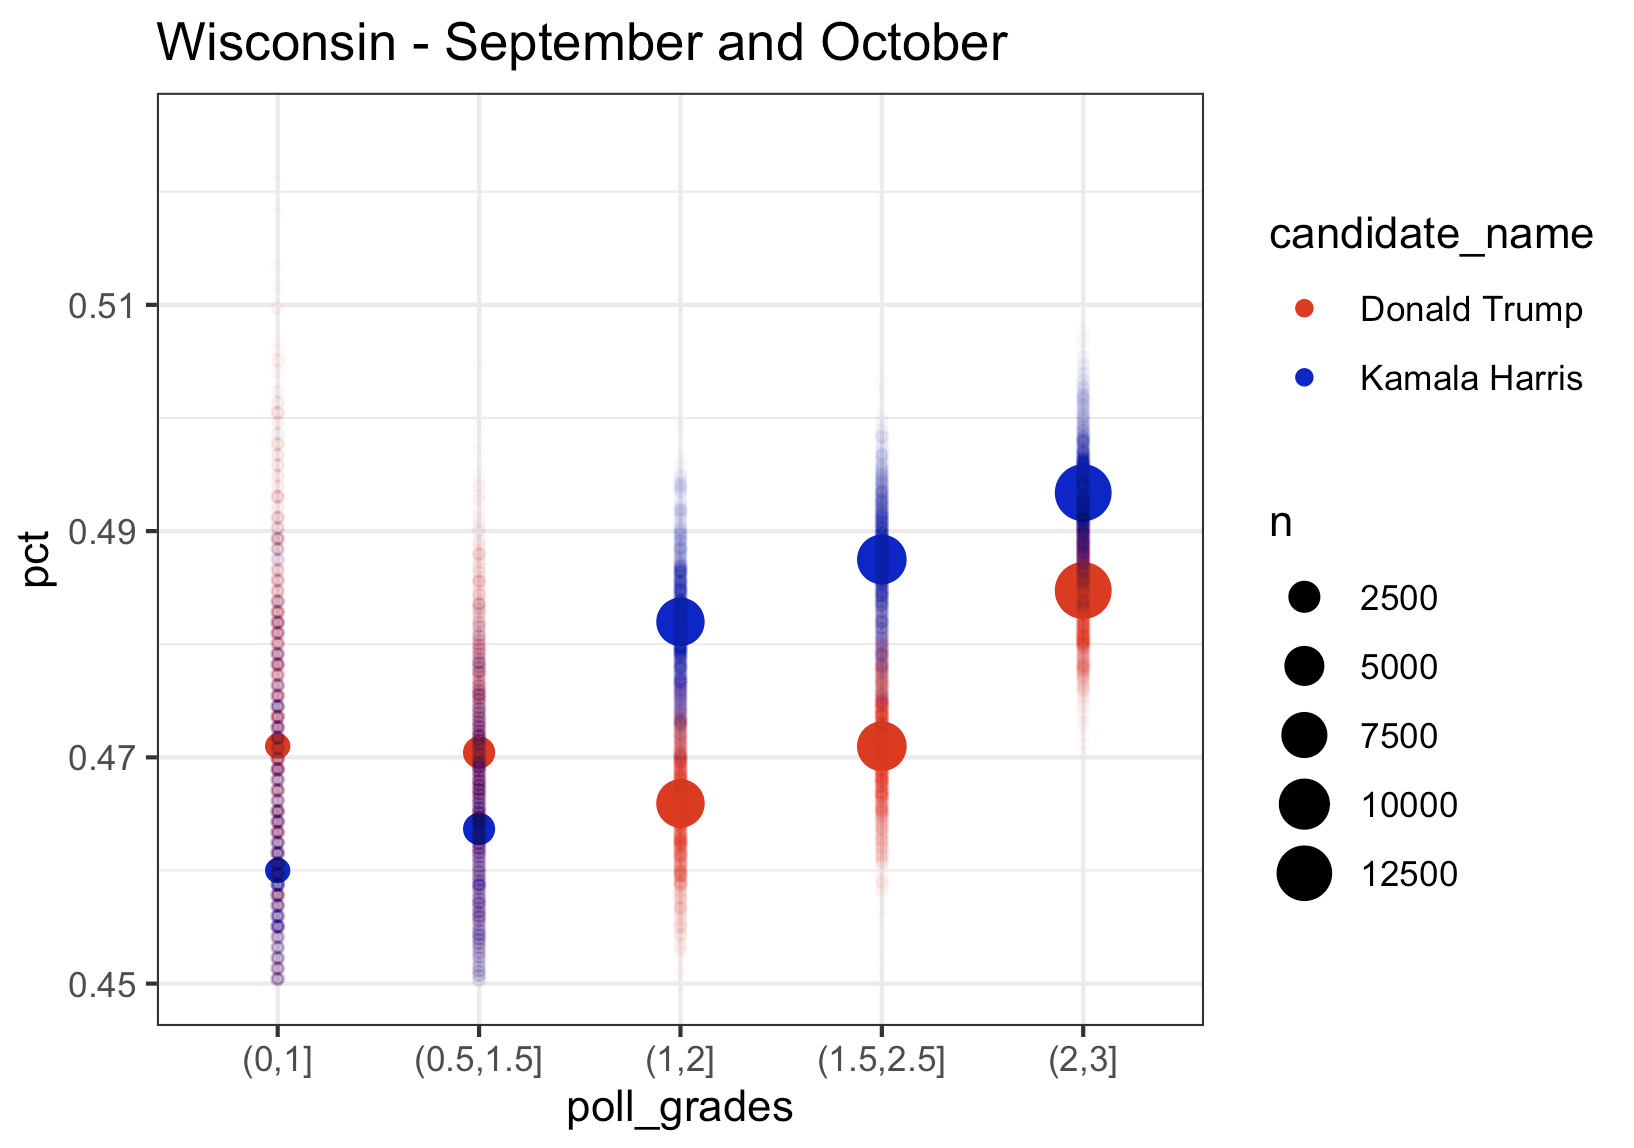
We again see the same pattern where higher rated pollsters have Kamala at a higher percentage, exactly like we saw in Pennsylvania. The bad news for Kamala in Michigan is that her lead using only August data was about 1.5, in September it was down to 1, and with the limited data in October, she is trailing in Wisconsin by about 0.5. And we see the same thing in Michigan.
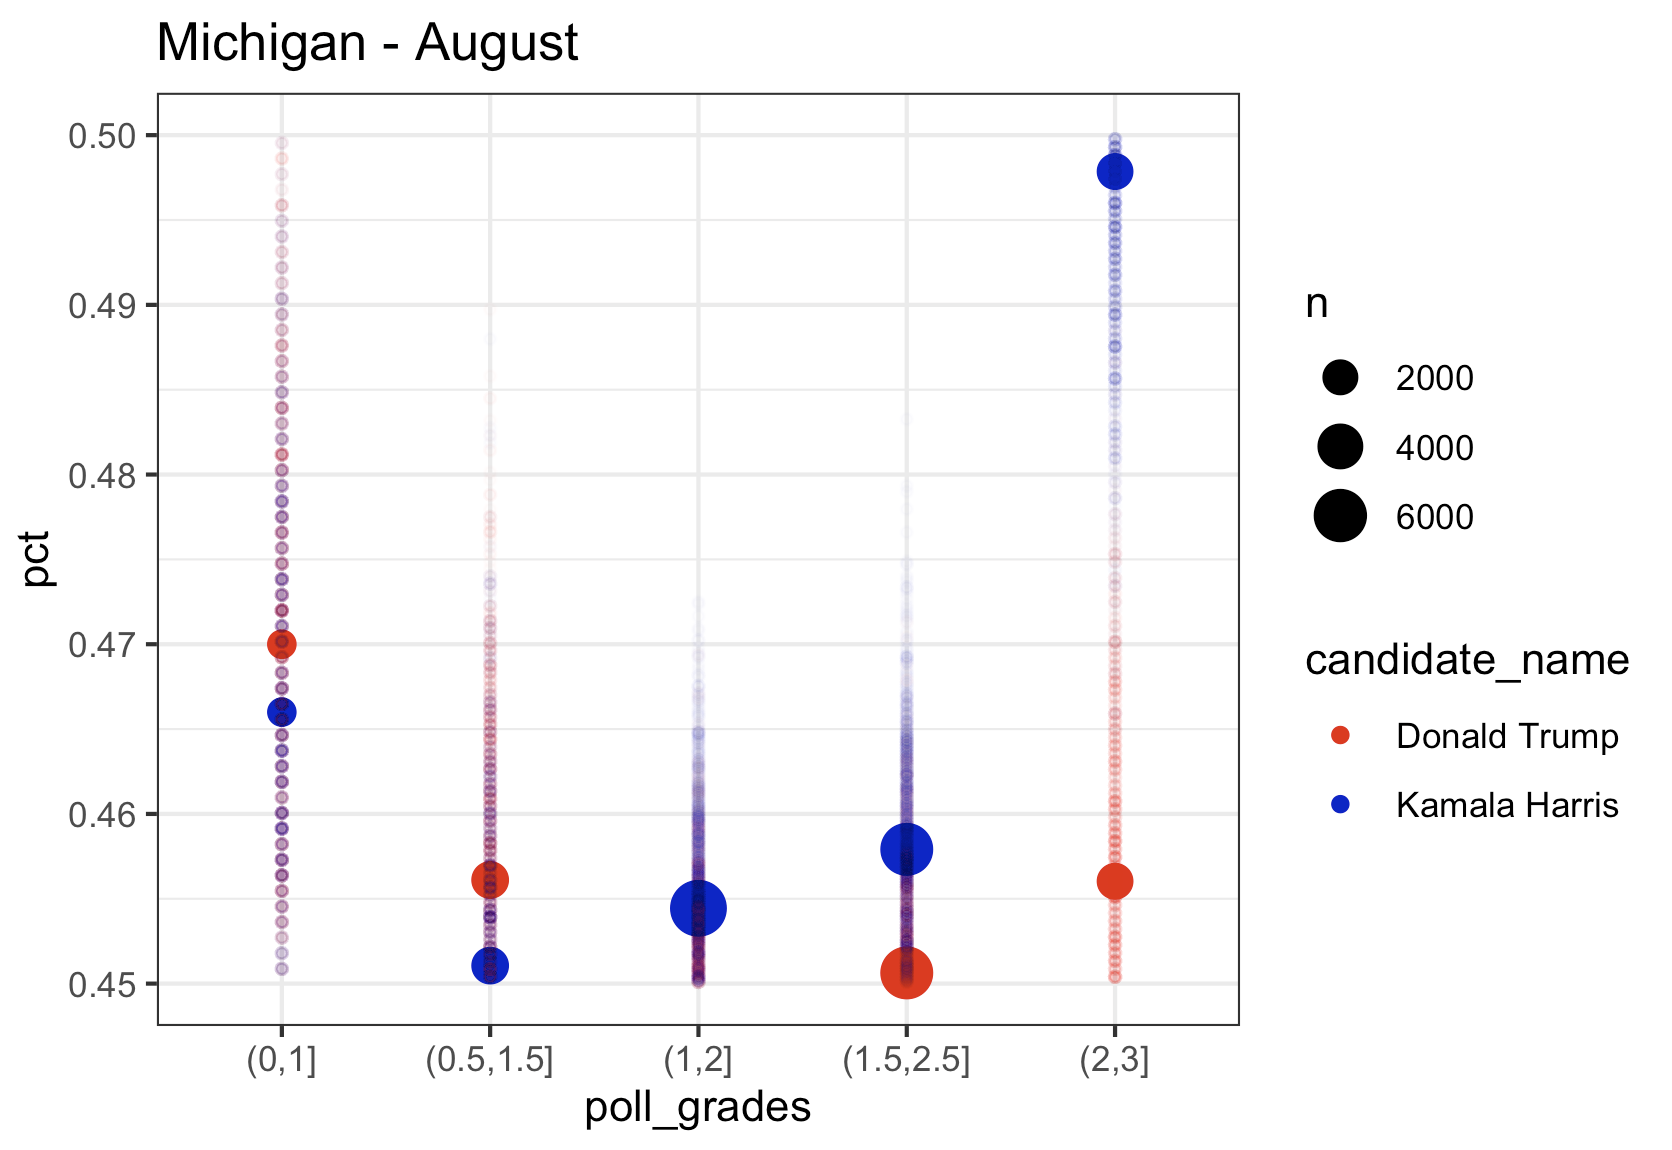
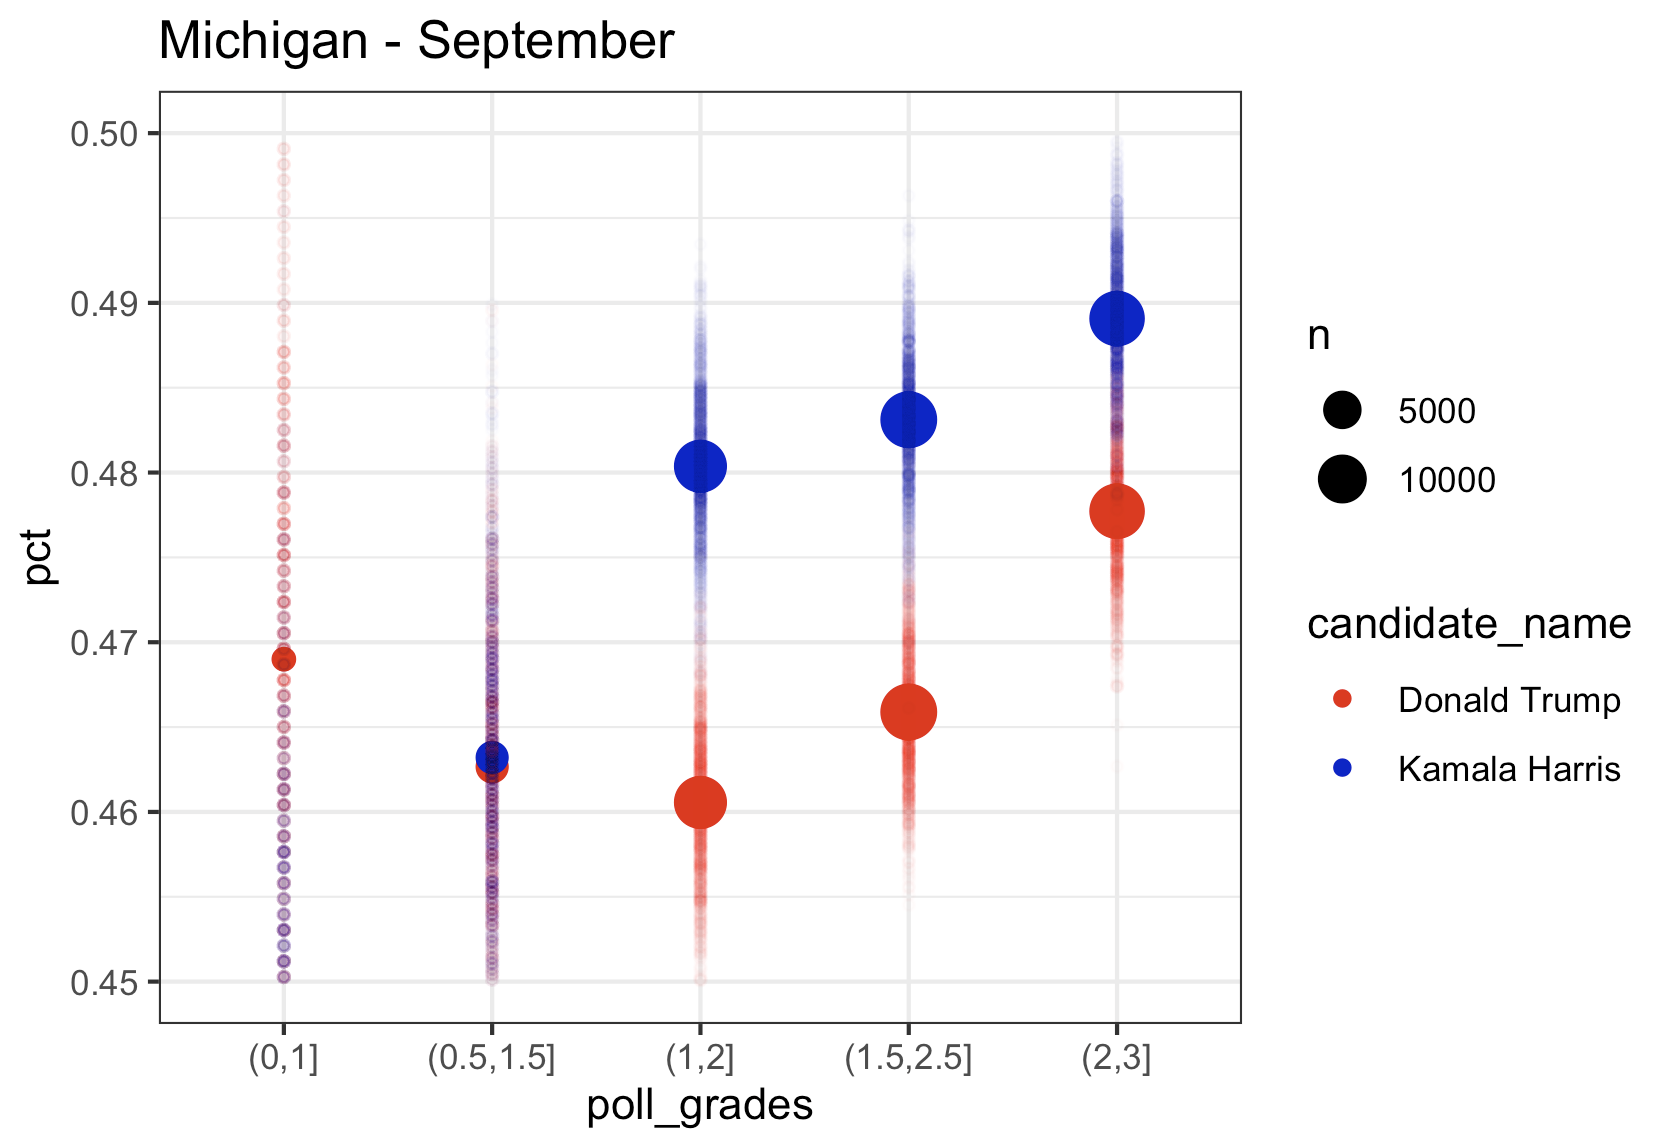
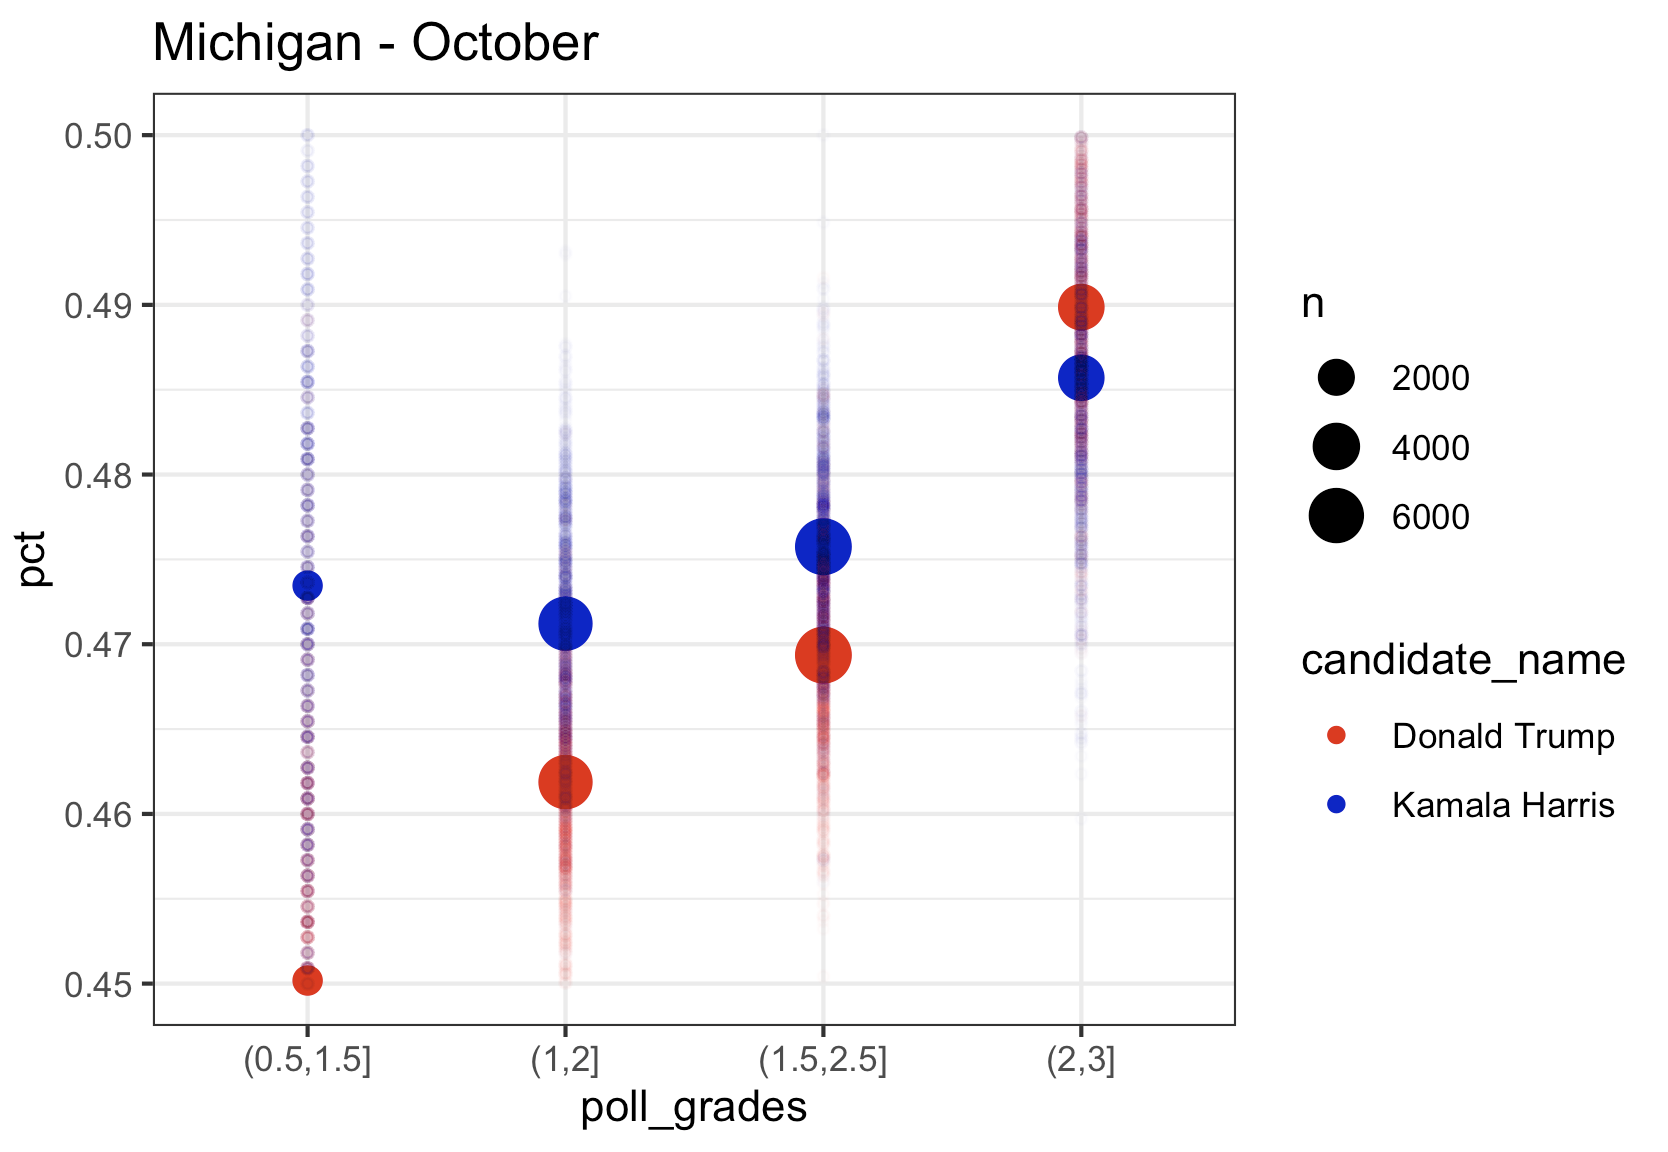
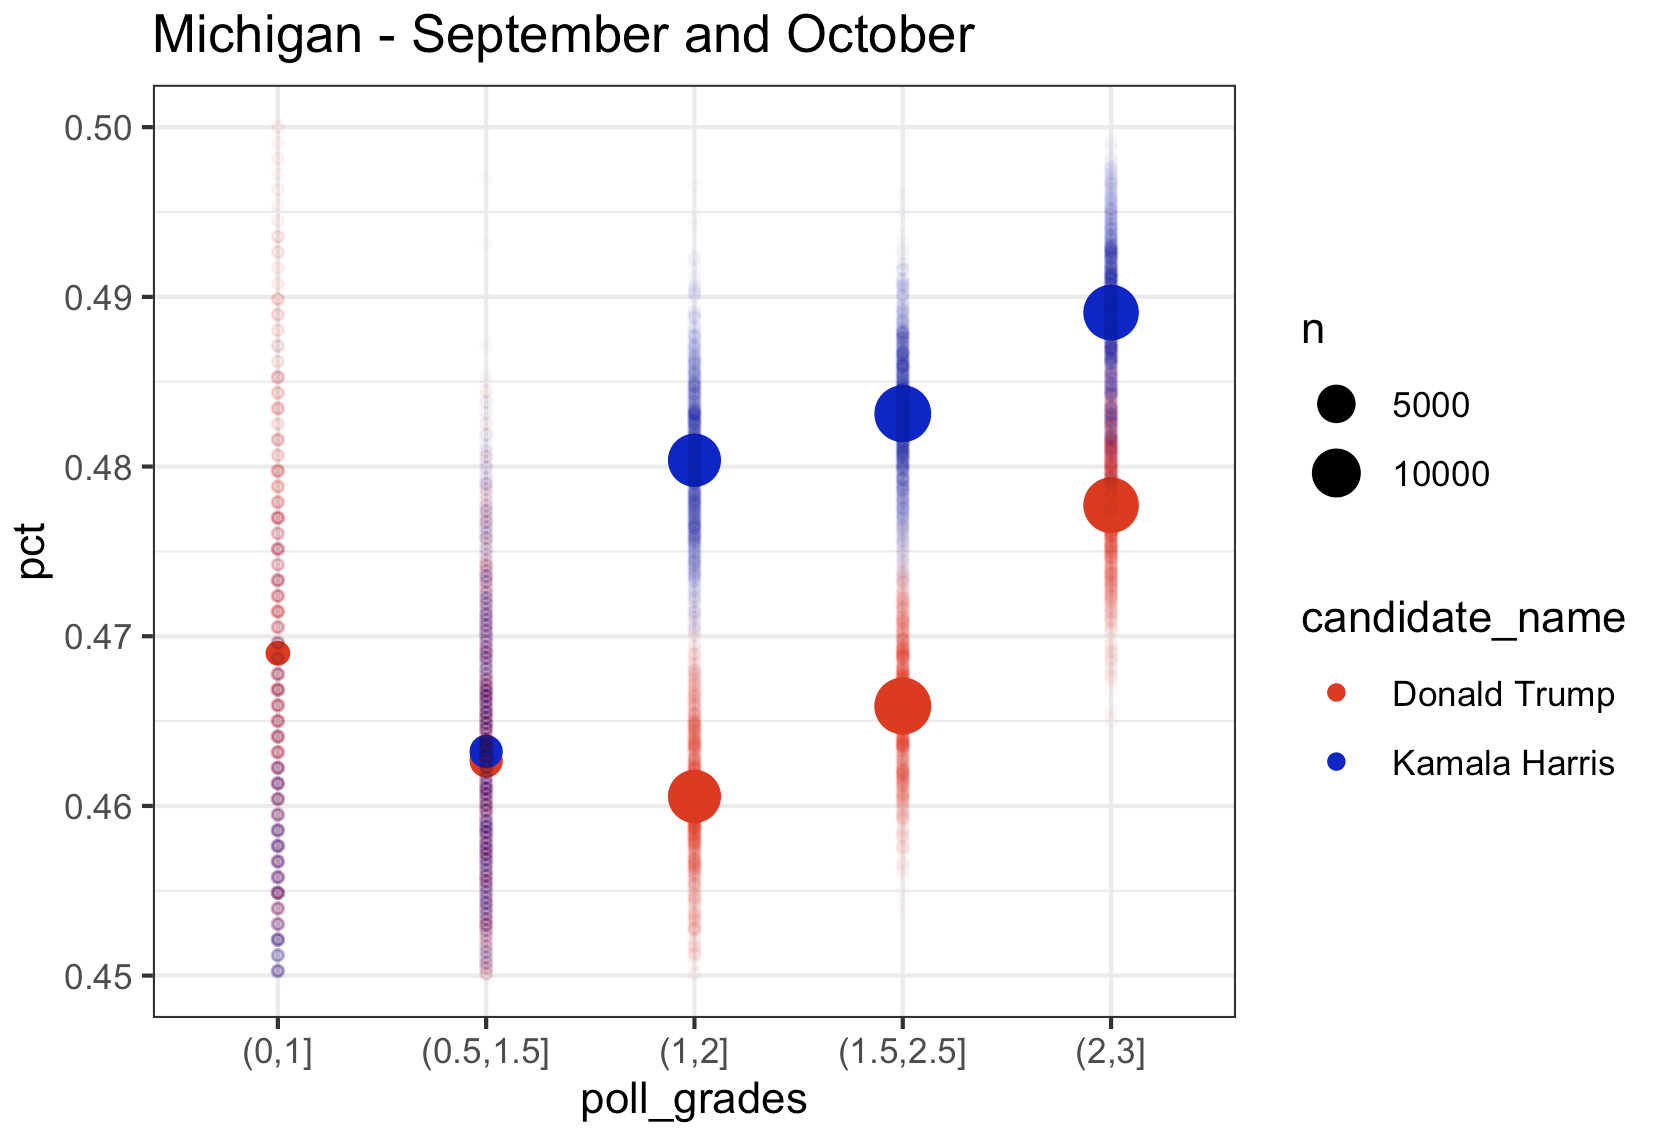
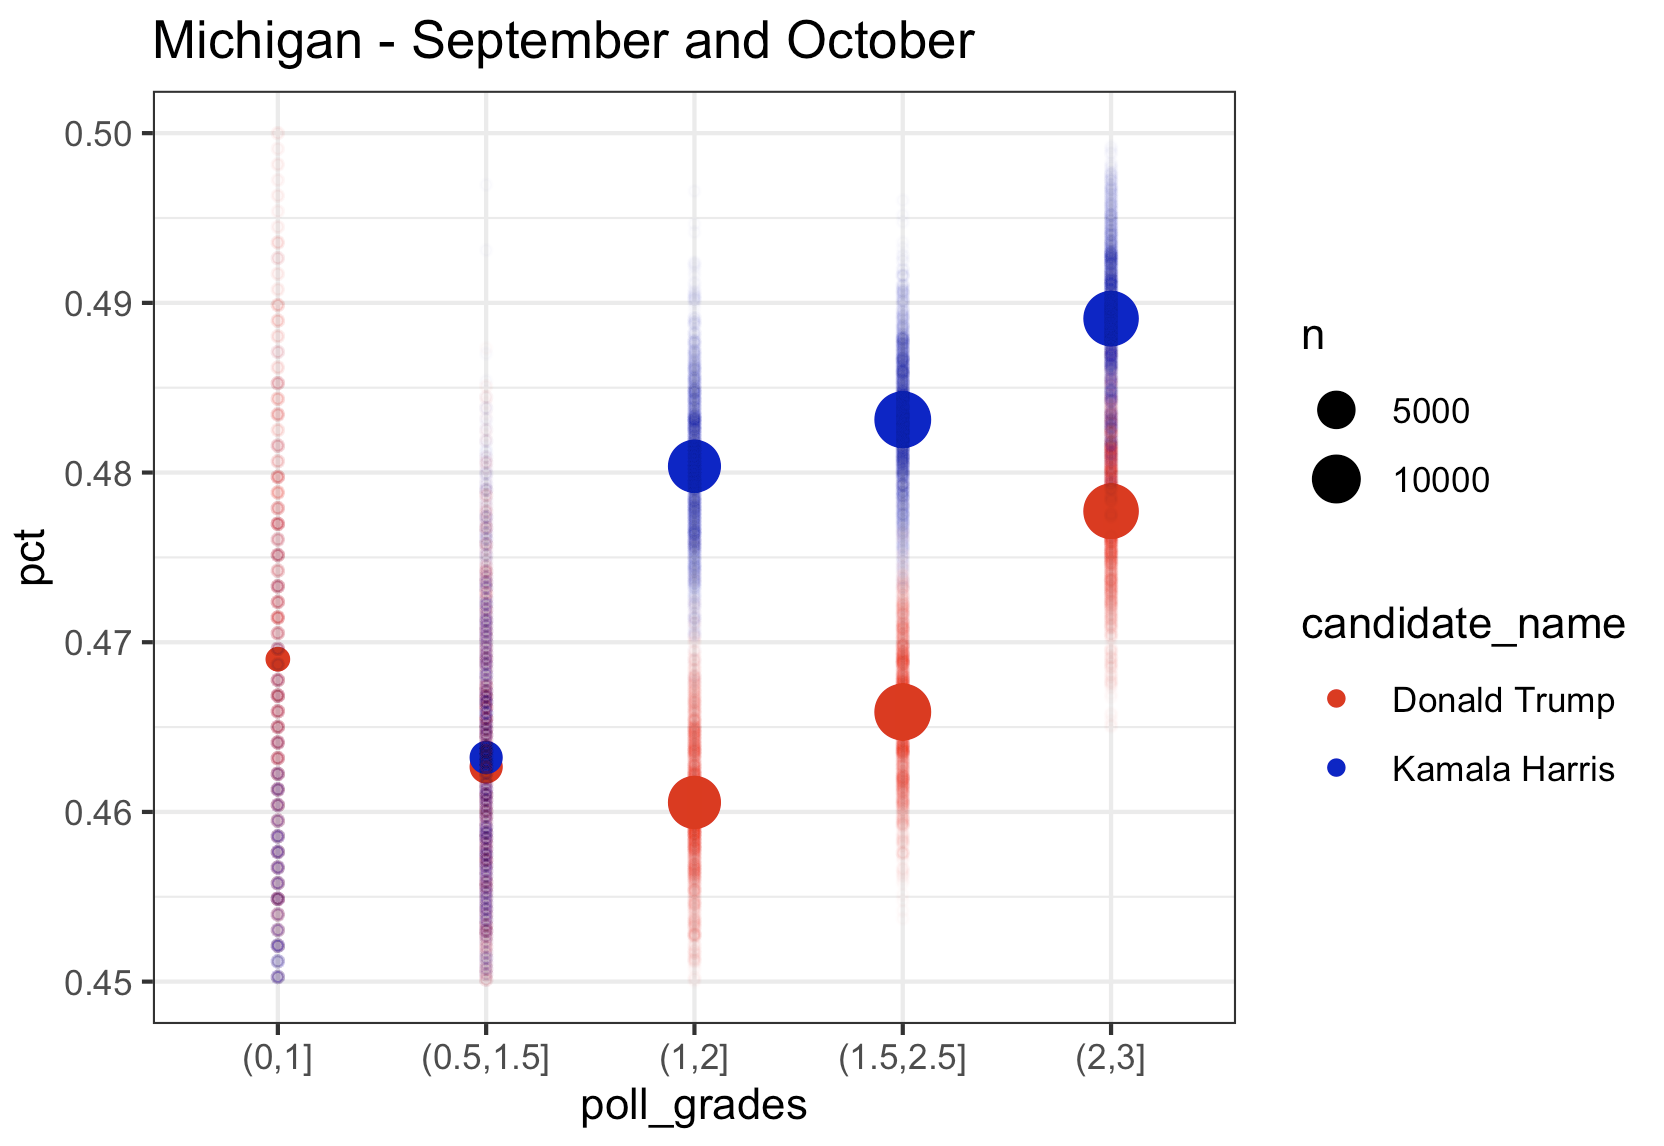
Michigan
Kamala’s lead in Michigan in the top rated polls in August was over 4 points, in September it was down to 1 point, and using only October data from the top pollsters, just like in Wisconsin, she is trailing by 0.5 points. The aggregate of September and October, still has her in the lead, but the trend has to be scary to the Harris campaign. Note that once again we see the lower rated pollsters with Kamala much lower than the highest rated pollsters.
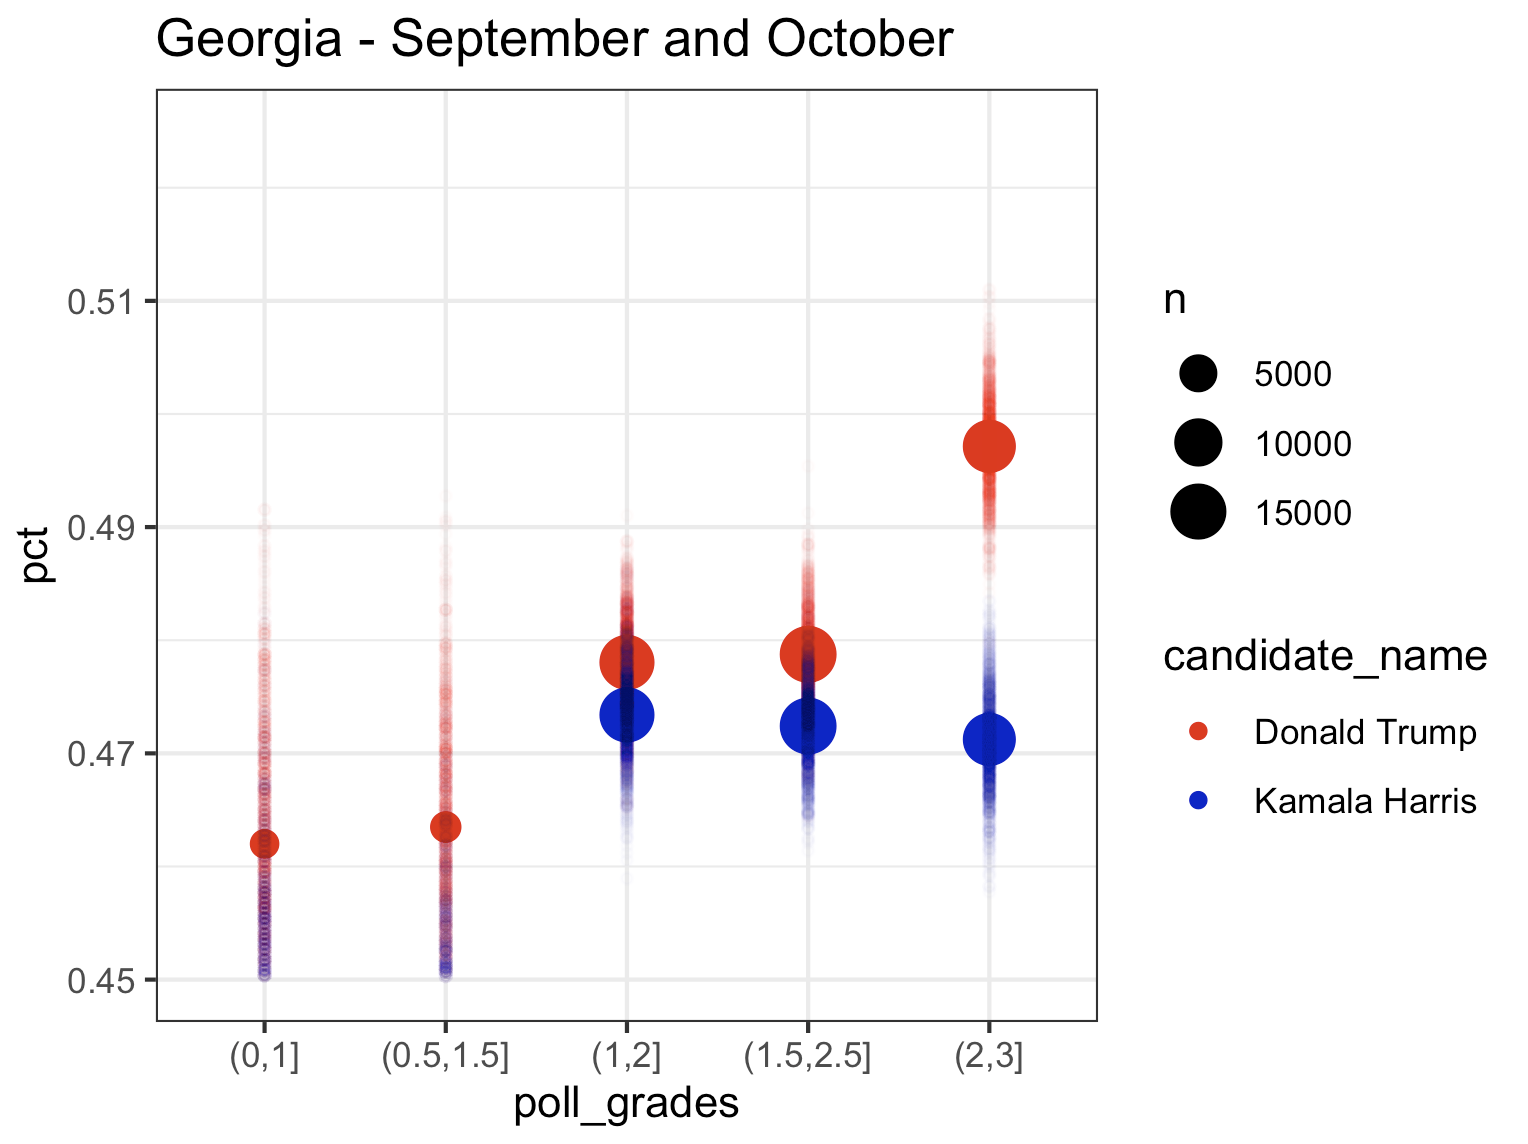
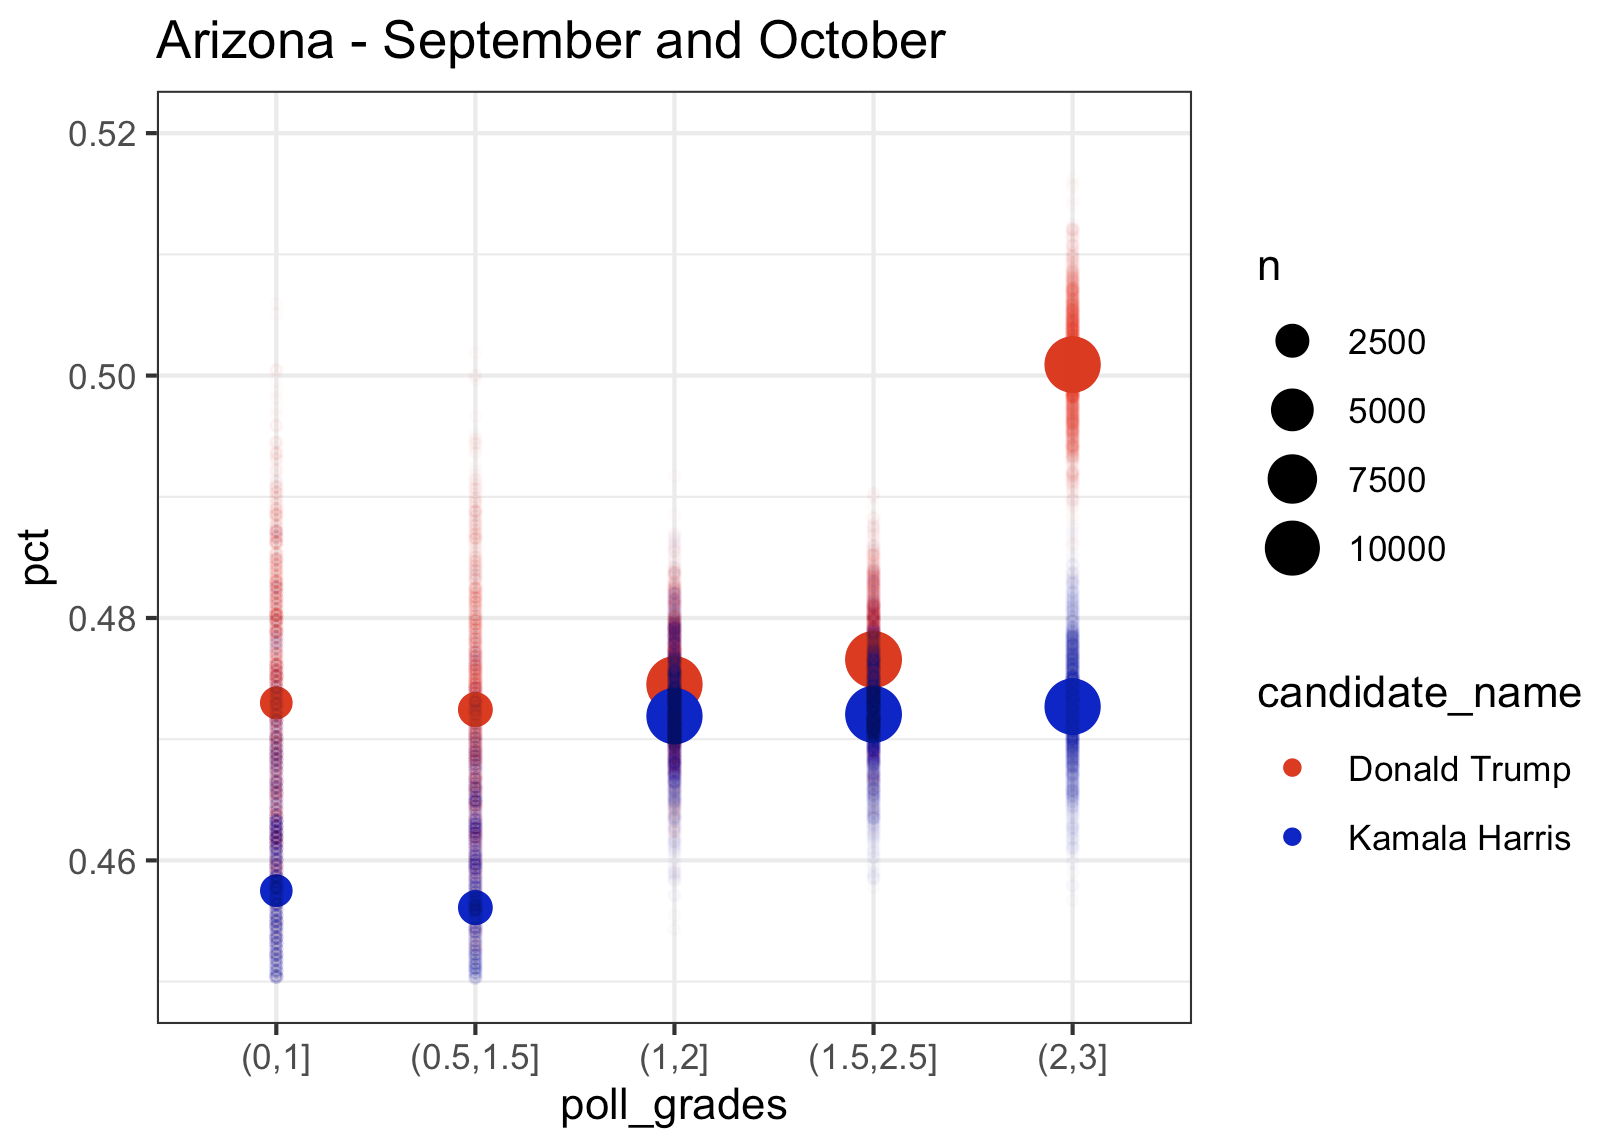
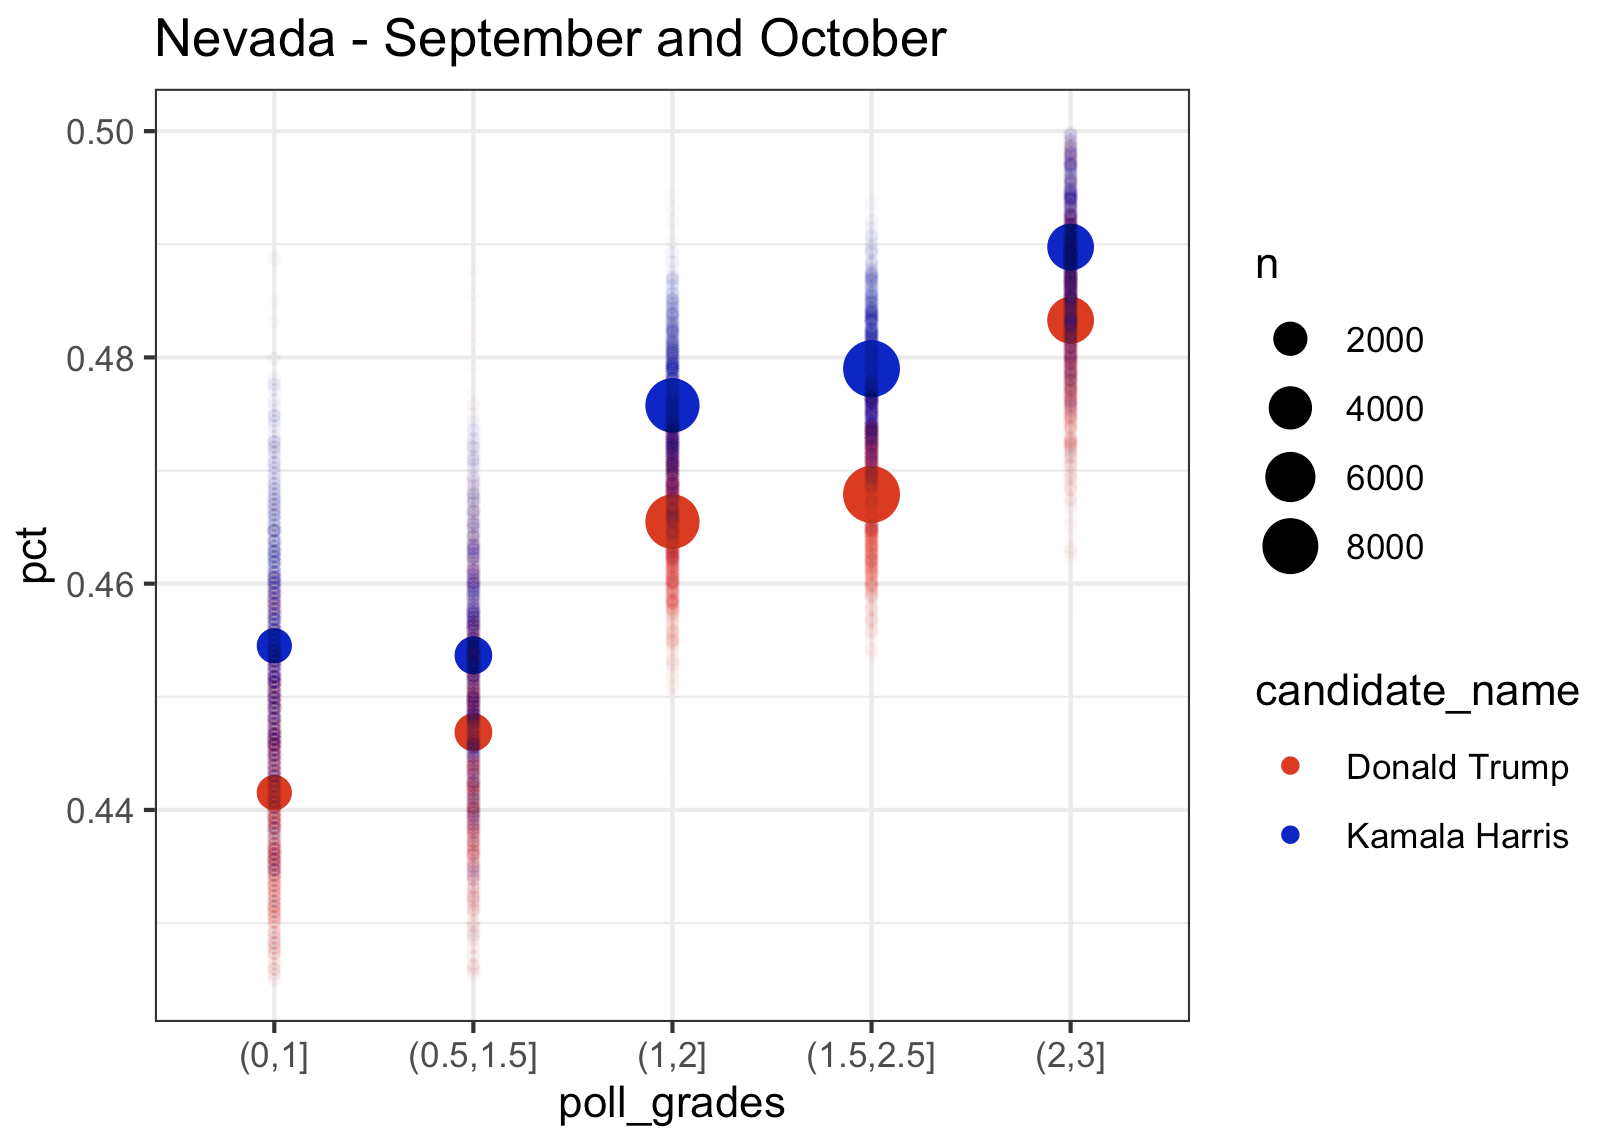
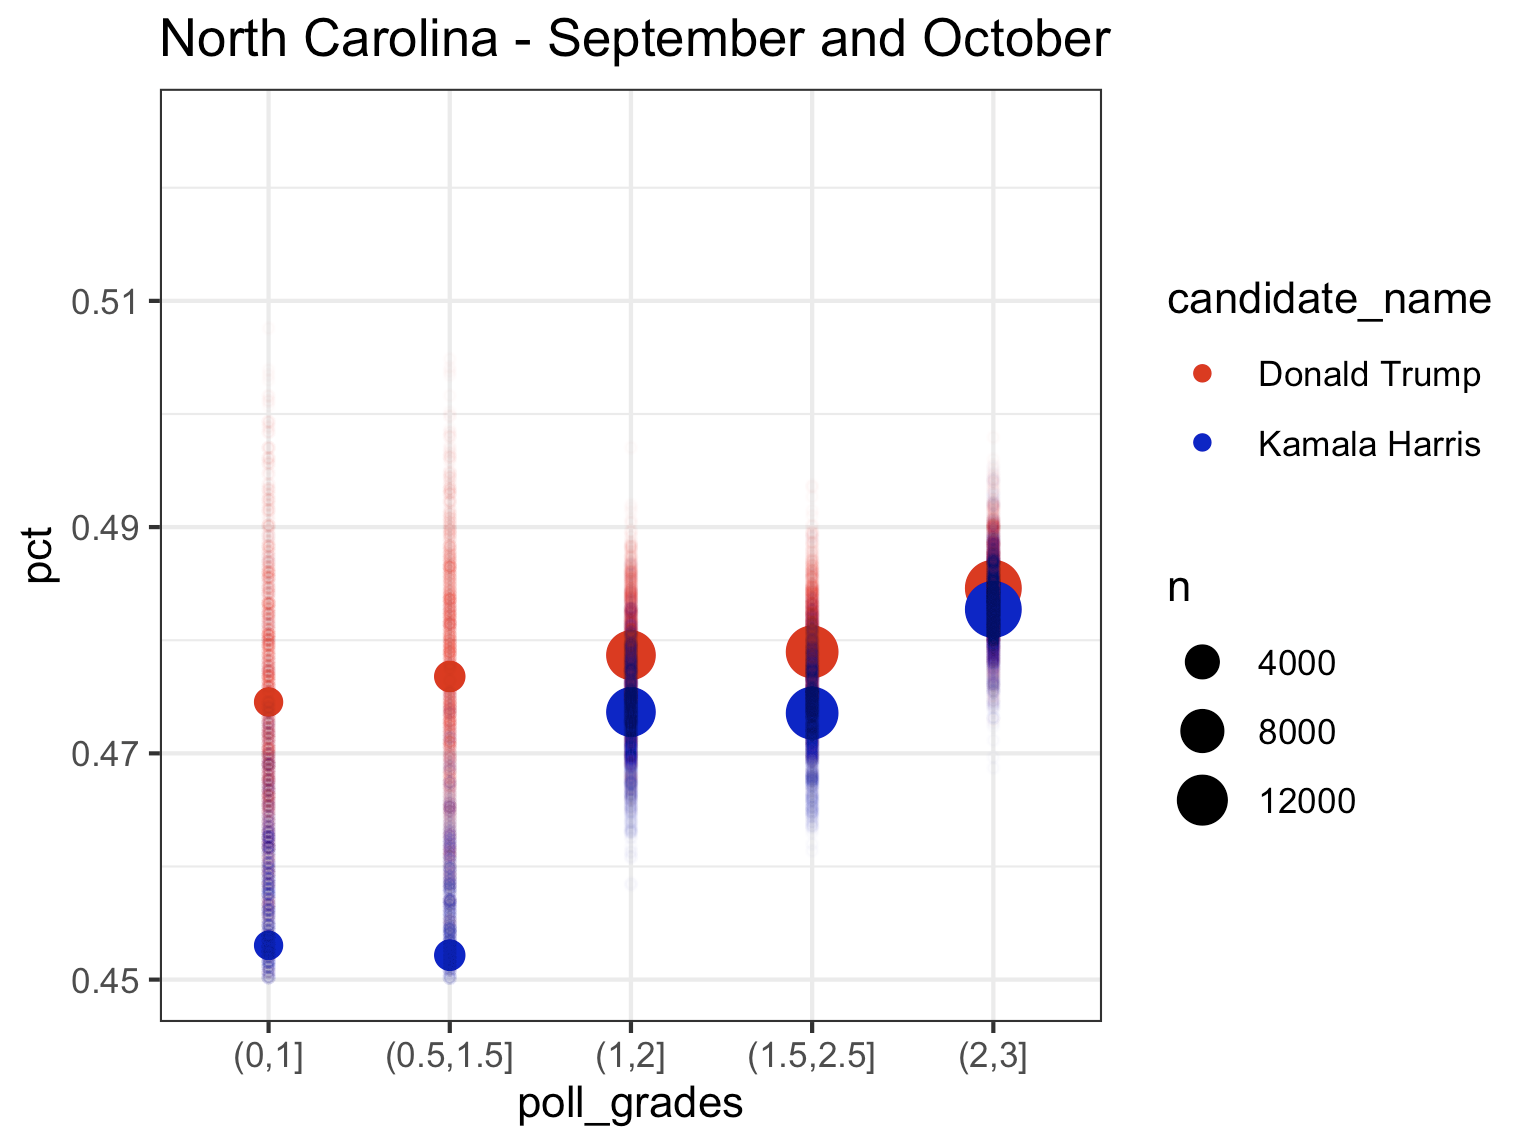
Finally, let’s look at the last 4 swing states. What’s interesting in Georgia is that the top rated polls give Trump more of a lead than the lower rated polls, while Kamala’s percentage remains largely the same across pollster rating groups. Nevada and North Carolina follow the pattern that we saw in the Midwest with higher rated polls giving Kamala a higher percentage. Based on the top rated pollsters, Kamala is slightly leading in Nevada and just barely trailing in North Carolina (which I think Dems can win given the absolute lunatic running for governor).
Georgia
Arizona
Nevada
North Carolina
All this said, I give you an electoral map that I think is totally plausible based on this polling data that I guarantee you will not see anywhere else. Behold:
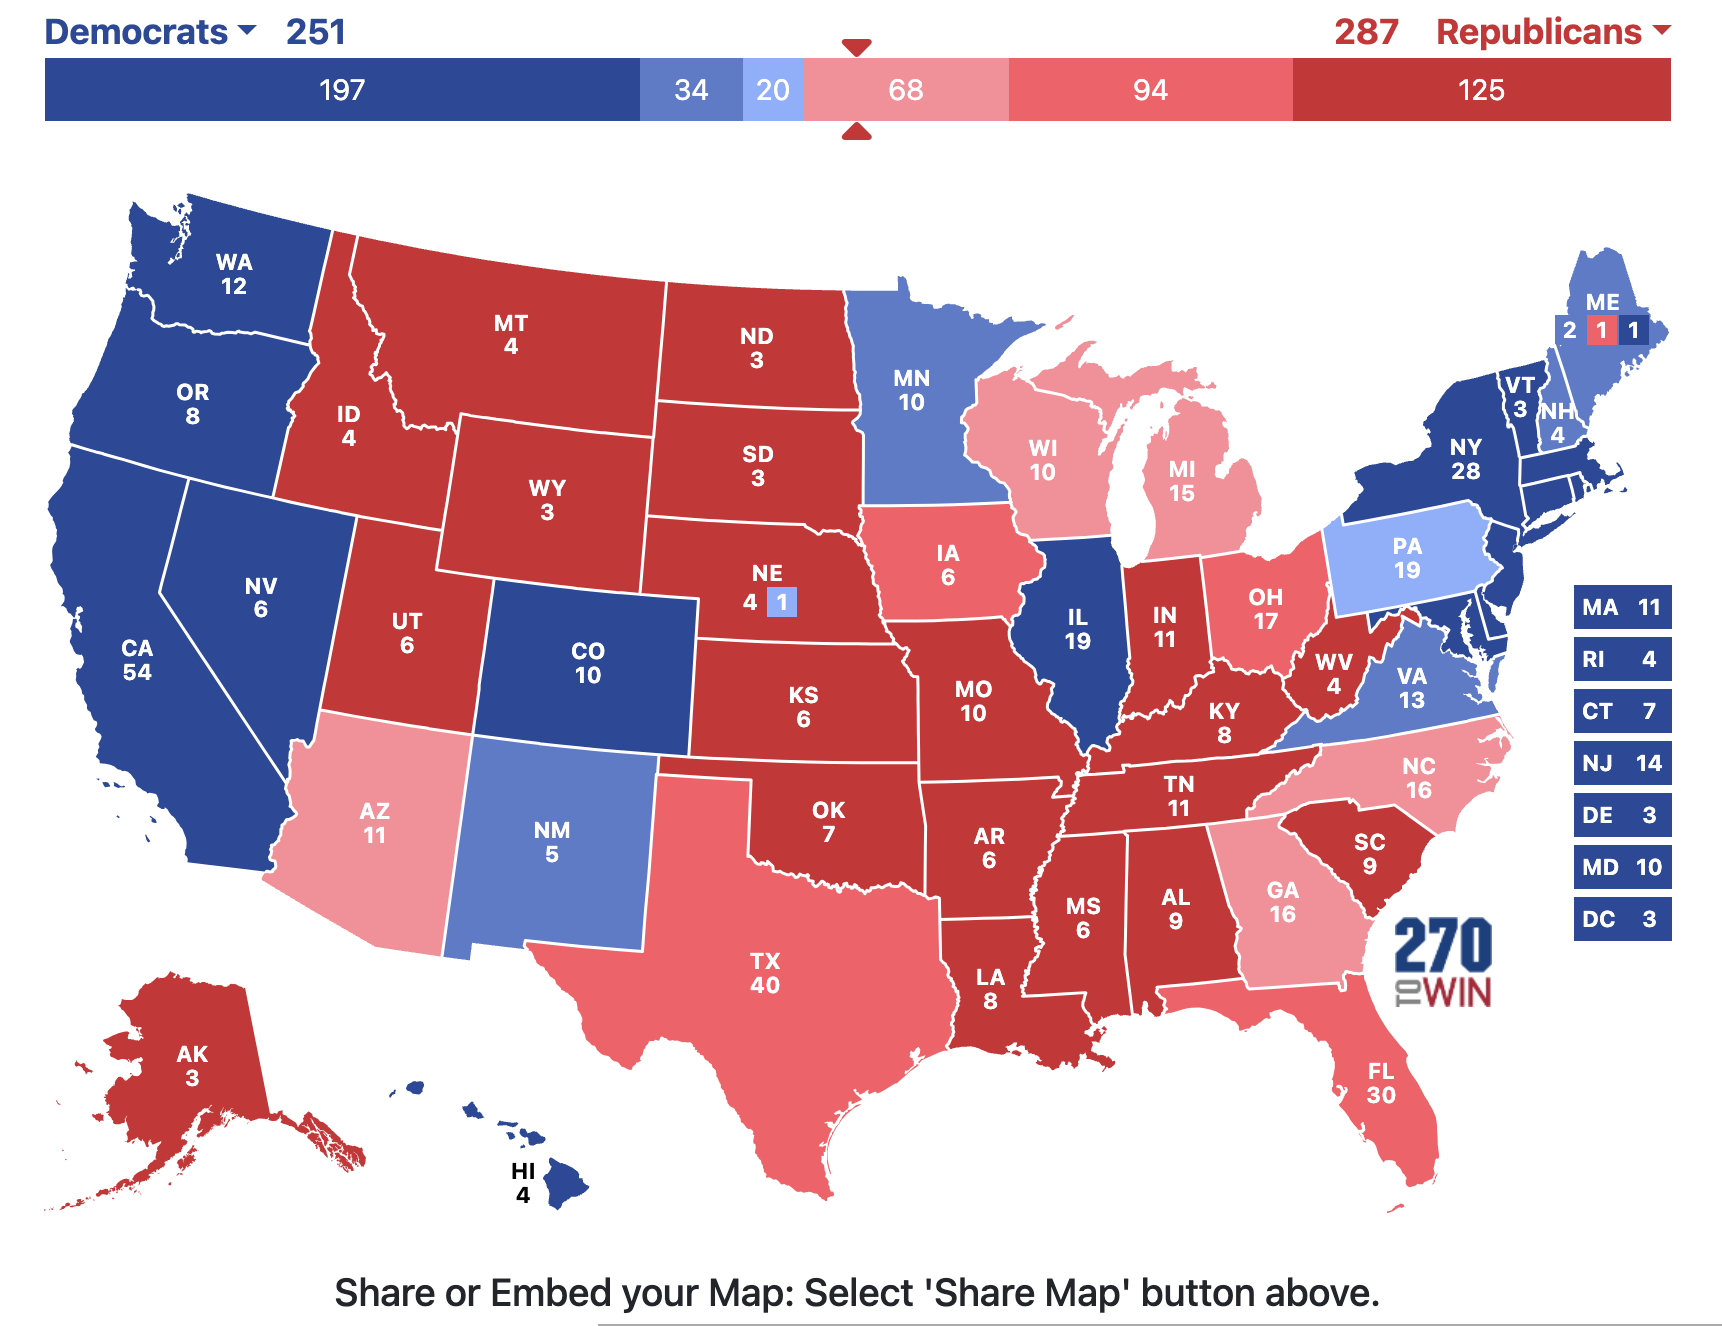
Kamala wins Pennsylvania. Wins the popular vote by 3 points. And loses the election.
What. A. Nightmare.
Cheers.
