Blog Archives
My completely uninformed guide to March Madness and some thoughts on my kaggle entry
I submitted my March Madness Machine Learning Mania today. My two entries consist of picks made using the actual spread for first round games and then a simple Bradley-Terry model for the games past that. In my second bracket, which I called the “aggressive” one, I picks UConn in the men’s bracket and South Carolina in the women’s bracket to win each round (and thus the tournament) with probability 1. So is UConn and South Carolina win, maybe I have a shot at winning. I also manually adjusted two teams on the women’s side (South Carolina and USC). The problem with South Carolina is that they haven’t lost any games and Bradley-Terry basically can’t handle that. I adjusted their regression coefficients to match the market price that they win the tournament. I also adjusted USC on the women’s side because they were way off their market price too. I didn’t make any adjustments to the men’s side because the futures prices were generally in the ball park with what I was estimating (i.e. there are three truly top teams in the men’s bracket (Purdue, UConn, Houston), then a sizable gap down to the next team (which I think is Iowa State. North Carolina got a gift of a 1 seed.)
I’m really excited about the new scoring system for Kaggle this year. And I think they got the scoring system right. A few weeks ago I believe I read that the scoring system was going to be average bracket score with traditional bracket scoring (1-2-4-8-16-32). My first thought when I saw this was that the best strategy is to just enter one bracket and hope. I think other people figured this out and they change it to a Brier score metric. But what they really got right this year is that that don’t take the average over all the GAMES, they take the average over the 6 ROUNDS. This weights the game in the finals much more heavily than a game in the first round, much closer to traditional bracket games.
Anyway, here are some probabilities below are based on my 10000 brackets that I submitted:
To win the championship:
UConn – 29.3%
Houston – 20.9%
Purdue – 19.4%
Iowa St – 5.19%
North Carolina – 4.96%
Tennessee – 3.39%
Marquette – 2.49%
Auburn – 1.94%
Illinois – 1.51%
Baylor – 1.43%
Everyone else < 1%
To make the finals:
UConn – 45.5%
Houston – 34.8%
Purdue – 32.4%
North Carolina – 12.6%
Iowa St – 11.4%
Tennessee – 7..92%
Marquette – 6.51%
Auburn – 5.8%
Illinois – 4.54%
Baylor – 4.34%
Arizona – 3.16%
Alabama – 2.68%
South Carolina – 2.46%
Kansas – 2.31%
Kentucky – 2.13%
Creighton 2.03%
Everyone else < 2%
And finally, here are my pre-tournament rankings 1 through UMass:
| Rank | TeamName |
| 1 | Connecticut |
| 2 | Houston |
| 3 | Purdue |
| 4 | Iowa St |
| 5 | North Carolina |
| 6 | Tennessee |
| 7 | Auburn |
| 8 | Marquette |
| 9 | Illinois |
| 10 | South Carolina |
| 11 | Baylor |
| 12 | Kansas |
| 13 | Utah St |
| 14 | Creighton |
| 15 | Arizona |
| 16 | Duke |
| 17 | Nevada |
| 18 | Kentucky |
| 19 | Alabama |
| 20 | San Diego St |
| 21 | BYU |
| 22 | Florida |
| 23 | Texas Tech |
| 24 | New Mexico |
| 25 | Wisconsin |
| 26 | Gonzaga |
| 27 | Nebraska |
| 28 | Colorado St |
| 29 | Dayton |
| 30 | Clemson |
| 31 | Virginia |
| 32 | Mississippi St |
| 33 | Boise St |
| 34 | Texas |
| 35 | St Mary’s CA |
| 36 | TCU |
| 37 | Drake |
| 38 | Oklahoma |
| 39 | Grand Canyon |
| 40 | Northwestern |
| 41 | Colorado |
| 42 | Texas A&M |
| 43 | Washington St |
| 44 | Indiana St |
| 45 | Pittsburgh |
| 46 | NC State |
| 47 | FL Atlantic |
| 48 | Syracuse |
| 49 | Providence |
| 50 | Michigan St |
| 51 | Oregon |
| 52 | St John’s |
| 53 | James Madison |
| 54 | Seton Hall |
| 55 | Mississippi |
| 56 | Kansas St |
| 57 | Ohio St |
| 58 | Indiana |
| 59 | Princeton |
| 60 | Wake Forest |
| 61 | Cincinnati |
| 62 | Iowa |
| 63 | Butler |
| 64 | Virginia Tech |
| 65 | Villanova |
| 66 | Samford |
| 67 | Richmond |
| 68 | Duquesne |
| 69 | McNeese St |
| 70 | Utah |
| 71 | Memphis |
| 72 | Loyola-Chicago |
| 73 | South Florida |
| 74 | UNLV |
| 75 | Florida St |
| 76 | Boston College |
| 77 | Xavier |
| 78 | UCF |
| 79 | LSU |
| 80 | Georgia |
| 81 | VCU |
| 82 | Minnesota |
| 83 | UAB |
| 84 | Washington |
| 85 | Bradley |
| 86 | San Francisco |
| 87 | Appalachian St |
| 88 | Arkansas |
| 89 | Rutgers |
| 90 | Cornell |
| 91 | Vermont |
| 92 | Miami FL |
| 93 | Col Charleston |
| 94 | Maryland |
| 95 | Penn St |
| 96 | Georgia Tech |
| 97 | St Joseph’s PA |
| 98 | Yale |
| 99 | USC |
| 100 | UC Irvine |
| 101 | St Bonaventure |
| 102 | Santa Clara |
| 103 | George Mason |
| 104 | Massachusetts |
Sweet 16 locks: Florida, Arizona (or Belmont), and Saint Louis
Last year my first round submission to Stat Geek Idol was “Predicting the Sweet Sixteen with a Classification Tree.” My two big suggestions were to 1.) not get overly excited about Florida State or Michigan and 2.) the 14 seeds looked good. Looking back, neither Florida State nor Michigan made it to the Sweet Sixteen, but none of the 14 seeds won any of their games. (Though just about every other seed did including 9,10,11,12,13, and 15. Nearly all the lower seeds EXCEPT for 14.)
So, I was right about some things and wrong about others. You cant win them all. Though I did get one strong endorsement from Tweeter @ClevTA who claims that my classification tree helped him win his pool, besting about 350 other entries. Let’s look at what the classification tree predicts this year.
The first split is based on RPI of 0.6169. Teams above this threshold will be the R groups (right hand side of the tree image below) and teams below the threshold with be the L groups. Overall, in the years used to build the model, teams in the R group advanced to the Sweet Sixteen about 67 percent of the time, whereas teams in the L group advanced just less than 10 percent of the time.
The R group teams this year are Duke, New Mexico, Louisville, Miami (FL), Kansas, Gonzaga, Florida, Indiana, Michigan State, Georgetown, Ohio State, Marquette, Memphis, Syracuse, Arizona, North Carolina, Michigan, Kansas State, Belmont, Saint Louis. All the other teams are in the L group.

The R teams
The R group teams can be broken down into 4 more sub-groups R1-R4. Teams in the R1 group qualify for the Sweet Sixteen about 91% of the time and every single team in the R2 group has qualified for the Sweet Sixteen of in the years used to build the model (2007-2011). On the other hand, teams in the R3 group have only qualified about 51% of the time, and no team in group R4 has qualified for the Sweet Sixteen between 2007 and 2011. So, who’s in each group:
R1 (91.18%): RPI >.643
(2)Duke, (3)New Mexico, (1)Louisville, (2)Miami (FL), (1)Kansas, (1)Gonzaga
R2 (100%): RPI>0.6169 & RPI <0.643 & Opp.Effective.Poss.Ratio<0.9147
(3)Florida, (6)Arizona, (11)Belmont, (4)Saint Louis
Of course all four of these teams can’t make it to the Sweet Sixteen as Arizona plays Belmont in the Second (nee First) round of the tournament.
R3 (51.61%): RPI>0.6169 & RPI <0.643 & Opp.Effective.Poss.Ratio>0.9147 & Avg.2nd.Half.Margin>2.998
(1)Indiana, (3)Michigan State, (2)Georgetown, (2)Ohio State,, (6)Memphis, (4)Syracuse, (4)Michigan,
R4 (0%): RPI>0.6169 & RPI <0.643 & Opp.Effective.Poss.Ratio>0.9147 & Avg.2nd.Half.Margin<2.998
(3)Marquette, (4)Kansas State, (8) North Carolina [Correction: In the original post, I had Marquette and Kansas State in the R3 group. They should be in the R4 group.]
The L teams
L1 (5.34%): RPI < 0.6169 and Assists.Turnovers<1.317
Notables: (5) Oklahoma State, (5) VCU, (5) UNLV, (6) Memphis, (6) Butler, (7) Illinois, (7) San Diego State
Butler and VCU have both advanced to the Sweet Sixteen out of this group before.
L2 (17.86%): First Split RPI < 0.6169 and Assists.Turnovers>1.317 and Opp Pct Pts From 2 >=.5133
(7)Notre Dame, (6)UCLA, (11)Bucknell, (7)Creighton, (9)Temple, (5)Wisconsin
L3 (66.67%): RPI < 0.6169 & Assists.Turnovers>1.317 & Opp Pct Pts From 2 <.5133
(8)Pittsburgh
2011 Results
Teams that Made the Sweet Sixteen in Bold
R1 (5/6): Syracuse, Michigan State, Kentucky, North Carolina, Kansas, Duke
R2 (1/1): Ohio State
R3 (3/7): Marquette, Baylor, Indiana, Missouri, Georgetown, Wichita State, Memphis
L1 (6/45): Wisconsin, Cincinnati, Louisville, Xavier, Ohio, North Carolina State, The remaining 39 teams.
L2 (1/9): Florida, St. Mary’s (CA), Notre Dame, Creighton, Purdue, California, South Dakota State, Belmont, Iona
Cheers.
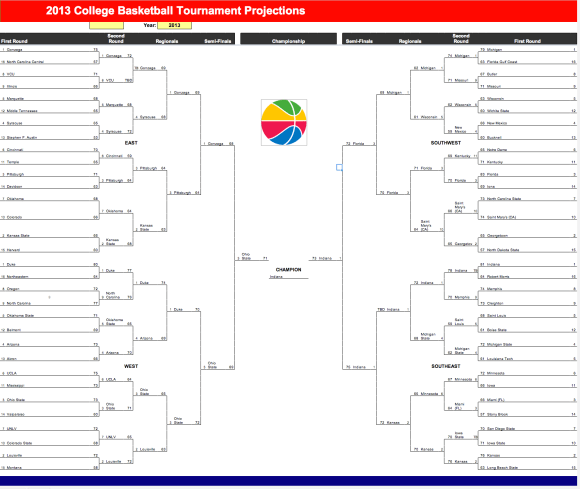
March Madness Projections Updated – March 5, 2013
Number 1 Seeds: Gonzaga, Indiana, Michigan, Duke
Last 4 in: Boise State, Wichita State, Virginia, Stanford
Last 4 out: California, La Salle, Arizona State, Baylor
 Cheers.
