Building an Expected Run Matrix with openWAR
Exploring Baseball Data with R
Most often, we’ll be interested in investigated data from many games. The function getData() will download data over any time interval in which you are interested. Let’s figure out how many home runs were hit on May 14th, 2013.
Visualizing the data
One nice aspect of the MLBAM data is that it contains an (x,y)-coordinate indicated the location of each batted ball hit into play. getData() returns a data.frame of class GameDayPlays. We have written plot.GameDayPlays() function for visualizing hit location data with a generic field overlaid.
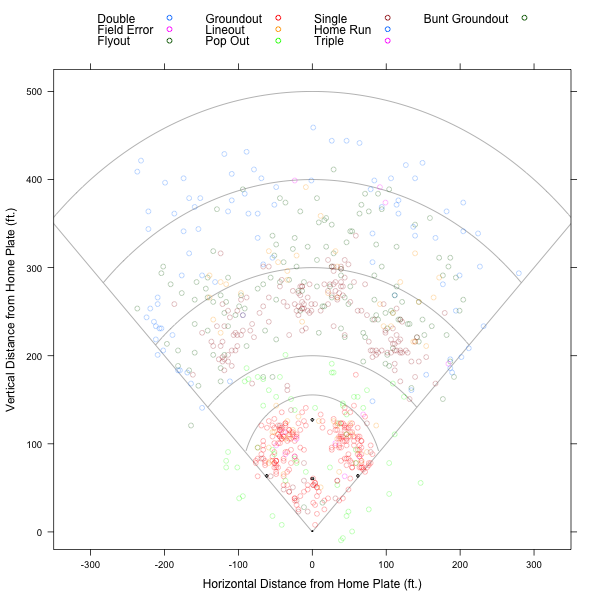
Note that we have done some of the work to normalize the coordinates provided by MLBAM – though there is still more to be done.
Modeling
In order to compute openWAR, we need…
View original post 570 more words
Posted on May 5, 2014, in Uncategorized. Bookmark the permalink. Leave a comment.

Leave a comment
Comments 0