RIPPEN 2016
So a few years ago, I proposed a measure of quarterback performance called RIPPEN, but I haven’t kept up with the updating of it. Today, I had some time so I updated it for the past few years (with some new modifications). Below are the the results ordered from best to worst in 2016.
So right now I have Ryan, Brady, and Prescott as the top three passers in the league. I’d say that makes reasonable sense. One of my favorite parts of this table is Eli Manning, who has dropped in all four years presented here. Poor Eli. Alternatively, you’ll notice that Brady has gotten better in all 4 years listed here. Really amazing. Considering he’s 39 years old. (Side note: I’m 34 and I feel old. This guy is 5 years older than I am and is one of the best athletes on the planet. Dammit.)
|
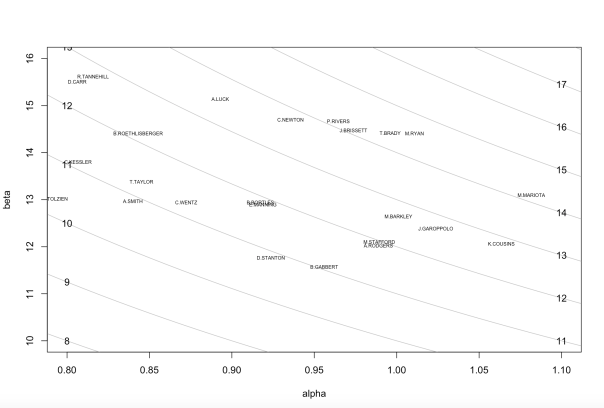
One other interesting aspect of RIPPEN is that you get parameters estimates for the gamma distribution of lengths of completed passed. Below is a plot of the alpha and beta parameters estimated for each player. You may recall from your mathematical statistics course, that the mean of the gamma distribution is alpha times beta. So I’ve plotted lines corresponding to combinations of the parameters that result in the same mean. So for instance, Kaepernick and Luck have about the same expected value for the yardage of a completed pass, but they do it in different ways. There are a bunch of quarterbacks in the middle, so let’s zoom in for a closer look at that part of the graph.

From here, we can see that there seems to be a pretty elite group of quarterbacks with means over 14 including Rivers, Brady, Ryan, and Mariota.
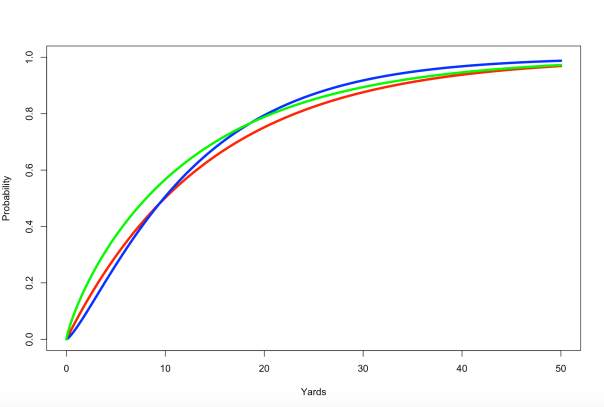
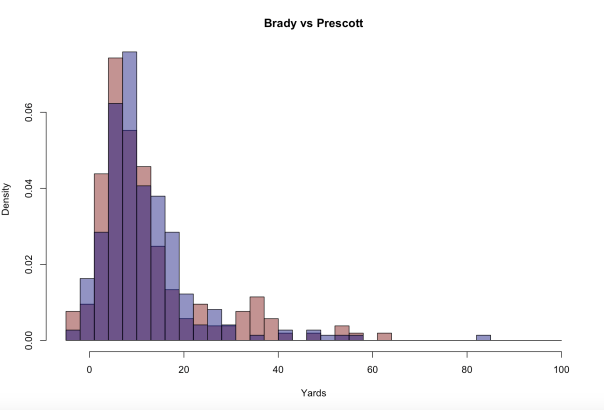
To get an idea of how these parameters change the gamma distribution, let’s look at Prescott, Brady, and Tannehill. The plot below is the cdf function for Prescott (blue), Brady (red), and Tannehill (green). The way this plot is read is for a specific value of yardage, the height of the curve is the probability that a pass is LESS than that specific yardage. So, for instance, Tannehill has the highest probability of a completed pass being less than 5 yards (recall we are only looking at completed passes here). And Brady’s probability is just slightly higher than Prescott’s at 5. However, somewhere around 10 yards Prescott and Brady switch. So Prescott is more likely to have a pass that is less than 20 yards than Brady is (i.e. Brady is more likely to have a completed pass go for long yardage). We can check to see how these estimated curves line up with reality by looking at the histograms of the actual data.
Here Brady is red and Prescott is again blue, we can see that Brady is more likely to have passes in the 0-5 yard range, whereas prescott is more likely than Brady to have passes in the 10-20 range, but then Brady is more likely to have passes in the 30-40 range whereas Prescott has very few completed passes over 30 yards.
Kinds neat stuff. I’m going to do something else now.
Cheers.
Posted on December 23, 2016, in Uncategorized. Bookmark the permalink. Leave a comment.

Leave a comment
Comments 0