The Santa Claus of NFL Wildcard berths is the AFC South (it used to be the NFC North)
With the NFL playoffs coming up this weekend, I got to thinking about the NFL schedule and how that could help or hurt a team trying to make the playoffs. A full half of an NFL team’s schedule is essentially random based on a rotating formula. So, I wanted to look to see if there were any patterns in how these random scheduling assignments affected numbers of wins and a team’s chances of making the playoffs. First an explanation of the NFL schedule.
The NFL schedule is completely determined by a formula. Each team plays:
- 6 games against the teams in their division.
- 4 games against a different division in their conference.
- 4 games against a division in the other conference.
- 2 games against teams in their conference, not in division they are assigned that finished with the same rank in their division.
As an example, the 2016 New England Patriots played the the teams in their division (Bills, Dolphins, Jets) two times each for a total of 6 games. They were assigned the AFC North (Browns, Bengals, Ravens, Steelers) and the NFC West (49ers, Seahawks, Rams, Cardinals). Their two remaining games were against the team that won the AFC South in 2015 (Houston) and the team that won the AFC West in 2015 (Broncos). (The assignment of the divisions within a conference and between conferences are on a 3 and 4 year rotation, respectively, and repeats fully every twelve years.)
I collected data going back to 2002 (when realignment occurred) on all four aspects that make up a team’s schedule: The division they play in, the random division in their conference, the random division in the other conference, and their rank in their division from the previous season.
Some (maybe) interesting things I found:
- Of the 180 teams that made the playoffs in the last 15 years, 51 of the them played the AFC South. This is the most of any division.
- Of the 180 teams that made the playoffs in the last 15 years, 41 of the them played the NFC East and another 41 played the AFC West. This was the least of any division.
- If we look only at wildcard teams in the past 15 years, 21 of the 60 played the AFC South and only 11 were assigned to play the AFC West.
- 20 of the 60 wildcard teams played the NFC North and only 11 of those 60 played the NFC East.
- If we look only at AFC Wildcard teams, 13 of the 30 in the past 15 years played the AFC South, 9 played the AFC North, 5 played the AFC West, and only 3 (!) played the AFC East.

- If we look at AFC Wildcard teams since 2011, 7 out of 12 played the AFC South.
- Of the 30 NFC wildcards teams in the last 15 years, 6 each played the NFC East, South, and West, respectively. However, 12 wildcard teams played the NFC North.

- If we look at NFC Wildcard teams from 2003-2009, 8 out of 14 played the NFC North.

So it looks like the teams that have drawn the NFC North and the AFC South are the divisions that historically have produced the most wildcard teams. In fact in the last six seasons (2011-2016), almost HALF (11/24) of the NFL’s total wildcard teams had the AFC South on their schedule. Not so much recently, but in the late 2000s, the best division to draw was the NFC North. From 2003-2009, 13/28 wildcard teams played the NFC North. In contrast, over that same period, only THREE wildcard teams played the NFC East.
So who played the AFC South this year? The NFC North and the AFC West. Interestingly, both divisions produced a wild card this year (Detroit Lions and Oakland Raiders). And the NFC North? Who played them this year? The AFC South and the NFC East, the latter of which produced a wild card team (New York Giants).
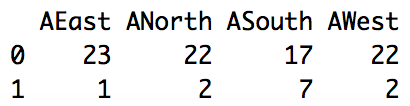
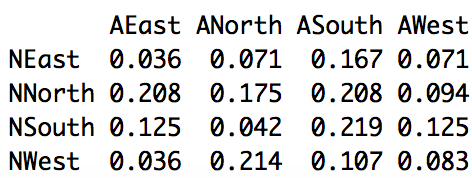
What about AFC and NFC combinations? Below are two tables showing how often each schedule combination has produced a wildcard team. You can see that the combination of AFC and NFC South has produced the highest percentage of playoff teams with 21.9% (7/32) followed by the combination of AFC North and NFC West with 21.4% (6/28). This level of granularity is a little bit interesting, but we are cutting the data up so much I’m not sure there is anything actually significant in the formal sense to be found here. But I still think it’s interesting.

Cheers.
Posted on January 5, 2017, in Uncategorized. Bookmark the permalink. Leave a comment.

Leave a comment
Comments 0