NCAA basketball squares
We all know about Super Bowl squares. But last night my friend asked me to be in an NCAA squares pool. I asked him how it worked and he explained to me that it’s the same as a Super Bowl pool, but you have the same numbers for all 63 games (not the stupid F-ing play-in games). So naturally, I wanted to know what the best numbers were. Here are the results based n data from 1985 – 2021, which is just the data that I happened find on my computer first.
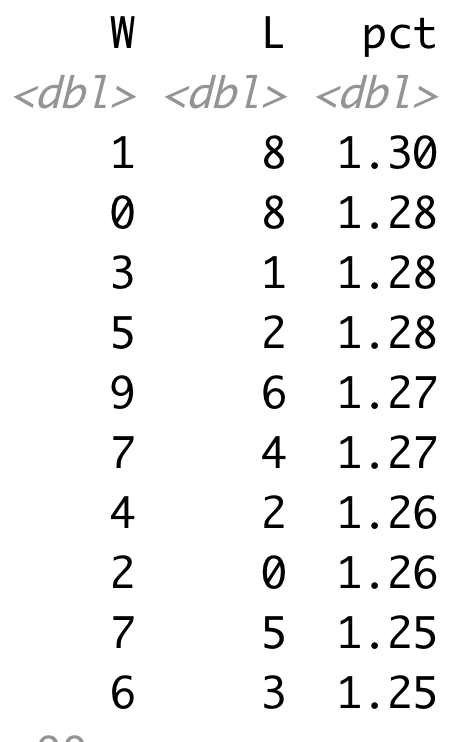
The worst set of numbers are the ones that are the same. Since it’s based on only final score, the only way these numbers will hit if a team wins by exactly 10, 20, 30, etc. Also, note that in the pct column, if all squares were equally likely, the pct should be exactly 1% for every square. So even in the worst case (i.e. 1-1), the percentage isn’t that far off from what you would expect if each square was equally likely.

The best numbers are combinations that are all 2 or 3 digits away with 1-8, 0-8, 3-1, 5-2 and 9-6 being the top five all with probabilities that are essentially the same.

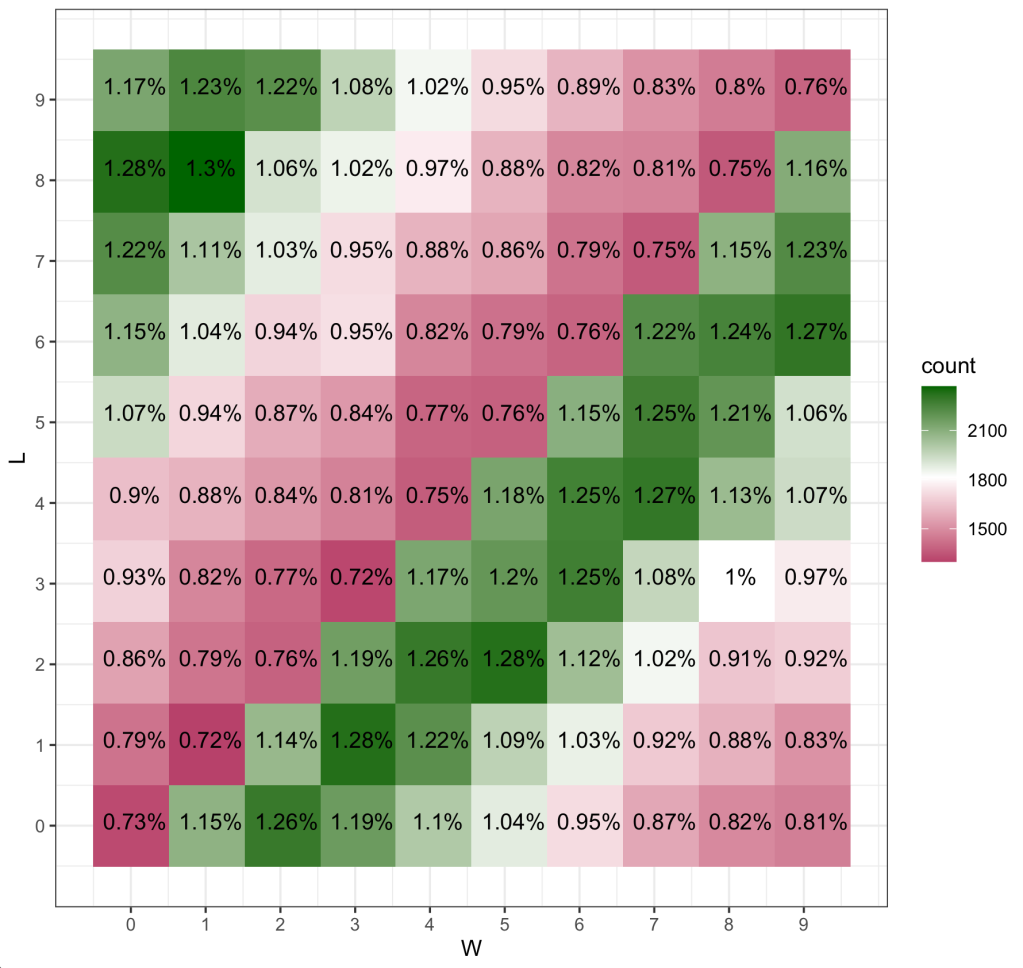
To better see the pattern, I made a 2d histogram for all the scores. Here, red, white, and green indicate combinations that are worse, about the same, and better than 1%. You can see the dark green band running up the diagonal of combinations that are 2 and 3 apart.

And just for comparison sake, here is the same plot with NFL scores:

Happy gambling in March!
Cheers.
Posted on March 13, 2024, in Uncategorized. Bookmark the permalink. Leave a comment.
Leave a comment
Comments 0