Category Archives: Uncategorized
The Cubs are good #hottake
This is the blog post that I would have written after the Cubs 30th game when they were 24-6 if I wasn’t in bed 20 hours a day for the last week with “the sickness”. Anyway, I scraped baseball reference to get the game results of all teams going back as far as they go. First I looked at how may teams had started 24-6 or better in their first 30 games. The list is here:
^ – Lost World Series
* – Won World Series
26-4
Detroit 1984*
25-5
Detroit 1911
Pittsburgh 1902 (No World Series in 1902)
24-6
Chicago Cubs 1907*
Pittsburgh 1921
New York Yankees 1928*
New York Yankees 1939*
Boston 1946^
New York Yankees 1958*
LA Dodgers 1977 ^
Oakland 1981
Chicago Cubs 2016 ?
(Note: Chicago White Sox 1912 (23-6-1))
Prior to the 2016 Cubs, 11 teams since 1902 have started 24-6 or better. In one of those years there was no World Series (1902), so considering the 10 teams that started 24-6 or better and there was was World Series that year, 7 of those teams made it to the World Series with 5 out of those 7 teams winning the World Series. So professionally I’m not saying that the Cubs will make the World Series, but personally I am guaranteeing in.
Next I wanted to to look at the relationship between teams winning % after 30 games and there winning % at the end of the season. The plot below shows a scatter plot of this.

No team has ever finished the season with a winning percentage over .800. The highest winning percentage ever was the 1906 Cubs with a winning percentage of 0.758 (116-36-3). More recently the Mariners in 2001 finished with a winning percentage of 0.716 (116-46).
I also fit a simple linear regression line through the data and the fitted values are as follows (red line on the scatter plot):

This model predicts that the Cubs will win, on average, 103.41 games this year based on their first 30 games with a 95% prediction interval of (84.58, 122.24). That’s probably not that interesting of an interval so I also looked at a 50% prediction interval which ended up being (96.93, 109.89). This means there is about a 50% chance that the Cubs end up with wins in this interval. Further, it also means that there is about a 1 in 4 chance the Cubs end up with fewer than 97 wins, but there is also about a 1 in 4 chance that the Cubs win MORE THAN 110 games.
Cheers.
On soccer’s declining home field advantage
As part of their final assignment in my statistics and sports class, students were tasked with looking at the home advantage in the English Premier League (EPL). In some recent and related work, James Curley and Oliver Roeder found that, by 2014, an EPL home advantage had reached an all time low.
Interestingly, that low reached new depths in 2016.
Home teams have won 40.8% of games this past year, pending this weekend’s final contests. If that mark stands, it would be the lowest in EPL/English Division 1 history, one which dates back to 1888.
Here’s a chart, similar to the one that James and Oliver produced. Overall home team win percentage in each year is shown in black, draw percentage in red, and away win percentage in green. The grey region reflects our uncertainty in the trend curve.

As we knew there’d be, it’s a fairly big drop in win percentage, from roughly 60% to 45% across about 120 seasons…
View original post 729 more words
The NFL draft – where we stand in 2016
Another NFL draft has come and gone, and with it has come the predictable displays of unyielding optimism, stale and arguably race-based generalizations of player skill, and, as a relative newcomer in 2016, lazy misuse of the term analytics.
In following along this spring, it became clear that what is mainstream knowledge among researchers is far from it in the national media. This despite a decent amount of both academic and non-academic research into the topic.
For those new to the scene, or even for a few veterans who may have missed an article or two along the way, I decided to write a quick review of what’s out there. Note that many of the following points are related to one another.
1. Top draft picks are overvalued.
In an efficient market, the value of picks traded between teams would be equivalent. That is, if Pick X was traded for Picks Y and Z…
View original post 1,025 more words
JSM2016 Data Art Show
JSM 2016 will host a Data Art show for the first time at this year’s meeting in Chicago. If you are interested in submitting a piece, please follow the instructions here. Everyone who is interested should submit something for acceptance. And remember “I’m not an artist” is a bad excuse.
If you have any questions to can email artjsm2016@gmail.com
Cheers.

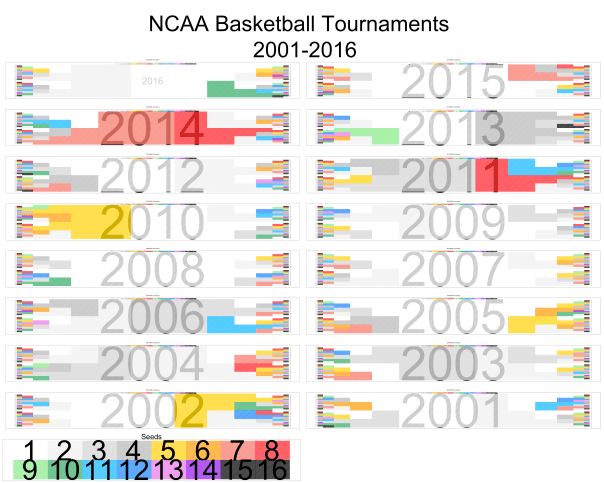


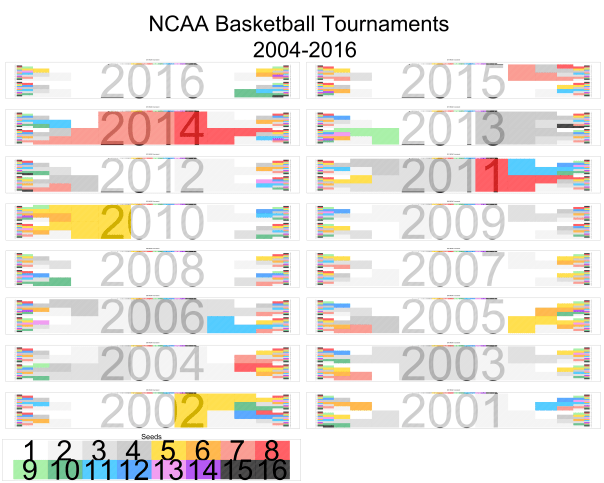
Cinderella Plot: 2001 – 2016
I originally made this plot for the 2012 Stat Geek Idol contest run by Team Rankings, and they are still cool. The original article describing them can be found here. Below I’ve updated the plots for games through March 19th. (For games that haven’t been played yet this year, I’ve assumed the higher seed wins for the sake of the plot.)
Cheers.

NCAA Tournament Field – Who Should be in?
Here are my current picks for teams that should be in the tournament. I’m NOT projecting the field, I’m modeling teams I think should be in.
Cheers.
Last 4 in: Syracuse, Colorado, Michigan, Florida St
First 4 out: Providence, Kansas St, Creighton, Tulsa
Next 4 out: BYU, G Washington, Oregon St, Georgia Tech
1 seeds: Kansas*, Villanova*, Michigan State*, Virginia*
2 seeds: North Carolina, West Virginia, Oklahoma, Miami (FL)
3 seeds: Xavier, Louisville, Kentucky*, Duke
4 seeds: Oregon*, Purdue, SMU*, Arizona
5 seeds: Indiana, Texas A & M, Utah, Maryland
6 seeds: Iowa State, Iowa, Vanderbilt, California
7 seeds: Wichita St*, Baylor, Texas, Seton Hall
8 seeds: Gonzaga*, Butler, St. Mary’s, Pittsburgh
9 seeds: Wisconsin, Cincinnati, Notre Dame, St. Josephs
10 seeds: VCU*, UConn, USC, Texas Tech
11 seeds: Valparaiso*, Florida, South Carolina, Dayton
12 seeds: (Play-In: Syracuse/Florida St), (Play-In: Colorado/Michigan), San Diego St*, Arkansas – Little Rock*
13 seeds: Yale, South Dakota St*, Monmouth*, Hawaii*
14 seeds: Stephen F. Austin*, Chattanooga*, Stony Brook*, UAB*
15 seeds: Ohio*, Grand Canyon*, Weber St*, UNC Asheville*
16 seeds: N Florida*,Texas Southern*, (Play-In:Lehigh*/Austin Peay), (Play-In: Wagner*/Norfolk St*)
* – Indicates projected conference champion, Bold – Indicates actual conference champions
