Category Archives: Uncategorized
Confusing Scotland pie chart
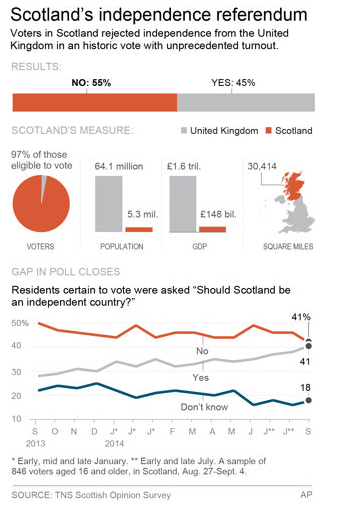
In the graphic below (from this article), the orange represent Scotland and the gray represents the United Kingdom. So in the result bar this make sense: 55% voted for Scotland to be independent and 45% voted to stay in the United Kingdom.
For population and GDP, I think this also makes sense. For instance, the United Kingdom has a population of 64.1 million and Scotland has a mere 5.3 million.
The map of the UK get’s a little bit more confusing. The way this is colored Scotland is clearly the orange here, but it looks like to United Kingdom is only the gray part when, in fact, the UK is both the gray and the orange. I would have made Scotland orange and gray striped to indicate that Scotland is both Scotland AND part of the UK.
Finally, the pie chart. This is a puzzle to me. I’m not really sure what they are trying to say here. Maybe I’m missing something, but it looks like what this is saying is that Scotland, who has a small fraction of the total population of the United Kingdom has a full 97% of the eligible voters and the United Kingdom has only 3%. That’s clearly not true. So what is that pie chart trying to say exactly? I really have no idea. (Please let me know if you know what it is trying to say. I really have no idea.)
But no matter what the answer is, can’t we all agree we shouldn’t be using pie charts at all?
Cheers.
Analyzing the SuperContest
This fall, the Westgate Las Vegas Hotel Casino is hosting the prestigious SuperContest, in which entrants pony up $1500 to pick 5 games a week against the spread. At season’s end, standings are judged by which entrants have the highest number of correctly picked games.
Last year’s winner was David Frohardt-Lane, who took home about $550k for first place. Perhaps not surprisingly, Frohardt-Lane is a statistician!
One of the neat aspects about the SuperContest is that the picks of all 1,403 of the 2014 entrants are posted immediately after the games begin (here). Even better, the data is fairly clean and easy to play with (at least so far).
That said, there are some very intriguing and potentially difficult questions to answer from a statistical perspective: How to account for the fact that people only pick 5 games per week? What about bye weeks? Do entrants pick each week seemingly…
View original post 323 more words
538 is six months old…where does it stand?
Wednesday marks the six-month anniversary of Nate Silver’s FiveThirtyEight launch with ESPN.
As the site mixes statistics, sports, data visualization, and academic research, it’s been a must-read on nearly a daily basis for me.
Here’s my unsolicited and slightly ambiguous view of where things stand:
It’s really, really hard to do what FiveThirtyEight is trying to do and to do it well.
Here’s why:
FiveThirtyEight’s business model is primarily based on advertising, and advertisers generally don’t flock to sites that only spit out content once a week. As a result, Silver and colleagues are forced to put out articles at a frenetic pace. As one example, I estimated that FiveThirtyEight wrote 2.5 articles per day covering the 2014 World Cup, posts which were generally written by only one or two full time writers. That’s an incredible pace.
But here’s the catch; while the judging of a data journalism website should be based on content alone, and…
View original post 1,199 more words
A friend’s thoughts on the NFL
Really at the tipping point with the NFL you guys. It’s a complete blood sport played by barbarians with fake rules that protect no one and make the game less interesting. Never mind the media coverage which treats every story like a reading of The War of the Worlds.- Mike Christman
Well when you put it like that, I guess I’ll have to stop watching the NFL. On the other hand, SPORTS!
Cheers.
Using colorized PNG pictograms in R base plots
Awesome.
Today I stumbled across a figure in an explanation on multiple factor analysis which contained pictograms.

Figure 1 from Abdi & Valentin (2007), p. 8.
I wanted to reproduce a similar figure in R using pictograms and additionally color them e.g. by group membership . I have almost no knowledge about image processing, so I tried out several methods of how to achieve what I want. The first thing I did was read in an PNG file and look at the data structure. The package png allows to read in PNG files. Note that all of the below may not work on Windows machines, as it does not support semi-transparency (see ?readPNG).
View original post 411 more words
NFL Picks – Week 2
Total – SU: 20-12-0 ATS: 18-14-0 O/U: 23-9-0
Week 1 – SU: 10-6-0 ATS: 8-8-0 O/U: 13-3-0
Week 2 – SU: 10-6-0 ATS: 10-6-0 O/U: 10-6-0
Pittsburgh at Baltimore
Prediction: Ravens 23-21 (56.3%)
Pick: Steelers +2.5 (50.8%)
Total: Under 44.5
Miami at Buffalo
Prediction: Bills 22-20 (55.0%)
Pick: Bills +1 (57.8%)
Total: Under 43
Detroit at Carolina
Prediction: Panthers 24-22 (55.1%)
Pick: Lions +2.5 (52.0%)
Total: Over 44
Atlanta at Cincinnati
Prediction: Bengals 25-22 (56.4%)
Pick: Falcons +5.5 (57.8%)
Total: Under 48.5
New Orleans at Cleveland
Prediction: Saints 26-23 (59.3%)
Pick: Browns +6.5 (59.1%)
Total: Over 48
New England at Minnesota
Prediction: Patriots 26-23 (58.8%)
Pick: Vikings +3.5 (51.1%)
Total: Over 49
Arizona at NY Giants
Prediction: Giants 22-19 (57.6%)
Pick: Giants +2 (63.1%)
Total: Under 43.5
Dallas at Tennessee
Prediction: Titans 23-22 (51.7%)
Pick: Cowboys +3.5 (58.3%)
Total: Under 49
Jacksonville at Washington
Prediction: Washington Football Team 25-18 (71.1%)
Pick: Washington Football Team -5.5 (56.5%)
Total: Under 43.5
Seattle at San Diego
Prediction: Seahawks 23-21 (55.4%)
Pick: Chargers +6 (61.5%)
Total: Under 45
St. Louis at Tampa Bay
Prediction: Buccaneers 22-19 (58.3%)
Pick: Rams +5.5 (57.2%)
Total: Over 37
Kansas City at Denver
Prediction: Broncos 27-19 (70.9%)
Pick: Chiefs +13.5 ( 66.1%)
Total: Under 52
NY Jets at Green Bay
Prediction: Packers 25-18 (66.9%)
Pick: NY Jets +8.5 (56.8%)
Total: Under 46
Houston at Oakland
Prediction: Texans 22-20 (57.0%)
Pick: Oakland +3 (51.5%)
Total: Over 39.5
Chicago at San Francisco
Prediction: 49ers 24-19 (63.0%)
Pick: Bears +7 (56.7%)
Total: Under 48.5
Philadelphia at Indianapolis
Prediction: Eagles 24-23 (51.5%)
Pick: Eagles +3 (57.0%)
Total: Under 54
The B1G had a bad Saturday. How bad was it?
The conference formally known as the Big 10 seemingly had one of the worst weekends it could imagine, with most of its football teams either losing on the national stage or struggling against in contests versus perceived lower level opponents.
So how bad was the B1G’s day?
To start, the 13 teams playing (Indiana was off) finished 2-11 against the Las Vegas point spread, with several teams falling well short of the game’s closing number.
Here’s a dot-chart of how each team did, relative to game point spreads. For example, Nebraska, which was favored by 35.5 points over McNeese State but only won by 7, had the conference’s worst day relative to the point spread expectation (-28.5).

On the whole, a conference finishing 2-11 ATS is bad; due to chance, and assuming each game’s ATS result is a coin flip, a sample of 13 games would only produce 2 wins or fewer about…
View original post 572 more words
Neural Networks
Here is a quote I liked from the blog post “Statistics: Losing Ground to CS, Losing Image Among Students”:
(Recently I was pleased to discover–“learn,” if you must–that the famous book by Hastie, Tibshirani and Friedman complains about what they call “hype” over neural networks; sadly, theirs is a rare voice on this matter.)
Cheers.
Genomic Privacy #jsm2014
This is the first of the blog posts in my “backblog” pertaining to #jsm2014.
My dissertation work was in statistical disclosure control and the post-doc work was in genetics. Almost immediately after starting my post-doc, I realized that privacy issues and genetic data seem to go hand in hand. (I recently submitted and R21 to the NIH about using synthetic data to protect privacy in genome-wide association data. It was not funded. I will re-submit.) Anyway, the point is when I saw this session entitled “Genomic Privacy: Risk and Protection Methods”, I absolutely had to go to it. The talks were all fantastic.
The first speaker was Guy Rothblum from Microsoft who was presenting work with Cynthia Dwork on an extension to differential privacy called concentrated differential privacy (CDP).
Here is what they say about CDP in their abstract:
We introduce Concentrated Differential Privacy (CDP), a relaxation of Differential Privacy geared towards improved accuracy and utility.
Like Differential Privacy, Concentrated Differential Privacy is robust to linkage attacks and to adaptive adversarial composition. In fact, it composes as well as Differential Privacy, while permitting (significantly) smaller noise in many setting.
This seems like a good step forward for differential privacy and attempts to address some of the very real issues with the method.
Guy’s introductory slides were a fantastic explanation of the problem at hand and he made a lot of really interesting points. One of the reports he mentioned in his intro slides was the big data review by the federal government. I haven’t finished reading all of this yet, but what I have read is really interesting. Check out the report here: Big Data Review (This report deserves its own blog post.)
Here is a list of some other points that I write down as quickly as I could during his talk:
- Anonymization (removing identifying attributes) does not seem robust in the context of big data. Defeated by the presence of big data. (Netflix Prize as an example of failed anonymization.)
- Concerns 1.) linkage attacks via partial information (ALL adversaries have partial information about us)
- Concern 2.) Composition: Each query is private in isolation, but not necessarily in multiple analyses
- Concern 3.) “Just release statistics”: Attacks include differencing, big band attacks. (e.g. Query 1: How many sickle cell individuals in DB Query 2: How many sickle cell individuals not names Guy Rothblum. Difference of these queries yields the status of Guy Rohtblum.)
- Intuition of differential privacy: “Bad things can happen happen but not because you participate in the data base.”
- Advantages of differential privacy: 1.) quanitifiable 2.) handles linkage attacks/auxiliary data
- Concentrated differential privacy improves the noise addition by an order of magnitude. Better accuracy, mildly relaxed privacy.
- “A social choice must be made” This is a great point. Once we can quantify privacy, which we don’t all agree on yet, we need to have a discussion about how much privacy we want.
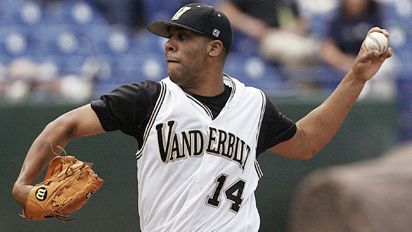
The second speaker was Bradley Malin from Vanderbilt who spoke about “Anonymization of Phenotypic data to support genotype association studies”
Some bullet points from his talk:
- Two quotes I took away from his first few slides were “Hurdle not Fort Knox” and “Possible doesn’t imply probable”. In terms of the first quote my boss always describes this in terms of breaking into a house: Just because it’s illegal to break into someone else’s home, doesn’t mean we don’t lock our doors. But you don’t necessarily need bars on the windows either. We can’t simply rely on the law to deter adversarial data users, but we also don’t need to go over board.
- “Often we use very strong adversary models. But almost perfect results can be achieved…. in the real world. We must be ‘reasonable and practical‘” I am totally guilty of this. A few of my articles on the topic make very strong assumptions about what the adversary knows (often “worst case scenario). My more recent papers are relaxing these worst case scenario assumptions.
- Examples of things that could potentially identify an individual: demographics,diagnosis codes, laboratory, DNA, location visits, movie reviews.
- Malin introduces a procedure named UGACLIP for anonymization in a GWAS setting.
- Malin talked about how stakeholders should some how participate in the decision as to how much privacy they think they should have, but many people have no idea how to interpret the numbers. (i.e. Average person on the street doesn’t have any idea how secure 5-anonymization is)
- When sharing data with NIH the generally accepted value of k (as in k-anonymzation) is 5.
Speaker 3 was Fei Yu of Carnegie Mellon who presented joint work with Stephen Fienberg. Fei spoke about “Scalable Privacy preserivng data sharing methodologies for GWAS.” (Full article on arXiv).
- One of the big privacy concerns of GWAS is that even aggregate statistics from a GWAS (MAF, χ² statistics, regression coefficients) do not provide perfect privacy. Homer et al. (2008) showed that an intruder may be able to infer that someone has participated in a GWAS. This caused the NIH to review its data sharing policy of GWAS data.
- Fei presented work on how to share the top M SNPs (in terms of their significance) and achieve ε-Differential Privacy.
Finally, Hae Kyung Im of the University of Chicago spoke about the “On Sharing Quantitative Trait GWAS Results in an Era of Multiple-Omics Data and the Limits of Genomic Privacy“. Since I am now a resident of the midwest, I meant to try to meet Hae Kyung Im, but at the end of the session I bumped into someone else and ended up missing her (this happens all the time at JSM. You try to do one thing, but then you bump into someone you haven’t seen in 5 years.)
- “For full advantage, broad sharing of data of results is needed; Must be careful about privacy.” I totally agree with this. There is so much potential benefit to sharing this type of data that we can’t just lock it up in a database and throw away the key.
- “Summary studies are considered safe, BUT with GWAS studies we may have millions of SNPS”. With big data our previous ideas about what is safe to release need to be re-avaluated. She again cited Homer et al. (2008) noting based on that article: Even if the DNA sample was a mixture of 1000 or more individuals, they were able to determine with high accuracy whether they were in the sample or not. This is “Great for forensics, but has consequences fro GWAS”.
- The question she posed in terms of GWAS is basically “Can we publish regression coefficients?” I was going to try to summarize her results, but I can’t interpret what I wrote about her results, so I’ll just wait until I get her slides. (I tweeted (Twitter is awesome) at her, hopefully she will be kind enough to share them.)
A discussion then ensued, which led Stephen Fienberg to make (roughly) the following statement:
I think that there is a misconception. In very high dimensional problems as in GWAS with the auxiliary data every individual is unique. You must find something to share. We cannot go on saying we can’t share anything. If I were on your IRB there is no issue with the faculty doing this. The only issue is what do they publish on what they have done. And I don’t think there is an IRB that understands how to do that in the entire country.
One final thought: I was struck by how few people were in this session. This will be is already a big deal. Right now with just a single hair, someone can reproduce your face up to a family resemblance. Who knows what we’ll be able to do in 5, 10 or 50 years? Privacy is a big deal.
Cheers.
