Category Archives: Uncategorized
Building an Expected Run Matrix with openWAR
Exploring Baseball Data with R
Most often, we’ll be interested in investigated data from many games. The function getData() will download data over any time interval in which you are interested. Let’s figure out how many home runs were hit on May 14th, 2013.
Visualizing the data
One nice aspect of the MLBAM data is that it contains an (x,y)-coordinate indicated the location of each batted ball hit into play. getData() returns a data.frame of class GameDayPlays. We have written plot.GameDayPlays() function for visualizing hit location data with a generic field overlaid.
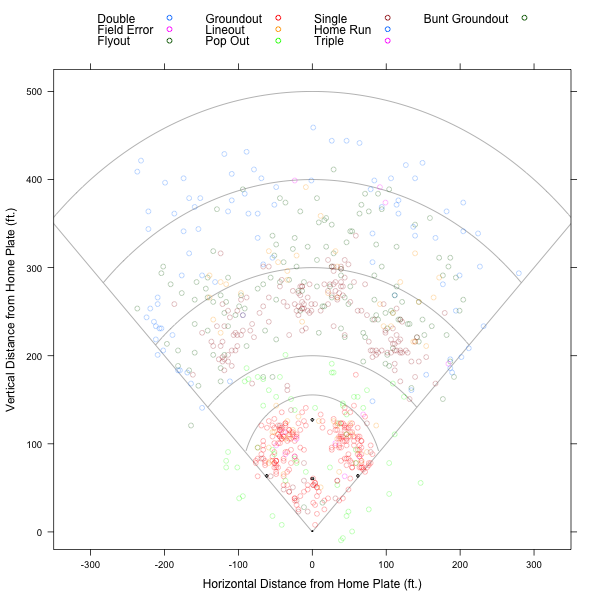
Note that we have done some of the work to normalize the coordinates provided by MLBAM – though there is still more to be done.
Modeling
In order to compute openWAR, we need…
View original post 570 more words
On NHL Game 7’s
Three NHL Game 7’s are scheduled for tonight, so I figured I’d run some Game 7 numbers.
For this analysis, I used both numbers via AC Thomas’ nhlscrapr package (provided by Thomas himself), and also penalty data that I collected a few years back, summarized in a paper here, a recent article here, and published in International Journal of Sport Finance.
What’s different about Game 7’s?
For starters, there are far fewer penalties.
On average, teams combine for about 9.4 penalties (excluding matching majors) in playoff Game’s 1 through 6, but just 7.0 in Game 7s. This could be the result of changes in style of play, or due to referees being less inclined to assert themselves into the game.
In terms of win percentage, going back to 2002, home games have won 57% of Game’s 1 through 6, and 52% of Game 7s. Here’s a chart…
View original post 275 more words
Momentum and hockey
Actually, it both exists and doesn’t exist simultaneously!
Perhaps Rocco Mediate sums it up this debate best, saying
“As any athlete knows, momentum is the most unstoppable force in sports. The only way to stop it is if you get in your own way, start making stupid mistakes, or stop believing in yourself.”
Okay then.
What to make of all of this? What is the best research that has been done?
Quantifying momentum is a difficult and arduous task for any researcher, the naive of whom (such as coaches and media members) use anecdotal evidence to drive discourse. Alternatively, there can also be a tendency to use arbitrary cutpoints (i.e., the last five games, or the last 10 plays) when describing momentum, which is also less than ideal.
Before I try to quantify momentum, I…
View original post 984 more words
Comparing Top NBA Draft Prospects To Recent Rookies
With the NBA playoffs now in full swing and 2014 already looking like one of the most entertaining postseasons in recent memory, many basketball fans are focused squarely on the best teams in the league. But for those of us who love the college game, follow teams that didn’t make the playoffs, or simply enjoy all things NBA, it’s also time to start giving a serious look at the upcoming NBA draft, which just might feature the deepest pool of young talent we’ve seen in a decade.
In analyzing players in the draft, people have a tendency to focus on two main things: which teams the players fit with and which NBA stars it’s easiest to compare the players to. However, at this stage, both of these ideas offer false and/or incomplete evaluations of the incoming players. Comparisons to NBA stars are often hasty and result in unfair expectations. Also, pairing players with teams is somewhat pointless when we don’t even know for sure which teams will be drafting in which spots! So instead of looking too far ahead, here’s a look at how the top three prospects compared to recent rookies coming into the league, from a statistical standpoint.
Andrew Wiggins
Viewed by many analysts and fans alike as the biggest talent to enter the NBA Draft since Lebron James, Andrew Wiggins has slipped a bit over the course of the season. In his one year at Kansas, Wiggins didn’t quite dominate the college ranks the way many expected. Although his potential remains enormous, he’s considered by some to be less “NBA-ready” than fellow top prospects like Jabari Parker. But which recent rookie offers the best glimpse of what we might expect from Wiggins? Here’s an eerily close player comparison, courtesy of Sports-Reference:
- Player A: 17.1 ppg, 5.9 rpg, 1.5 apg, 44.8 FG%, 34.1 3p%
- Player B: 17.1 ppg, 5.2 rpg, 1.1 apg, 44 FG%, 35.8 3p%
By the look of those stat lines, Wiggins may not be as unique as we all assumed for a player coming out of college! Player A is Andrew Wiggins (6’8, 200 lbs) in his first and final season at Kansas, and Player B is Harrison Barnes (6’8, 215 lbs) in his last season at North Carolina. Now, Barnes has become a very strong role player for the Golden State Warriors and is even in the midst of helping them through a grueling series against the Clippers. In fact, according to online sports site/betting platform Betfair, the Warriors now have a 6/4 shot of winning this series (a better chance than when the series started). It goes without saying that his 10.5 ppg during the series have been an enormous contribution.
Overall, however, given that he too was once called the best prospect since Lebron James, Barnes’s career to this point has been mildly disappointing. It’s also fair to note that the stat line provided for Barnes came in his sophomore year, indicating Wiggins was better earlier than Barnes. But given similar levels of competition in college, in the Big 12 and ACC, these are very similar stat lines. Throw in similar sizes, similar positioning (though Wiggins is more of a 2/3 combo, and Barnes perhaps more of a 3/4), and reliance on strong shooting and exceptional athleticism, and Barnes may be a player to watch when projecting Wiggins.
Jabari Parker
Right alongside Wiggins as a top prospect is Duke’s Jabari Parker, a Wooden Award finalist who unquestionably had the strongest season among the freshmen in the draft. Parker is viewed as a once-in-a-generation offensive talent who will need to improve on his defense and likely get in better shape. However, people have gotten so caught up in comparing him to Paul Pierce and Carmelo Anthony that there’s virtually no comparison out there to a recent rookie. So how about this one:
- Player A: 17.5 ppg, 9.2 rpg, 1.2 apg, 51.9 FG%, 40.0 3p%
- Player B: 19.1 ppg, 8.7 rpg, 1.2 apg, 47.3 FG%, 35.8 3p%
In this instance, Player A is Jared Sullinger (6’9, 265 lbs) in his final season at Ohio State before becoming a forward for the Boston Celtics, and Player B is Jabari Parker (6’8, 235 lbs) in his lone season at Duke. If this doesn’t seem like as strong a comparison as the Wiggins-Barnes one, it’s because it isn’t, and that’s a positive indication for Parker. Sullinger has been good in the NBA, but he’s a role player—Parker has star potential. Sullinger compiled this stat line as a sophomore and the only real star on his college team, whereas Parker did it playing largely out of position on a Duke team loaded with offensive weapons. The 3p% numbers are skewed somewhat as well, given that Sullinger shot only 40 three pointers that year, and Parker put up 106 at Duke. In this case, it seems as if NBA player comparisons may be more appropriate, because Parker is simply unlike any player to come out of college in recent years.
Joel Embiid
The lanky Kansas center might be the trickiest prospect of all to project, because analysts are relying on his potential as much has his proven game. If he meets that potential, many are seeing Embiid as something similar to a Hakeem Olajuwon talent, which is high praise to say the least. But we’ve seen outlandish predictions for tall, coordinated shot blockers with “raw talent” before, and they’re often dubious. However, here’s a player comparison that gives the support for Embiid as a top pick some sturdier legs:
- Player A: 10.0 ppg, 7.6 rpg, 0.4 apg, 2.7 blk, 53.8 FG%
- Player B: 11.2 ppg, 8.1 rpg, 1.4 apg, 2.6 blk, 62.6 FG%
Player A is current Detroit Pistons standout Andre Drummond (6’10, 270 lbs) in his only season at Connecticut, and Player B is Embiid (7’0, 250). Now, these two are very different players, with Drummond relying on his heftier body as the foundation of a more powerful game, and Embiid playing with more touch. Yet against relatively similar levels of competition in the Big East (before it was broken up) and Big 12 respectively, Drummond and Embiid put up similar stats. Embiid did it after not starting the first half of the season, and while dealing with a back injury and a more talented roster of teammates.
Given Drummond’s early success, this is an exciting indication for Embiid, though again, the two play very differently on the court. CBS Sports recently profiled Embiid as arguably the best center prospect in a decade. However, he is still somewhat raw, he doesn’t have the playing experience of most prospects and his back injury could be cause for concern. If he lives up to potential, though, we’ll see that Embiid is more than just another tall, long project.
So we entered a Kaggle contest…
…and we won.
The website Kaggle sponsored a March Machine Learning Mania contest over the last few months, which involved picking probabilities for every hypothetical NCAA 2014 tournament game.
Points were awarded, or taken away, given how well each submissions’ probabilities fared, relative to everyone else in the pool (for my statistics-oriented readers, it used the loss function from logistic regression). So, if you picked Florida over Albany with probability 0.80, while Florida won, you would’ve lost ground because the majority of entries had the Gators winning with roughly a 95% probability. Meanwhile, if you picked Ohio State over Dayton with probability 0.55, the Dayton win would’ve helped your entry out, with most folks having OSU as a roughly 80% favorite.
Kaggle was kind enough to release histograms of the picks for all submissions, like these ones for the Elite 8 games here (alongside our eventual submissions):

For example, in the top left, the average…
View original post 352 more words
Job news
Big news! I have accepted an assistant professor position in the Department of Mathematics at Loyola University Chicago. Everything is now official and me, my wife, and the dogs will be moving to Chicago in August.
Cheers!

Stepwise Variable Selection
Im my regression class that I am teaching, we recently got to the topic of variable selection. We covered the standard forward, backwards, and stepwise selection procedures, and I then went out of my way to caution them about using these procedures. In trying to explain this to them, I believe that I have come up with a fantastic analogy for explaining this to students:
Automated variable selection techniques are like putting together the border of a puzzle: It’s a great place to start, but you’ve still got a long way to go to be finished. -StatsInTheWild
Cheers.
Paying NCAA players
What if I set up an organization that collected money for college basketball players and then paid them out when they left the NCAA. It would work like this:
- An account is set up for each player in the NCAA.
- Fans can donate to a player or an entire team.
- Once a player leaves the NCAA, I write them a check for the full balance of their account. They can do whatever they want with the money.
Not that I would, but how could the NCAA stop me from doing this?
Cheers.
Hadoop
From this article:
However, Cukierski thinks that the use of big data has become too trendy. “The whole big data idea is really within a big hype cycle,” mainly driven by a particular software framework for dealing with information, called Hadoop. “It’s not that Hadoop isn’t useful,” Cukierski says, but when companies look to it to solve small problems, “the people who are data scientists and actually statistically literate are kind of laughing, because you don’t need Hadoop to do most problems.”
Cheers.
