Introduction
I recently wrote an article about Football Outsiders flawed argument about NFL place kickers. The Football Outsider’s people responded, and I wrote a rebuttal here. The original piece from Football Outsiders that sparked my interest in this topic is below:
Field-goal percentage is almost entirely random from season to season, while kickoff distance is one of the most consistent statistics in football.
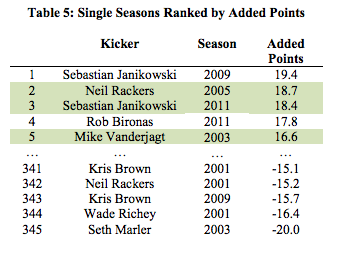
This theory, which originally appeared in the New York Times in October 2006, is one of our most controversial, but it is hard to argue against the evidence. Measuring every kicker from 1999 to 2006 who had at least ten field goal attempts in each of two consecutive years, the year-to-year correlation coefficient for field-goal percentage was an insignificant .05. Mike Vanderjagt didn’t miss a single field goal in 2003, but his percentage was a below-average 74 percent the year before and 80 percent the year after. Adam Vinatieri has long been considered the best kicker in the game.But even he had never enjoyed two straight seasons with accuracy better than the NFL average of 85 percent until 2011, when he followed up his 26-for-28 2010 campaign by going 23-for-27 (85.2 percent).
On the other hand, the year-to-year correlation coefficient for kickoff distance, over the same period as our measurement of field-goal percentage and with the same minimum of ten kicks per year, is .61. The same players consistently lead the league in kickoff distance, particularly Billy Cundiff, Olindo Mare, and Stephen Gostkowski.
“NFL Kickers Are Judged on the Wrong Criteria,” New York Times, November 12, 2006
Pro Football Prospectus 2007, Arizona chapter
The basic gist of the NY Times article is that kickers are inconsistent from year to year and the argument is based solely on field goal percentage made. There are two major flaws that I perceive in this argument. The first is that they don’t control for any covariates that would affect variability such as the most obvious predictor, distance of the field goal attempt. (I see that Football Outsiders is controlling for length of kick when they are calculating DVOA, but I’m still not convinced they controlled for distance when making the statement that “Field-goal percentage is almost entirely random from season to season”.) The second is that I don’t think FO is making a distinction between the actual percent of field goals made by a given kicker and the probability of a given field goal kicker making a field goal. For example, let’s say a given kicker kicks 40 field goals per year all from the same distance and the probability of success on every field goal is the same at 0.8. Here is what ten simulated seasons look like under these conditions:
rbinom(10,40,0.8)/40

[1] 0.925 0.825 0.875 0.775 0.800 0.825 0.750 0.875 0.700 0.875
You can see that the kicking percentage for this kicker has quite a bit of variability. In their first season they made 92.5% of their kicks and then in their ninth year they made only 70% of their kicks. But their ability over these ten years was exactly the same. The differences in the field goal kicking percentages is completely due to random chance even though their ability was constant. So, we aren’t so interested in answering the question of whether or not kickers field goal percentages change from year you year; That’s essentially a meaningless question. We’re interested in whether or not the probability that a kicker will make a field goal, their ability, changes from year to year.
So I agree completely with the statement that “Field-goal percentage is almost entirely random from season to season”. But again that doesn’t really mean anything. The question that I think we’re really interested in here is “Does the ability of a place kicker change significantly from year you year?” It seems like FO was trying to answer this question by comparing field-goal percentages, but they really should have been asking whether the probability of making a kick for a given kicker varies from year to year.
I’m going to explore this using mixed effects logistic regression modeling to look for evidence of variability in kickers abilities from year to year.
Analysis
To begin this analysis I needed to collect some data. I collected data from www.pro-football-reference.com in their box scores. My full scraping code can be seen at the end of this post in the appendix or viewed on github here.
summary(kick.dat$yards)
#Min. 1st Qu. Median Mean 3rd Qu. Max.
#18.00 28.00 37.00 36.37 45.00 76.00
table(kick.dat$good)
#0 1
#1610 7273
table(kick.dat$year)
##2011 2010 2009 2008 2007 2006 2005 2004 2003
##1053 997 968 1038 993 990 986 892 966
tapply(kick.dat$good,kick.dat$year,mean)
##2011 2010 2009 2008 2007 2006 2005 2004 2003
##0.8309592 0.8224674 0.8057851 0.8448940 0.8257805 0.8202020 0.8103448 0.8082960 0.7960663
I collected data from 2003-2004 through 2011-2012 season. The median length of field goal attempt over this period of time was 37 yards. 8,883 total field goals were attempted (987 per year on average) of which 81.88% of attempted field goals over this period of time were converted. It also appears field goal success percentage is trending upwards over the course of these 9 years. This could easily be explained if the mean length of field goals was getting smaller over the course of these nine years, but based on the box plot below, it does not appear that there is a trend of field goal distance getting shorter on average.

Models
I built a logistic regression model with the outcome 0/1 for missed/made field goals. I initially included only a fixed for distance of the field goal (actually square root of distance), but after some exploration, I also needed to include a dummy variable for the the year. This means that as a whole for all kickers, the baseline probability of making a field goal is significantly different from season to season. Next, I added a random effect for kicker and another random effect for kicker by year. The first random effect assesses the different abilities of kickers in the NFL and the second random effect assesses the difference in abilities between years for a given kicker. If this second random effect variance estimate is large, that indicates evidence that kickers abilities are actually different from year to year. The output from this model appears below.
Generalized linear mixed model fit by maximum likelihood ['glmerMod']
Family: binomial ( logit )
Formula: good ~ I(yards^0.5) + year + (1 | name) + (1 | name:year)
Data: kick.dat

AIC       BIC    logLik  deviance
7237.243  7322.346 -3606.622  7213.243

Random effects:
Groups    Name        Variance  Std.Dev.
name:year (Intercept) 8.690e-11 9.322e-06
name      (Intercept) 4.317e-02 2.078e-01
Number of obs: 8883, groups: name:year, 352; name, 78

Fixed effects:
Estimate Std. Error z value Pr(>|z|)
(Intercept)   9.91805    0.30610   32.40  < 2e-16 ***
I(yards^0.5) -1.32140    0.04445  -29.73  < 2e-16 ***
year2010     -0.13349    0.12694   -1.05  0.29297
year2009     -0.28794    0.12606   -2.28  0.02236 *
year2008      0.02418    0.12908    0.19  0.85141
year2007     -0.17933    0.12834   -1.40  0.16232
year2006     -0.25091    0.12796   -1.96  0.04991 *
year2005     -0.30528    0.12727   -2.40  0.01646 *
year2004     -0.31881    0.13116   -2.43  0.01507 *
year2003     -0.35993    0.12817   -2.81  0.00498 **
---
Signif. codes:  0 ‘***’ 0.001 ‘**’ 0.01 ‘*’ 0.05 ‘.’ 0.1 ‘ ’ 1
Results
Below is a plot of the probability of making a kick by distance of the kick. Each line represents a different season with the blue curves representing the more recent years 2007-2011 and the red curves are for the seasons 2003-2006. So it looks like, on the whole, kickers in the NFL are getting better (This Sloan paper reaches the same conclusion).

Next let’s look at how much variability there is within kickers between years. The plot below displays the probability that a fixed kicker will make a kick based on the distance of the field goal when a fixed effect for year is NOT included in the model. The red and blue lines represent the 5th and 95th percentile of the distribution of the probability for a kicker between years. This means that there IS variability in the ability of a kicker from year to year when not including a fixed effect of year, but this variability is relatively small. However……

If a fixed effect of year is included in the model the standard deviation estimate for the random effect of year by kicker is 9.322e-06. The plot below is the same as the one above, but a fixed effect of year is included here. The red and blue lines represent the 5th and 95th percentile of the distribution of the probability for a kicker between years. From this plot, you can see that there is almost no difference within a kicker between years. This variability is almost entirely explained by the group improvement in all of the kickers in the NFL.
 Conclusions
- There is evidence there is considerable variability between the abilities of NFL kickers.
- The variability that kickers seem to exhibit from year to year does not seem to be within kickers, it seems to be that kickers are getting better from year to year. When you control for this group improvement there is ALMOST NO detectable variability in the ability of kickers from year to year.
- Kickers as a whole seem to be getting better over time.
- 2008 was an especially good year for kickers. Almost 84.5% of field goals were made.
Appendix
If you are interested in my scraping code you can see it below or on github here.
library(XML)
#Define function for getting kicking data
get.x<-function(date,team){
	url<-paste0("http://www.pro-football-reference.com/boxscores/",date,"0",team,".htm")

x<-readHTMLTable(url,header=FALSE)$pbp_data

x<-x[x$V1!="",]

x<-as.character(x$V6)

x<-x[!is.na(x)]

out<-x[unlist(gregexpr("field goal",x))>0]
out}

#get.x('20120930',"atl")

#Getting the data
month.hash<-list()
#month.hash[['08']]<-31
month.hash[['09']]<-30
month.hash[['10']]<-31
month.hash[['11']]<-30
month.hash[['12']]<-31
month.hash[['01']]<-31
month.hash[['02']]<-29

#kick.list<-list()
year<-"2012"
t.vec<-c("gnb","phi","htx","nor","crd","den","cle","min","tam","chi","nyj","oti","rav","rai","nyg","ram","was","buf","kan","clt","car","sea","mia","sfo","sdg","dal","pit","nwe","jax","atl","det","cin")
	for (yearmonth in c(paste0(year,c("09","10","11","12")),paste0(as.character((as.numeric(year)+1)),c("01","02")))){
			#for (yearmonth in c("201109","201110","201111","201112","201201","201202")){
	month<-substring(yearmonth,5,6)
for (day in c(paste0("0",c(1:9)),as.character(c(10:month.hash[[month]])))){
	for (t in t.vec){
		d<-paste0(yearmonth,day)
			print(c(year,yearmonth,day,t))
			tmp<-try(get.x(d,t))
			print(tmp)
			if (class(tmp)!="try-error"){kick.list[[year]][[paste0(d,t)]]<-tmp}
				}
				}}

make.kick.df<-function(year){
kick.vec<-c(unlist(kick.list[[year]]))
#remove '(no play)'
kick.vec<-kick.vec[unlist(gregexpr('(no play)',kick.vec))<0]

#pull out yardage
yards.index<-unlist(lapply(gregexpr('[0-9]',kick.vec),min))
yards<-substring(kick.vec,yards.index,yards.index+1)

#Pull out kicker name
name<-gsub(" ","",substring(kick.vec,1,yards.index-2))

#Did they make it?
good<-yards
good<-0
good<-(unlist(gregexpr("field goal good",kick.vec))>0)+0

out<-data.frame(name,yards,good,year=year)
out
}
kick.df<-list()
kick.df[['2012']]<-make.kick.df('2012')
kick.df[['2011']]<-make.kick.df('2011')
kick.df[['2010']]<-make.kick.df('2010')
kick.df[['2009']]<-make.kick.df('2009')
kick.df[['2008']]<-make.kick.df('2008')
kick.df[['2007']]<-make.kick.df('2007')
kick.df[['2006']]<-make.kick.df('2006')
kick.df[['2005']]<-make.kick.df('2005')
kick.df[['2004']]<-make.kick.df('2004')
kick.df[['2003']]<-make.kick.df('2003')
kick.df[['2002']]<-make.kick.df('2002')
kick.df[['2001']]<-make.kick.df('2001')
kick.df[['2000']]<-make.kick.df('2000')
#save.image("Kick_Database.RData")

kick.dat<-do.call(rbind,kick.df)
kick.dat$yards<-as.numeric(as.character(kick.dat$yards))
#write.csv(kick.dat,"kick_dat.csv")