Category Archives: Uncategorized
Do your RRRRR homework
One of my students tweeted this at me today. I think it is awesome. But I suppose this also means they aren’t paying attention to me. But still, this is awesome. So I guess it’s ok that they aren’t paying attention if they are creating brilliant images like this.

Argggghhhhhhh and Cheers.
Stat Pundit Rankings: MLB win over-unders
About two weeks ago, I used some familiar metrics to analyze how analytics-based websites performed as far as predicting MLB win totals. With the regular season now complete, winning bets have been cashed, and the official performance for each site is listed below:
O/U: The Hilton’s over/under for each team
BP: Baseball prospectus
TR: Team Rankings (caveat on the linked page: the site stresses their MLB predictions are a work in progress)
DP: Davenport
Zips: ZIPS projection system (espn.com)
PM: Prediction Machine
TB: Trading bases, an avid blogger and book-writer
Here are my metrics
MSE: Averaged squared error between the prediction and the win totals (lower is better)
MAE: Averaged absolute error between the prediction and the win totals (lower is better)
Corr: Correlation between the predicted and the win totals (higher is better)
Results
| O/U | BP | TR | DP | Zips | PM | TB | |
| MSE | 82.65 | 74.40 | 98.60 | 85.43 | 87.53 | 94.27 | 71.53 |
| MAE | 7.37 | 7.33 | 8.40 | 7.37 | 7.40 | 7.86 | 6.93 |
| Corr | 0.66 | 0.70 | 0.58 | 0.64 | 0.64 | 0.59 | 0.71 |
Baseball Prospectus and Trading Bases appear to offer the only clear advantage over the Las Vegas line, at least among these predictions, as judged by a higher correlation and a lower MSE between observed and predicted values. On average, TB was the only prediction site to finish, on average, within seven wins of the actual results.
A savvy bettor would’ve finished 12-9 on bets where BP differed by the Las Vegas O/U by more than two wins, and 10-6 using the same cutoff for TB. Picks that BP and TB agreed (by more than 2 predicted wins) on finished 7-4
Here are the Vegas lines and each site’s picks. In some cases, the projected total wins might not add up to 82 per team, most likely due to rounding errors.
| Team | O/U | BP | TR | DP | Zips | PM | TB | Actual |
| Diamondbacks | 82.5 | 85 | 83 | 81 | 85 | 76.8 | 80 | 81 |
| Braves | 86.5 | 83 | 85 | 85 | 91 | 86.6 | 82 | 96 |
| Orioles | 78.5 | 75 | 81 | 75 | 82 | 79.2 | 76 | 85 |
| Red Sox | 82.5 | 85 | 79 | 85 | 84 | 80.5 | 83 | 97 |
| Cubs | 72.5 | 77 | 73 | 76 | 74 | 75.8 | 69 | 66 |
| White Sox | 80.5 | 76 | 83 | 76 | 80 | 85 | 78 | 63 |
| Reds | 90.5 | 92 | 84 | 86 | 90 | 91.1 | 84 | 90 |
| Indians | 78.5 | 80 | 74 | 79 | 80 | 76.8 | 85 | 92 |
| Rockies | 71.5 | 71 | 75 | 74 | 70 | 77.5 | 70 | 74 |
| Tigers | 92.5 | 91 | 86 | 95 | 91 | 89.7 | 95 | 93 |
| Marlins | 63.5 | 67 | 75 | 65 | 65 | 65.3 | 64 | 62 |
| Astros | 58.5 | 63 | 67 | 72 | 57 | 62.5 | 66 | 51 |
| Royals | 78.5 | 76 | 78 | 80 | 79 | 75 | 77 | 86 |
| Angels | 91.5 | 91 | 86 | 91 | 93 | 93.3 | 88 | 78 |
| Dodgers | 91.5 | 91 | 83 | 88 | 90 | 90.6 | 91 | 92 |
| Brewers | 81.5 | 78 | 83 | 78 | 81 | 77.6 | 78 | 74 |
| Twins | 68.5 | 65 | 74 | 69 | 66 | 70.9 | 66 | 66 |
| Mets | 75.5 | 80 | 78 | 76 | 66 | 76.8 | 74 | 74 |
| Yankees | 86.5 | 91 | 90 | 86 | 83 | 84.7 | 87 | 85 |
| Athletics | 84.5 | 83 | 86 | 84 | 78 | 85.3 | 85 | 96 |
| Phillies | 85.5 | 81 | 84 | 81 | 82 | 81 | 86 | 73 |
| Pirates | 77.5 | 80 | 77 | 81 | 77 | 74.8 | 79 | 94 |
| Padres | 73.5 | 76 | 78 | 76 | 73 | 72.7 | 81 | 76 |
| Giants | 87.5 | 85 | 85 | 92 | 87 | 85.1 | 88 | 76 |
| Cardinals | 82.5 | 85 | 86 | 83 | 85 | 85.1 | 90 | 97 |
| Rays | 86.5 | 87 | 88 | 86 | 88 | 89.5 | 93 | 91 |
| Rangers | 86.5 | 89 | 88 | 85 | 91 | 86.8 | 85 | 91 |
| Blue Jays | 88.5 | 84 | 78 | 86 | 94 | 87.5 | 82 | 74 |
| Nationals | 91.5 | 87 | 86 | 85 | 94 | 92.5 | 90 | 86 |
| Mariners | 77.5 | 78 | 79 | 73 | 74 | 74 | 78 | 71 |
For Eli Manning, 150 Games and Counting
Check out this graphic from the New York Times. Eli Manning has now started 150 games in a row for the Giants. That’s pretty hard to grasp.

Cheers.
New England Symposium on Statistics in Sports (NESSIS) 2013
I attended the New England Symposium of Statistics in Sports (NESSIS) last Saturday at Harvard Science Center (See the sweet logo below) where I presented a poster. The conference was organized by Mark Glickman and Scott Evans Scott Evans
![]()
My poster (see below) was about openWAR, which is a project I am working on with Ben Baumer and Shane Jensen. Our goal is to create a completely open source version of wins above replacement (WAR) based entirely on publicly available data. We’ve implemented openWAR in R and the package is currently available on github here: openWAR. When we think it’s ready for primetime, we’ll be putting in on CRAN.

I missed the first featured session because it was at 9:30am, and that’s not how I roll on Satudays. During the parallel sessions at 11:30am, I decided to attend the non-NBA series of talks. The first talk was by Robert Carver and he talked about R.A. Dickey and the curveball. He was followed by Stephanie Kovalchik who gave an interesting talk about trends in tennis intensity. She had a lot of really interesting data visualizations of tennis trends over the past few decades, but I can’t seem to find them online. If anyone knows where I can find there, please point me in the right direction. After her, Dennis Lock gave a talk about using random forests to estimate win probability. At the end of the day I was trying to explain random forests to someone from ESPN (how awesome is that sentence), and I knew that random forests were essentially regression trees based on bootstrapped samples. When I went to look this up to make sure I wasn’t lying about random forests, I found out that at each step the set of predictors in the regression tree is randomly chosen. I did not realize this, but makes total sense. Otherwise, the trees in the forest would all be very similar. So I learned something, and isn’t that the whole point of these conferences?
The final talk in this session was by Michael Pane who was attempting to cluster pitches based on pitch F/X data and improve classification of MLB pitches. They call their procedure CLUMPD and they made a sweet interactive shiny app. But I didn’t write down the URL, and I can’t seem to find it by googling it. Hopefully when they post the slides, the link will be in there.
Following the session I ate lunch with Ben Baumer, Mike Lopez, and one of Mike’s friends from UMass on the rocks outside of the Harvard science center. After lunch I mean to go the the afternoon featured speaker, but I ended up talking to two San Francisco fans about my poster. I asked them if they were presenting at the conference, and they told me that they didn’t even know the conference was going to be there. They were just baseball fans in town to see a few Red Sox games and they apparently just stumbled across NESSIS and my poster. After talking to the two guys from San Francisco, I talked to one of the members of the Tuft’s SABR club about openWAR for the rest of the time allotted for the featured speakers. After we finished talking the actual poster session started at 3:30. I met and spoke with a ton of interesting people.
Here’s a list of some of the interesting people that I talked to while at my poster:
- Vince Gennaro – Author of Diamond Dollars: The Economics of Winning in Baseball, President of SABR, consultant to MLB teams, all around baseball fanatic
- Eric Van – Former consultant for the Boston Red Sox
- Michael Humphries – Author of “Wizardry: Baseball’s All-Time Greatest Fielders Revealed”
- James O’ Malley – Professor at Dartmouth
- Andy Andres – Teacher SABR 101 at Tufts
- Doug Noe – Professor at Miami (OH) (This was my favorite meeting because I had never met him before, but he told me that he really liked my blog and that I had actually written about him before.)
Right at the end of the poster session, Eric Van came over to my openWAR poster and criticized our definition of replacement player. The way that we have defined it, about half of the players we have defined as being in the replacement group are below the average replacement player. While I’m not sure that this isn’t ok technically, it’s a huge success for our larger idea. By making openWAR completely transparent people are free to criticize, critique, and complement every single piece of our procedure (and we definitely welcome constructive criticism), rather than gues at what’s going on inside the black boxes of baseball reference and fan graphs WAR.
NESSIS then closed with a panel discussion. The panel consisted of Ben Baumer, Eric Van, and Vince Gennaro. The picture below is the panel, with Carl Morris (you know he’s a big deal cause he’s got a Wikipedia page) saying some words before the discussion began. The panel was ultimately moderated by Andy Andres.
One of the interesting points the panel made was that in the beginning of SABRmetrics, a lot of the most interesting work was being done by fans and not necessarily the teams themselves. This has entirely changed today due to the fact that baseball teams have access to mountains and mountains of data that are simply not available to the public or the public can’t afford.
Van also pointed out that the numbers don’t tell you everything. You can’t just view numbers and ignore the personality of players. For instance, if the numbers say that a guy should hit 6th instead of 2nd, you have to weigh the improvement your team will gain against the psychology of moving a guy from 2nd to 6th in the line-up. In his words:
The numbers are just sign posts. You have to actually watch the game to see if you’re onto something. -Eric Van
The whole discussion was fantastic, and it was really interesting to hear the perspective of three people who have actually worked in baseball as statistical analysts.

Fantastic overall conference. See you in 2015!
Cheers.
NCAA Football Top 25 – September 23, 2013
2013 NCAA Football Standings
Updated September 23, 2013
|
Cheers.
MLB over-unders: Can anyone beat Las Vegas?
Back in March, several dozen websites, written by either professionals, bloggers, or, in some cases, professional bloggers, came out with predicted MLB win totals.
A predicted win total represents the number of wins this website or individual predicted for each major league team. These numbers can be easily compared to the Las Vegas line for each team (I used the one set by the Hilton) to determine if these predictions are worth our time, and, in some cases, our money.
Here are the sites I used:
O/U: The Hilton’s over/under for each team
BP: Baseball prospectus
TR: Team Rankings (caveat on the linked page: the site stresses their MLB predictions are a work in progress)
DP: Davenport
Zips: ZIPS projection system (espn.com)
PM: Prediction Machine
TB: Trading Bases, an avid blogger and book-writer
Here are my metrics
MSE: Averaged squared error between the prediction and the win totals*
MAE: Averaged absolute error between the prediction and the win totals*
Corr: Correlation between the predicted and the win totals*
*For win totals, I’m use each team’s estimated win totals from here (I’m too excited to wait until the end of the season!)
Results
| O/U | BP | TR | DP | Zips | PM | TB | |
| MSE | 68.59 | 62.50 | 84.56 | 70.47 | 75.37 | 79.76 | 61.04 |
| MAE | 6.65 | 6.75 | 7.73 | 6.75 | 7.01 | 7.22 | 6.53 |
| Corr | 0.68 | 0.71 | 0.59 | 0.67 | 0.66 | 0.61 | 0.72 |
Baseball prospectus appears to offer the only clear advantage over the Las Vegas line, at least among these predictions, as judged by a higher correlation and a lower MSE between observed and predicted values. As for team rankings & prediction machine, their results were both disappointingly bad. (Note: Trading Bases came into the picture after the initial post, and also appears to be a clear winner).
TeamRankings does offer this disclaimer about their projections:
A word of caution — while our preseason projections for other sports have proven to be useful indicators of where values may lie among the various full season futures bets, we’re not nearly as confident in our MLB preseason ratings. We’re publishing these in the interest of full disclosure, so that you know what the initial rating in our projection system was for each team. We’re most definitely not recommending that you use these ratings and forecasts to go place preseason bets.
Here’s the table of predicted wins for each site.
| Team | O/U | BP | TR | DP | Zips | PM | TB | Simulated Wins |
| Diamondbacks | 82.5 | 85 | 83 | 81 | 85 | 76.8 | 80 | 82.5 |
| Braves | 86.5 | 83 | 85 | 85 | 91 | 86.6 | 82 | 95.8 |
| Orioles | 78.5 | 75 | 81 | 75 | 82 | 79.2 | 76 | 86.2 |
| Red Sox | 82.5 | 85 | 79 | 85 | 84 | 80.5 | 83 | 97.2 |
| Cubs | 72.5 | 77 | 73 | 76 | 74 | 75.8 | 69 | 67.5 |
| White Sox | 80.5 | 76 | 83 | 76 | 80 | 85 | 78 | 64.2 |
| Reds | 90.5 | 92 | 84 | 86 | 90 | 91.1 | 84 | 92 |
| Indians | 78.5 | 80 | 74 | 79 | 80 | 76.8 | 85 | 87.9 |
| Rockies | 71.5 | 71 | 75 | 74 | 70 | 77.5 | 70 | 72.9 |
| Tigers | 92.5 | 91 | 86 | 95 | 91 | 89.7 | 95 | 94.5 |
| Marlins | 63.5 | 67 | 75 | 65 | 65 | 65.3 | 64 | 60.1 |
| Astros | 58.5 | 63 | 67 | 72 | 57 | 62.5 | 66 | 54.9 |
| Royals | 78.5 | 76 | 78 | 80 | 79 | 75 | 77 | 85.1 |
| Angels | 91.5 | 91 | 86 | 91 | 93 | 93.3 | 88 | 79 |
| Dodgers | 91.5 | 91 | 83 | 88 | 90 | 90.6 | 91 | 92.5 |
| Brewers | 81.5 | 78 | 83 | 78 | 81 | 77.6 | 78 | 73.3 |
| Twins | 68.5 | 65 | 74 | 69 | 66 | 70.9 | 66 | 69.6 |
| Mets | 75.5 | 80 | 78 | 76 | 66 | 76.8 | 74 | 73 |
| Yankees | 86.5 | 91 | 90 | 86 | 83 | 84.7 | 87 | 84.9 |
| Athletics | 84.5 | 83 | 86 | 84 | 78 | 85.3 | 85 | 94.6 |
| Phillies | 85.5 | 81 | 84 | 81 | 82 | 81 | 86 | 75.7 |
| Pirates | 77.5 | 80 | 77 | 81 | 77 | 74.8 | 79 | 92.1 |
| Padres | 73.5 | 76 | 78 | 76 | 73 | 72.7 | 81 | 76.1 |
| Giants | 87.5 | 85 | 85 | 92 | 87 | 85.1 | 88 | 75.2 |
| Cardinals | 82.5 | 85 | 86 | 83 | 85 | 85.1 | 90 | 94.6 |
| Rays | 86.5 | 87 | 88 | 86 | 88 | 89.5 | 93 | 89.2 |
| Rangers | 86.5 | 89 | 88 | 85 | 91 | 86.8 | 85 | 88.1 |
| Blue Jays | 88.5 | 84 | 78 | 86 | 94 | 87.5 | 82 | 73.8 |
| Nationals | 91.5 | 87 | 86 | 85 | 94 | 92.5 | 90 | 86.3 |
| Mariners | 77.5 | 78 | 79 | 73 | 74 | 74 | 78 | 71.4 |
On Exercise, BMI, and the fascination with strict recommendations
Every Monday, Ph.D. students in the public health program at Brown gather to eat pizza, rearrange some unappetizing caesar salad around on our plates, and discuss a recent manuscript in different fields in an entertaining hour known as JournalClub.
Today’s article of choice was written in American Journal of Health Promotion, linked here, which promoted the idea that short bouts of moderate to vigorous exercise each day were successful in reductions of BMI. The article was titled “Moderate to Vigorous Physical Activity and Weight Outcomes: Does Every Minute Count?”
Methods, covariates, and study population limitations aside, what struck me as uncomfortable was how, despite the author’s self-admittance that this manuscript did not show causes and effects, the journal still placesets the following highlighted box.

In other words, “we can’t claim causation with our exercise exposure, but we urge you to change your lifestyle anyways.” Is that…
View original post 93 more words
NCAA Football – Top 25
Updated: September 15, 2013
|
NFL Picks – Week 2
Overall Records
SU: (10-6, 62.5%)
ATS: (5-10-1, 34.38%)
O/U: (7-9, 43.75%)
Week 1 (10-6 SU, 5-10-1 ATS, 7-9 O/U)
September 12, 2013 – 8:30pm
New York Jets at New England Patriots
Prediction: Patriots win 34-19
Pick: Patriots -12
OU: Over 44
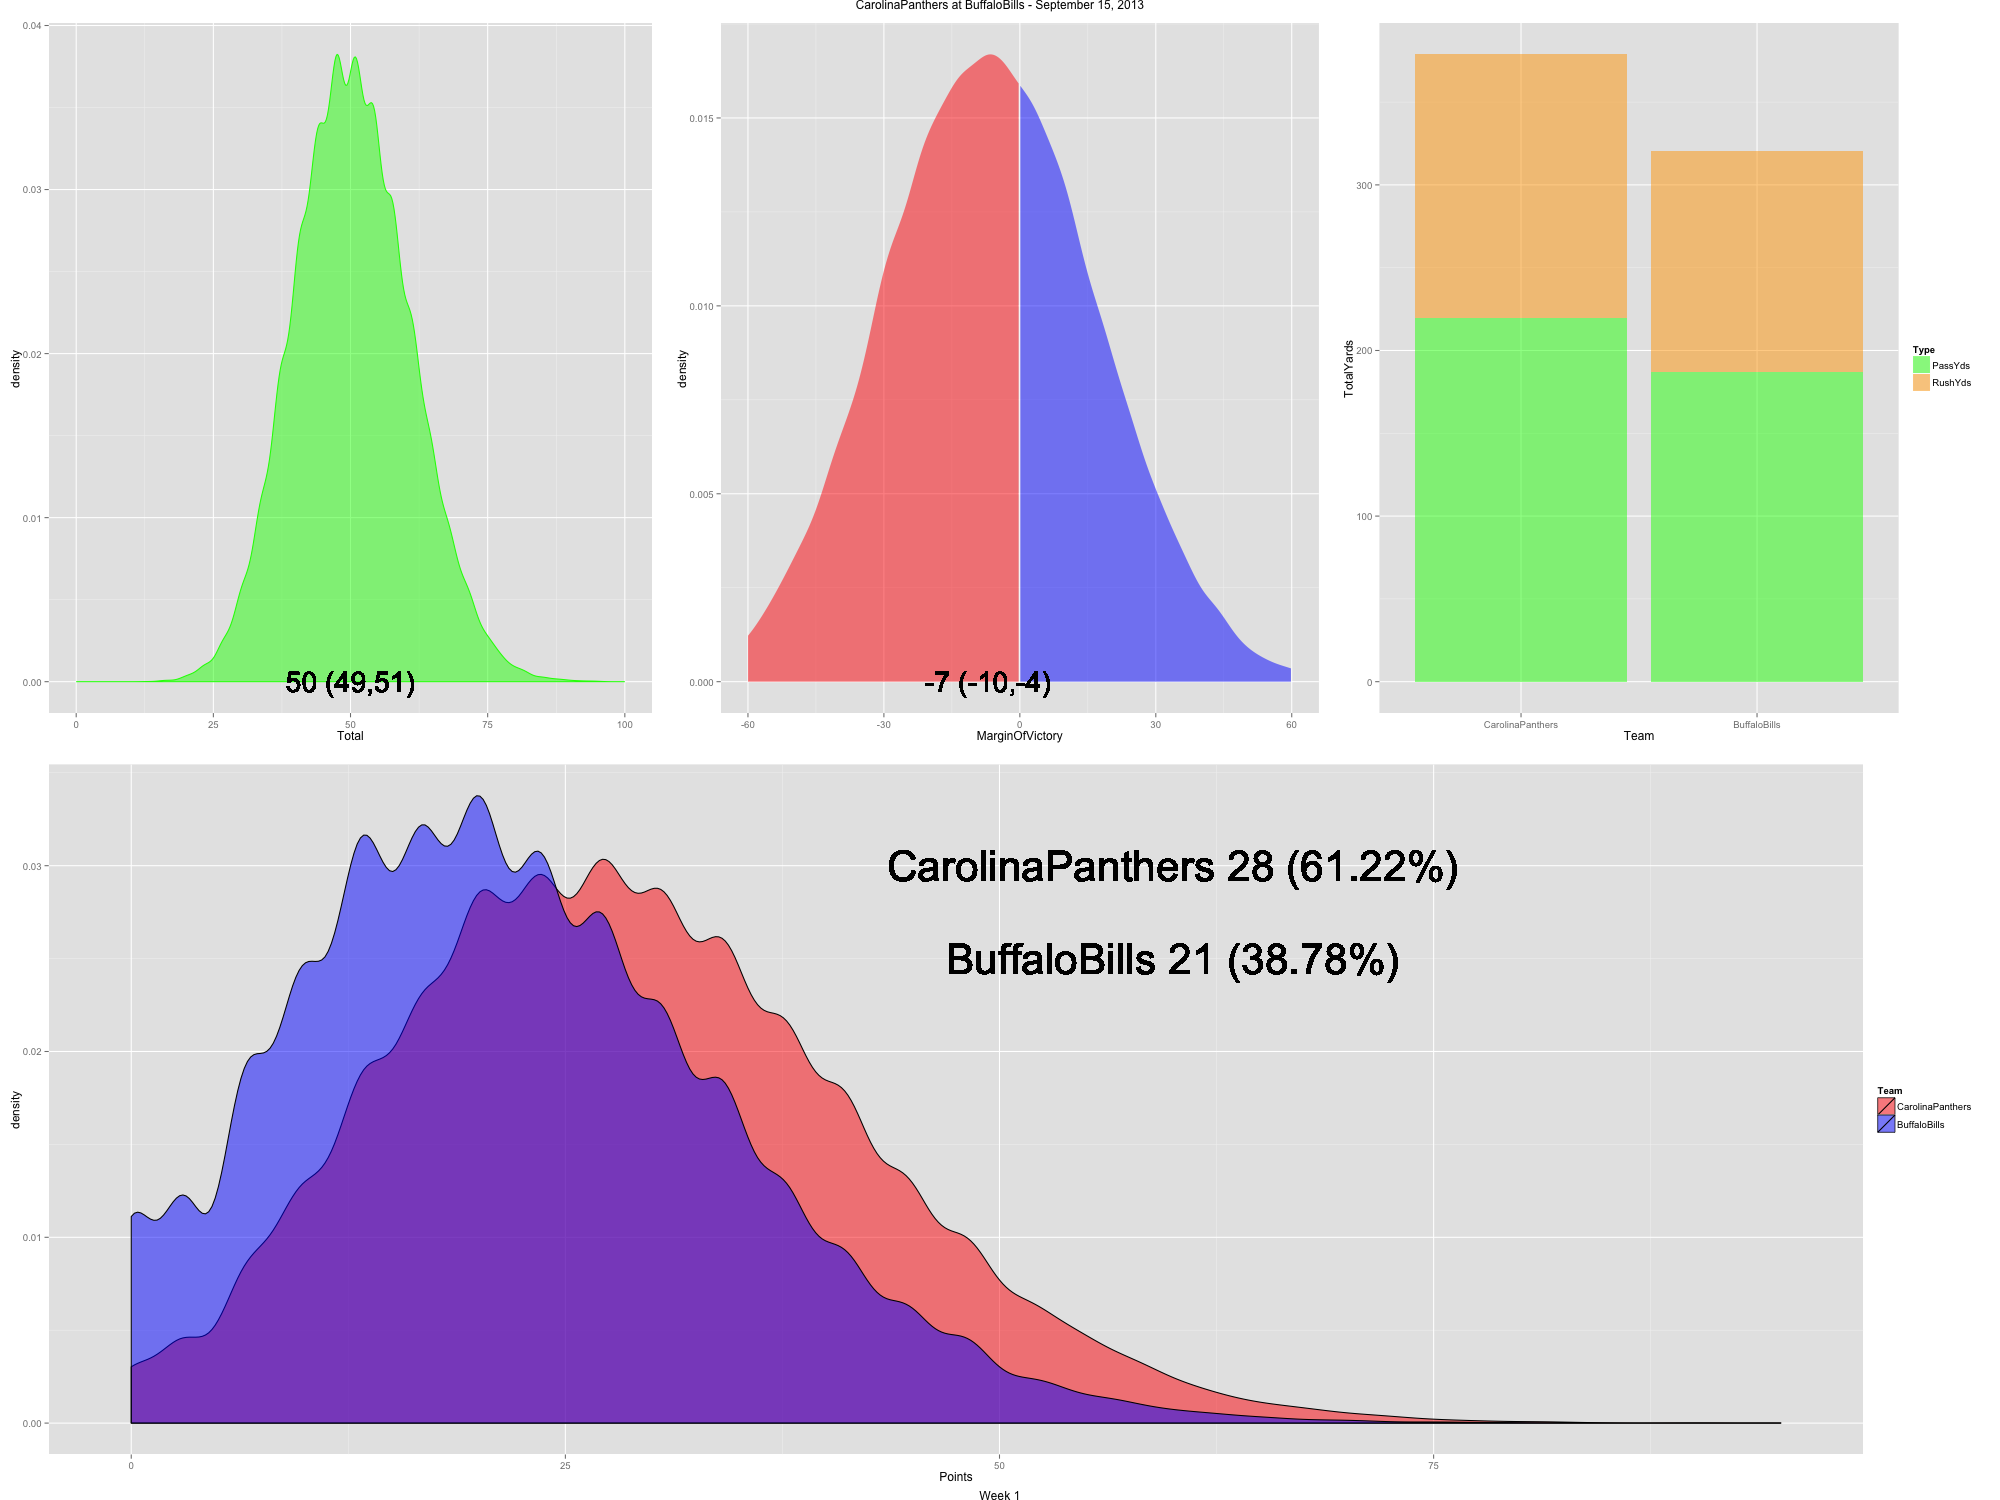
September 15, 2013 – 1pm
Carolina Panthers at Buffalo Bills
Prediction: Panthers win 28-21
Pick: Panthers -3
OU: Over 44
Cleveland Browns at Baltimore Ravens
Prediction: Ravens win 26-19
Pick: Ravens -7
OU: Over 43.5
Dallas Cowboys at Kansas City Chiefs
Prediction: Cowboys win 26-19
Pick: Cowboys -2.5
OU: Under 47
Miami Dolphins at Indianapolis Colts
Prediction: Dolphins win 21-20
Pick: Dolphins +3
OU: Over 43
Minnesota Vikings at Chicago Bears
Prediction: Bears win 22-19
Pick: Viking +6.5
OU: Over 42
San Diego Chargers at Philadelphia Eagles
Prediction: Chargers win 24-20
Pick: Chargers +9
OU: Under 54.5
Washington Redskins at Green Bay Packers
Prediction: Packers win 27-26
Pick: Redskins +7.5
OU: Over 50
St. Louis Rams at Atlanta Falcons
Prediction: Falcons win 24-19
Pick: Rams +7
OU: Under 48
Tennessee Titans at Houston Texans
Prediction: Texans win 30-17
Pick: Houston -9
OU: Over 43
September 15, 2013 – 4:05pm
New Orleans Saints at Tampa Bay Buccaneers
Prediction: Saints win 28-27
Pick: Buccaneers +4
OU: Over 48
Detroit Lions at Arizona Cardinals
Prediction: Lions win 24-21
Pick: Lions -2.5
OU: Under 48
September 15, 2013 – 4:25pm
Denver Broncos at New York Giants
Prediction: Broncos win 24-23
Pick: Giants +5.5
OU: Under 56
Jacksonville Jaguars at Oakland Raiders
Prediction: Raiders win 24-23
Pick: Jaguars +6
OU: Over 40
September 15, 2013 – 8:30pm
San Francisco 49ers at Seattle Seahawks
Prediction: 49ers win 21-20
Pick: 49ers +2.5
OU: Under 45
September 16, 2013 – 10:20pm
Pittsburgh Steelers at Cincinnati Bengals
Prediction: Bengals win 20-19
Pick: Steelers +7
OU: Under 41
StatsInTheWild NCAA Football Top 25 – September 8, 2013
September 7, 2013
|
