The Red Sox and Cardinals meeting in the Fall Classic represents the top run differentials in each league squaring off. Baseball statheads should feel the warm glow of empiricism peeking through, especially after last year when we had to hear from some about the overrating of run differential. Why is it at all controversial to say that the team largest difference between runs scored and runs allowed over 162 games? Is that a radical notion? I think part of it is the basic notion that most people don’t understand randomness (or “luck” or “fortuosity” or “midichlorians” or whatever you want to call it) and that even in a large sample of 162 games, you can have smaller sub-samples (like the Orioles’ 38 one-run games last season, in which they went an insane 29-9) where randomness can take over, and then the whole sample ends up a bit screwy.
But I digress, the Boston Red Sox scored 197 more runs than they allowed, more than any other AL team and the St. Louis Cardinals scored 187 more runs than they allowed, more than any other NL team. So we are poised to see the
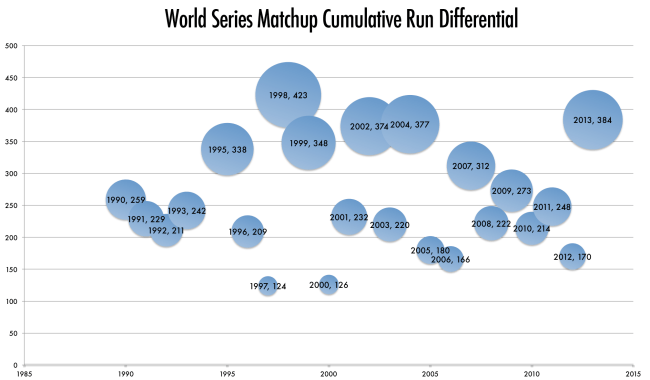
Pythagorean Pennant winners face off. How does this compare to previous years’ match-ups? I’m glad I asked myself, because I spent some time compiling the run differentials of each league’s WS representatives, plus the overall WS run differential, as well as each teams’ rank in their respective leagues since 1990 (remember that there was no World Series in 1994.) I highlighted the teams who lead their league in run differential in gold, cause they’re special, you know?

This doesn’t mean all that much, I suppose. But it’s hasn’t been exactly common for each league’s top run +/- team to get to the WS to square of, so I thought I’d look at some stuff. And also, I made a couple little bubble charts to visualize the run diffs of the respective teams. Of course, the cumulative run differential means only so much. The best cumulative run differential was from 1998, but that was the historically great 1998 Yankees team, who have the best run differential in the last 24 seasons (the also historically great 2001 Mariners are second best, with 301 to the Yanks’ 309. After them, it’s a long fall to third place). Because of this, I made a second graph that plots the difference (the run differential is NL team minus AL team, so negative values represent a matchup favoring the AL). With this, you can see just how much better the Yanks’ run differential was than the Padres, and the Padres had the third best in the NL in 98. In this chart, I also put the WS numbers in red when the team with the better run differential lost. (click to enlarge, please. )


Here are some interesting facts I gleaned from this exercise- The Red Sox have played in three WS since 1990 and each time they’ve had the best run differential in the AL* have faced the best run differential from the NL. In fact, there have been four WS with the best vs best, and the only non-Red Sox one is the 2002 Series between the Angels and Giants. The worst WS in terms of total run differential was 1997, where Florida and Cleveland had a cumulative run differential of +124 (compare that with the best team in each league, the Yankees, who had a +210, and Atlanta, at +203). The worst in terms of rankings (and barely missed cumulative), was the 2000 Subway Series, where the Yankees and Mets were each the fifth best in their leagues, and the had a cumulative total of +126 (Giants had the best in the NL at +178 and the White Sox were the AL’s best at +138.) The team with better run differential has lost 13 of the 22 series (with 2013 outstanding, obviously). What does that mean? A seven game series features a lot of that randomness. The Marlins were 102 runs were than the Yankees in 2003, and won in six. The 2006 Cardinals were a whooping 128 runs worse than the Tigers in 2006 (that’s right, Detroit managed to outdo their OPPONENT’s run differential by more than the cumulative totals of either the 1997 series or 2000 series teams) and the Cards won in five.
* One fact that always seems to be left out when narratives are being created about the 2004 Red Sox is that they led the AL in run differential and it was about as close as Reagan vs Mondale. The Red Sox scored 181 more runs than they allowed. The second place AL team was the Angels, at +102, third was the Yankees at +89. The Red Sox’ expected record was 98 wins, same as their actual record. It was the 2004 Yankees whose record was grossly out of tune with their expected win-loss, as they won 101 games but were expected to win only 89 (which actually would have placed them behind the A’s for the Wild Card). It wasn’t that the Red Sox were scrappy and overcame obstacles, it was more that they were the much better team, best in the AL, and the Yankees’ magic dust finally wore out. It’s not as fun of a narrative, but it’s got a better empirical basis. Of course, it still doesn’t explain why the Yankees never bunted on Curt Schilling and his bloody sock, but that’s strategy, not empiricism.
What we can say is that the 2013 World Series features two teams whose run differential is very close. We’ve also had 10 World Series since 1990 (including this one) that features teams within 20 runs of each other. You cannot predict the outcomes of these matchups. The old adage that “good pitching beats good hitting” is literally meaningless. Max Scherzer and Justin Verlander did not trump the Red Sox and their MLB-best offense, and Zach Greinke and Clayton Kershaw did not silence the NL-best Cardinals offense. Anything can happen in a short series, and seven games is pretty short in baseball. But 162 is anything but short, and we do know that based on a whole season’s worth of data, in 2013, we get to see the two best possible teams playing each other. Let’s hope it’s worth watching.


Leave a comment