Fun with Benford’s law: Election 2016 edition: What’s up with Iowa and Mississippi
Update 11-11-2020: I’ve had a lot of comments on this post since Biden beat Trump in the 2020 election. And I’ll probably mess around with the data when the final totals are certified. Until then, @standupmaths, posted an excellent video explaining Benford’s Law in relation to the 2020 election. He explains when Benford’s Law can be applied and when it can’t, and he gives a great example of data from Chicago (the best city in America). In the video, he also mentions a paper, which I have downloaded and posted here for everyone to read because academic work shouldn’t sit behind paywalls: benfords_law_and_the_detection_of_election_fraud. Once again, as I said in the original post, there is no evidence of election fraud in either 2016 or 2020. The only fraud in these election is Donald Trump who never won the popular vote. #sickburn Fuck Trump.
Original post:
Before I begin this post, I need to make it clear to the conspiracy lunatics out there that this is not evidence that the 2016 election was rigged. As of right now, there is basically no evidence that this election was anything other than a massive, but fair, fuck up by the American people. Could the election have been rigged? Sure. Anything, no matter how unlikely is possible in the world we live in now. (I mean Donald Trump a racist, xenophobic, misogynist, was elected president of the United States of America, which was basically an impossibility like 3 weeks ago.) But let me again say there is no evidence that the election was rigged. And that includes this post.
Ok, now that we have that out of the way, let’s talk about Benford’s Law (tip of the hat to @mulderc for this idea). Benford’s law states that in a list of numbers the leading digits does not appear uniformly. The digit 1 is expected to be first about 30% of the time, while the digit 9 is expected to be first only about 4.5% of the time. Specifically, for a digit d between 1 and 9, the probability that number appears first is given by the following formula:
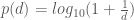
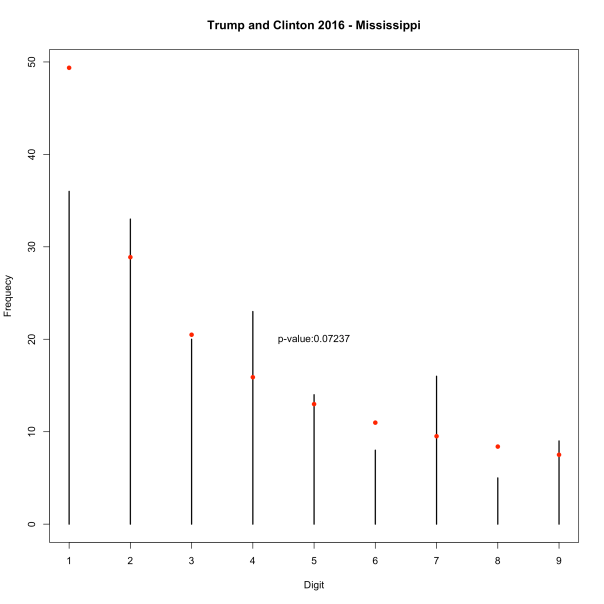
So let’s apply this to the 2016 election. I downloaded data on the 2016 election at the county level from here. Using all of the data for each of the candidates I get the following two plots. The height of the bar is what is actually observed and the red dots are what is to be expected by Benford’s law. It really is amazing how well this distribution fits the data.

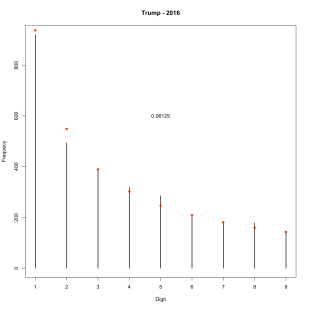
And if we go back to 2012, we see exactly the same thing. Amazing. Benford’s Law seems so counterintuitive, but it’s observed in so many different places.
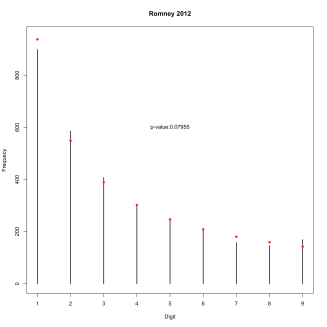

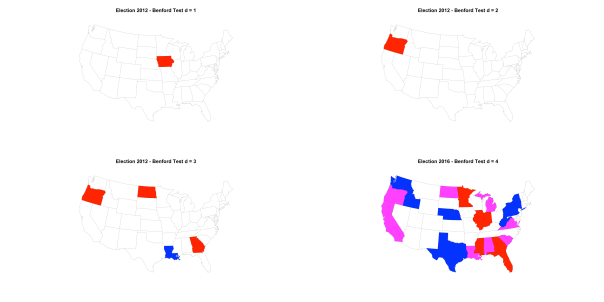
Next I wanted to look at individual states. This is problematic for at least a few reasons. Most notably, there are a some states that have very few counties in them (e.g. Massachusetts, Alaska, etc.). So I went ahead and tested each state with at least 30 counties individually to see if their votes followed Benford’s Law. I also went a step further, as Benford’s law can be extended to the first two digits, three digits, etc. Below are the results of individual state goodness-of-fit tests for Benford’s law for 1-4 digits using a Bonferroni correction to control the family-wise error rate (FWER). States where the null hypothesis is rejected for Trump and Clinton are colored red and blue, respectively. States where the null is rejected for both Clinton and Trump are colored purple. I’m pretty sure I shouldn’t even be doing a Benford’s goodness of fit on the first 3 or 4 digits when I only have 30 observations. But I did it anyway. I’d pay more attention to the plots for the digits 1 and 2. On those plots we see that the null hypothesis for Trump’s totals in Iowa and Mississippi was rejected for 1 digit and for 2 digits the null was rejected in Mississippi only. Let’s go look at Iowa and Mississippi in more detail.
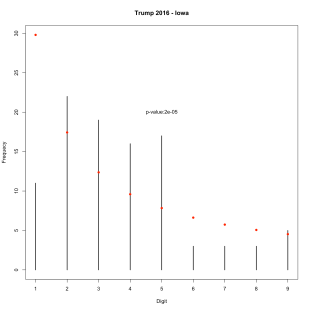
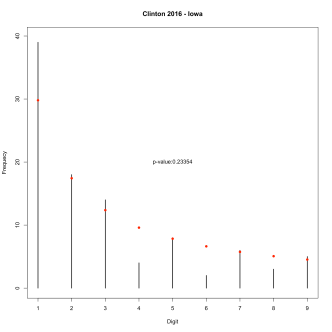
If we look at Trump’s and Clinton’s vote totals in Iowa, we get the plot below. This is significantly different than Benford’s Law with a p-value of 0.0205.

Next I looked at each candidates vote totals individually. The departure from Benford’s Law is entirely driven by Trump’s vote totals. Trump has way less 1’s than expected and more than expected for 2 through 5.
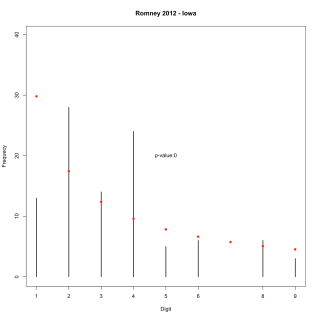
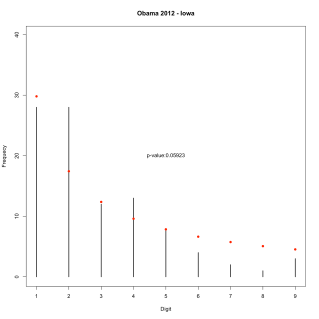
Before you go flipping out about how this is evidence of election fraud, you should look at Iowa from 2012. Basically we see the same thing with the Republican candidate. Too few 1’s and more 2’s and 4’s than we expect. My guess as to what is happening here is that the types of counties that Republicans are winning in Iowa are not expected to follow Benford’s law? Is that plausible? But I’d love to hear other ideas as to what is happening in Iowa.
Now let’s look at Mississippi. When we look at Clinton and Trump together, there is nothing significant. Though we do see far fewer 1’s than expected, just like in Iowa.
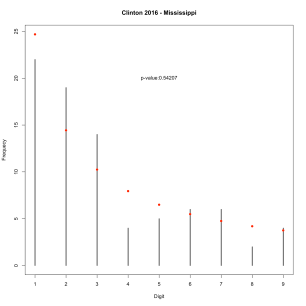
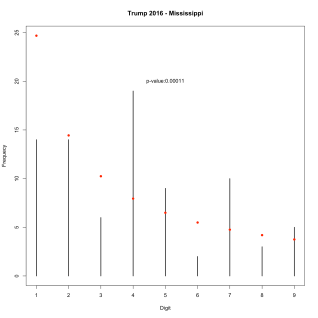
When we look at Trump and Clinton individually, we see that Clinton’s vote totals are not significantly different than Benford’s Law expects, but Trump’s are very different again with far too few 1’s and way too many 4’s.
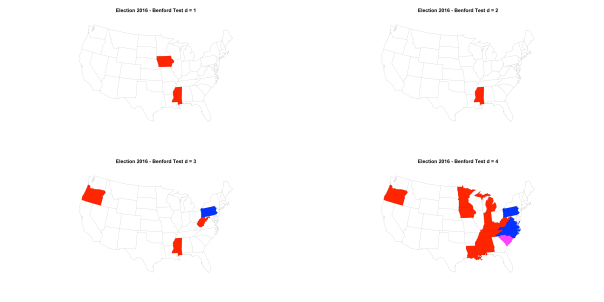
Finally, here are the plots for test for 2012 using a Bonferroni correction to control the FWER. Iowa shows up again when d=1, but Oregon shows up when d=2.
In conclusion, Benford’s law is fun and there’s something weird about Iowa and Mississippi.
Cheers.
Posted on November 26, 2016, in Uncategorized. Bookmark the permalink. 24 Comments.

Umm you did not do a great job convincing me this isn’t fraud.
Yeah, looking back at this, it is very strange.
I’m not saying that it WASN’T fraud. But I think I would need A LOT more evidence to be convinced that it was fraud. And there really isn’t any other evidence.
Have you seen the stuff going around about the current election, in battleground states? I’m no mathematician, so have been hoping someone could put it to rest …
I haven’t looked at the data yet. I’m waiting for counts to be finalized.
It might be evidence of fraud. A couple of the other things that can have an effect on Benfords Law; Dishonest or strategic voting.
Say I am a voter in Iowa. I dislike both Trump and Clinton. I think Trump has the worse character and is extremely risky to be in power. But I don’t like Clintons policies at all. Even though I know she’d be the more stable choice in terms of character. Maybe I believe a vote for clinton would be wasted, since I think “She’s going to win anyway”. The GOP match with my perspective on public policy. Would I feel more keen about voting for a different less divisive Republican? Probably. Am I going to vote for Clinton even though I really really don’t want to vote for Trump either? Probably not.
That’s just one example. In this instance, Benfords law is more of a falsehood detector than a fraud detector. It might be that the falsehood is from fraud, or it might be an indicator of people not voting with their first gut choice and overthinking or underthinking their vote. Might even be a little of both.
The point is, that Benfords law is an extremely sensitive falsehood detector, but it can’t tell you what the falsehood/falsehoods are. It can only tell you to look deeper. If the falsehood is based on some psychological variable such as self-delusionment, then running different numbers through the detector of Benfords Law probably won’t be able to give you much more new information or evidence with which to make claims either way.
All of that aside; I personally wouldn’t be surprised if there turned out to be some fraud. I’d personally investigate the voting machines and their locations across those states first.
Care to comment on this years election? https://boards.4chan.org/pol/thread/287771832
I haven’t looked at the data yet. More to come.
People are now claiming Benford’s Law violations show electoral fraud in Biden’s favor in Wisconsin for 2020. Any thoughts on this?
I haven’t looked at the data yet. I’m going to wait until the results are final before looking.
in your opinion was there fraud by joe biden in this years election because benfords law in wisconsin is absolutely wonky!!
Well, I haven’t looked at the data yet. But there is absolutely no evidence of massive large scale fraud in either 2020 OR 2016.
It’s only been a month, and this comment has aged horribly.
Can we look at these for 2020, too?
Yes. I’m waiting for the final numbers before I take a look.
https://digg.com/video/why-doesnt-joe-bidens-vote-count-follow-benfords-law
So, going by the logic of some of the comments here, trump was confirmed cheating in 2016, as the voter data dosen’t follow benford’s law in some places. Or maybe these guys just don’t fully understand how to apply benford’s law in relation to an election.
I’m certainly not confirming that Trump cheated in 2016. There is absolutely NO evidence that the vote totals in 2016 or 2020 were tampered with. I just think applying Benford’s Law here is interesting.
https://digg.com/video/why-doesnt-joe-bidens-vote-count-follow-benfords-law
Yes, K would like you to apply that to Michigan results as well as a few others. Thanks
To deviate from the others who keep asking you to look at 2020 when you stated a 1/2 dozen times you will when the data is final….
I am hearing that the first digit in benford is unreliable within statistical community and they cite a carter report from 2005 (Venezuelan election) as the reason.
Do you have any insight on this? I read the carter report and it makes no reference to a first digit issue. It does say benford was unreliable for all digits.
And to comments from others. One county in iowa does not mean trump didn’t win. We all accept benford picks up anomalies and I applaud you for recognizing that. But your point about seeing whether the data consistently fails is an excellent one. Counties/precincts that have an unreliable first digit, etc should be consistent across multiple elections and those are pretty easy to dismiss.
https://digg.com/video/why-doesnt-joe-bidens-vote-count-follow-benfords-law
I’ll bet you didn’t realize this post would become pertinent 4 years hence. In a recent Tweet, the President made a few claims:
* 2.7 million Trump votes were deleted nation-wide
* Data analysis finds 221,000 PA votes switched from Trump to Biden
Would these actions be detectable from a Benford analysis? What if you ran these what-if scenarios on the 2016 election dataset?
Let’s go Brandon!