So I was watching game 1 of the NBA finals, and I got to thinking about how some of these players have been around for a long time in the NBA (Lebron was drafted in 2003!!!) So I to basketball reference and looked back at some old drafts. Then I got the idea to scrape drafts and current rosters to see what each current NBA team looks like in terms of the years and positions in a draft. This led to me staying up way past my bed time screwing around with rvest and plotly.
What I started with was a scatter plot of draft position on the x-axis versus year drafted on the y-axis with each point having the color of their team. That’s easy enough to do in ggplot. But what I really wanted to do was make it interactive so that when you clicked on a point, all the other points for the team will also highlight. Now on Thursday night/very early Friday morning, I had no idea how to do this. And it drove me F-ing crazy until like 2 or 3 in the morning. You think I’m kidding, but look at my fitbit sleep Friday night. That has nothing to do with a kid; I just couldn’t figure out how to do this.

So Friday I wake up at like 6 barely functional, get baby out the door, go to my only meeting of the day, and then I happened to be having lunch with Carson Sievert who was in Chicago for an R conference. So I mention this problem to him after we finished eating tacos, and he casually pulls out his laptop and shows me:
SharedData$new(~Team)
That’s it. That’s all you need to do to make that work. The full plot code is then:
draft2 %>% SharedData$new(~Team) %>% plot_ly(x = ~Rk,y = ~Year, color = ~Team, text = ~paste(Player,Team), colors = pal)
That’s it. Check out the plot it makes here!
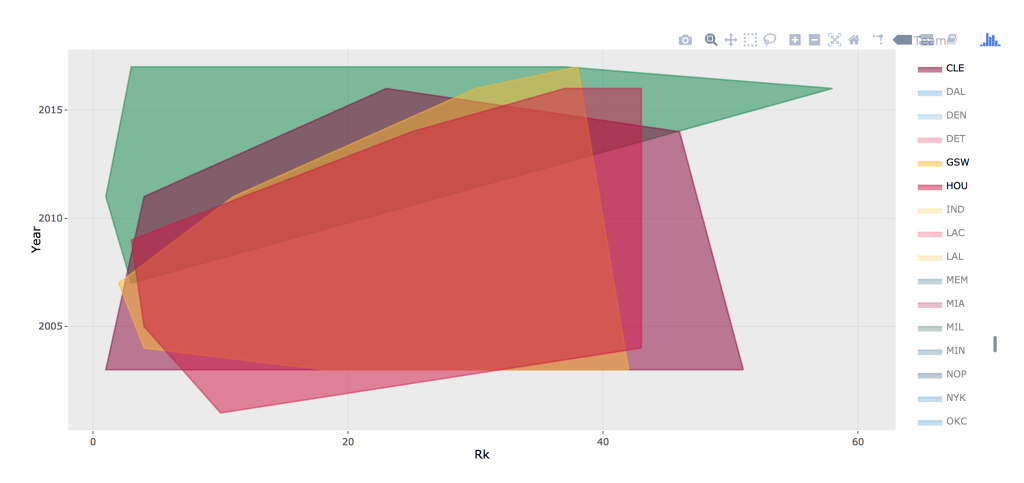
Next what I wanted to do was add some convex hulls around the points. Apparently this is super easy to do too using geom_polygon and the chulls function. Check out the convex hulls plot here. At first it looks like a mess, but double click on the legend on the right to choose what to add to the plot. For instance, below is a screen show of the convex hulls of the final 4 teams in the NBA playoffs. What’s so notable about these teams is that Golden State, Cleveland and Houston have very similar shapes indicating that their teams are made up of some very high draft picks from several years ago, but notably no high draft picks from very recently. But look at Boston. Totally different shape mostly in the upper left corner (indicating high draft picks in very recent years). Go play around with that plot. It’s really interesting.

What I think I’d like to do next is to see how these convex hulls change over time for an individual team. Or if someone has some free time you can take my code and modify it to do that. My full github code for scraping the data and making the plots here.
Go Cavs?
Cheers.

Leave a comment