However bad you think the Rockies are, they are worse. Even worse than the White Sox last year (so far).
Update: They swept the Marlins and are now on a 3 game winning streak and sit at 12-50. They are 25 games out of first place with 100 games to play.
Update: They won last night and are now 10-50 as of noon on June 3.
The Rockies are 9-50. That’s 50 losses in 59 games. A winning percentage of .153. That’s the fastest any team has gotten to 50 losses since 1901. But didn’t we just get a new worst ever team last year in the Chicago White Sox? Yup! The Chicago White Sox lost 121 games last year, the most ever. And the Rockies are currently on pace to shat. ter. the White Sox loss record from last year. They are currently on pace to go 25-137. How bad is this? At this point in the season, the White sox were 15-44. SIX games ahead of where the Rockies are right now. To see this, let’s look at some data viz that I made.
Below is a plot of game number versus cumulative wins. Up until about game 30 the Rockies were merely just as bad as the White Sox. Since then they have really stepped down their game thanks to multiple 8 game losing streaks. Speaking of streaks, let’s take a look at that.

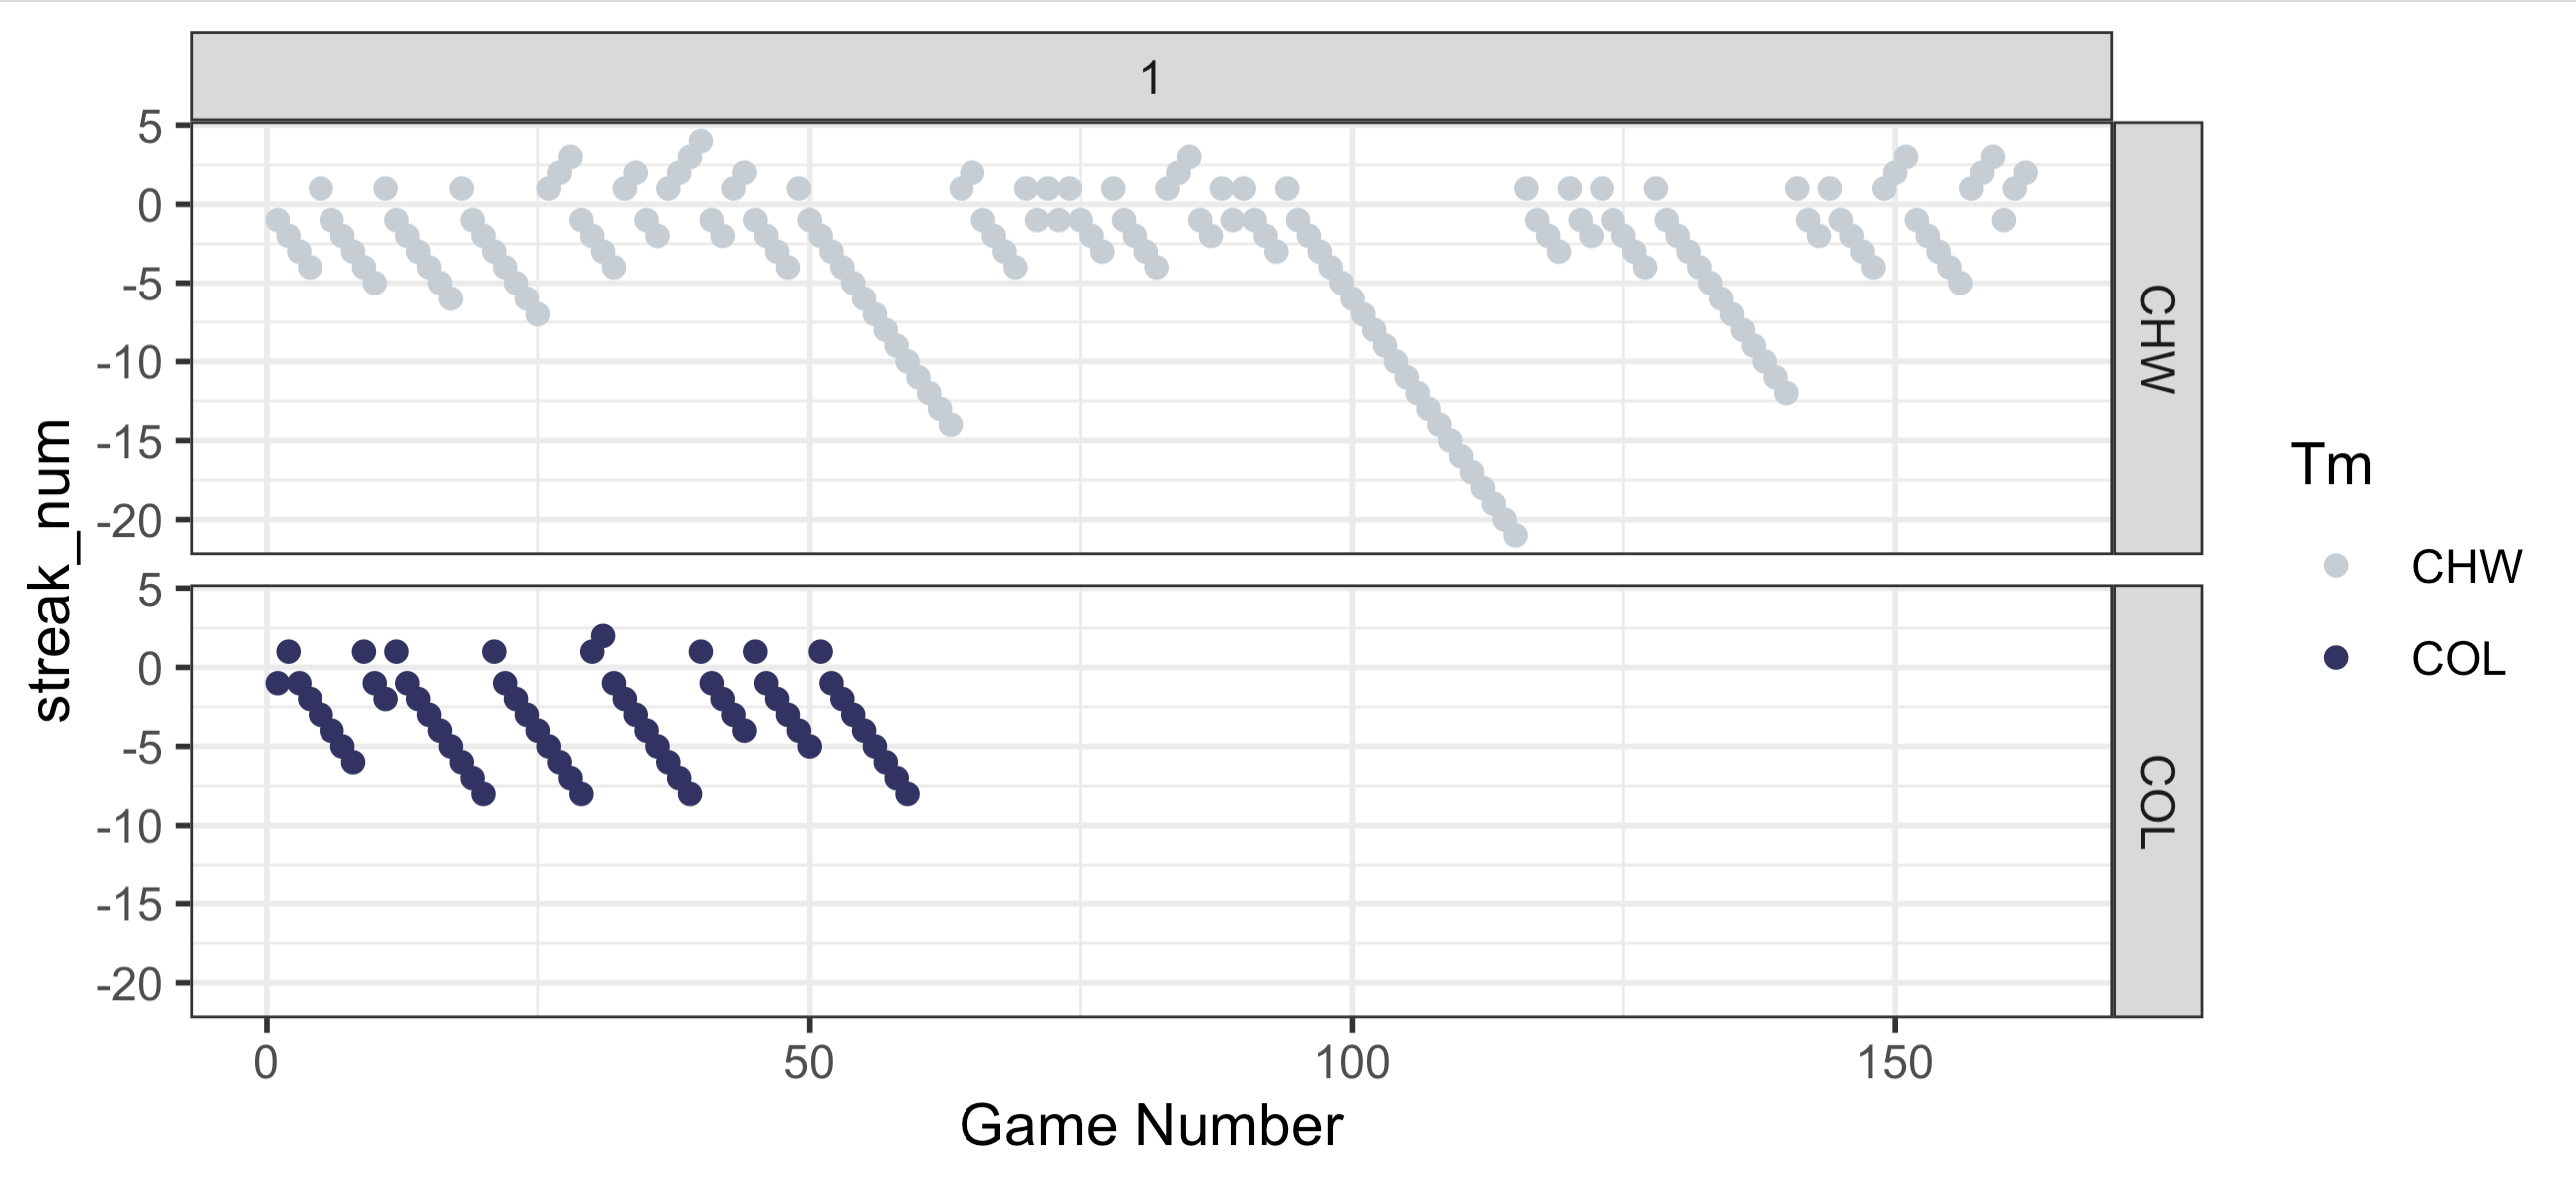
Below, you’ll find a plot of game number on the x axis and the win/loss streak on the y-axis. Positive numbers are winning streaks and negative numbers are losing streaks. You can see that the Rockies have already had FOUR 8 game losing streaks. But even more impressive than that is that they’ve only won back to back games a single time this season. Let me repeat this: Their largest win streak of the season is 2 games and it’s happened exactly once. The White Sox last year has winning streak of 2 or more 9 times total and 4 up to this point in the season,. They even had a nifty little 4 game winning streak (They also had losing streaks of 12, 14, and 21(!!!) games).
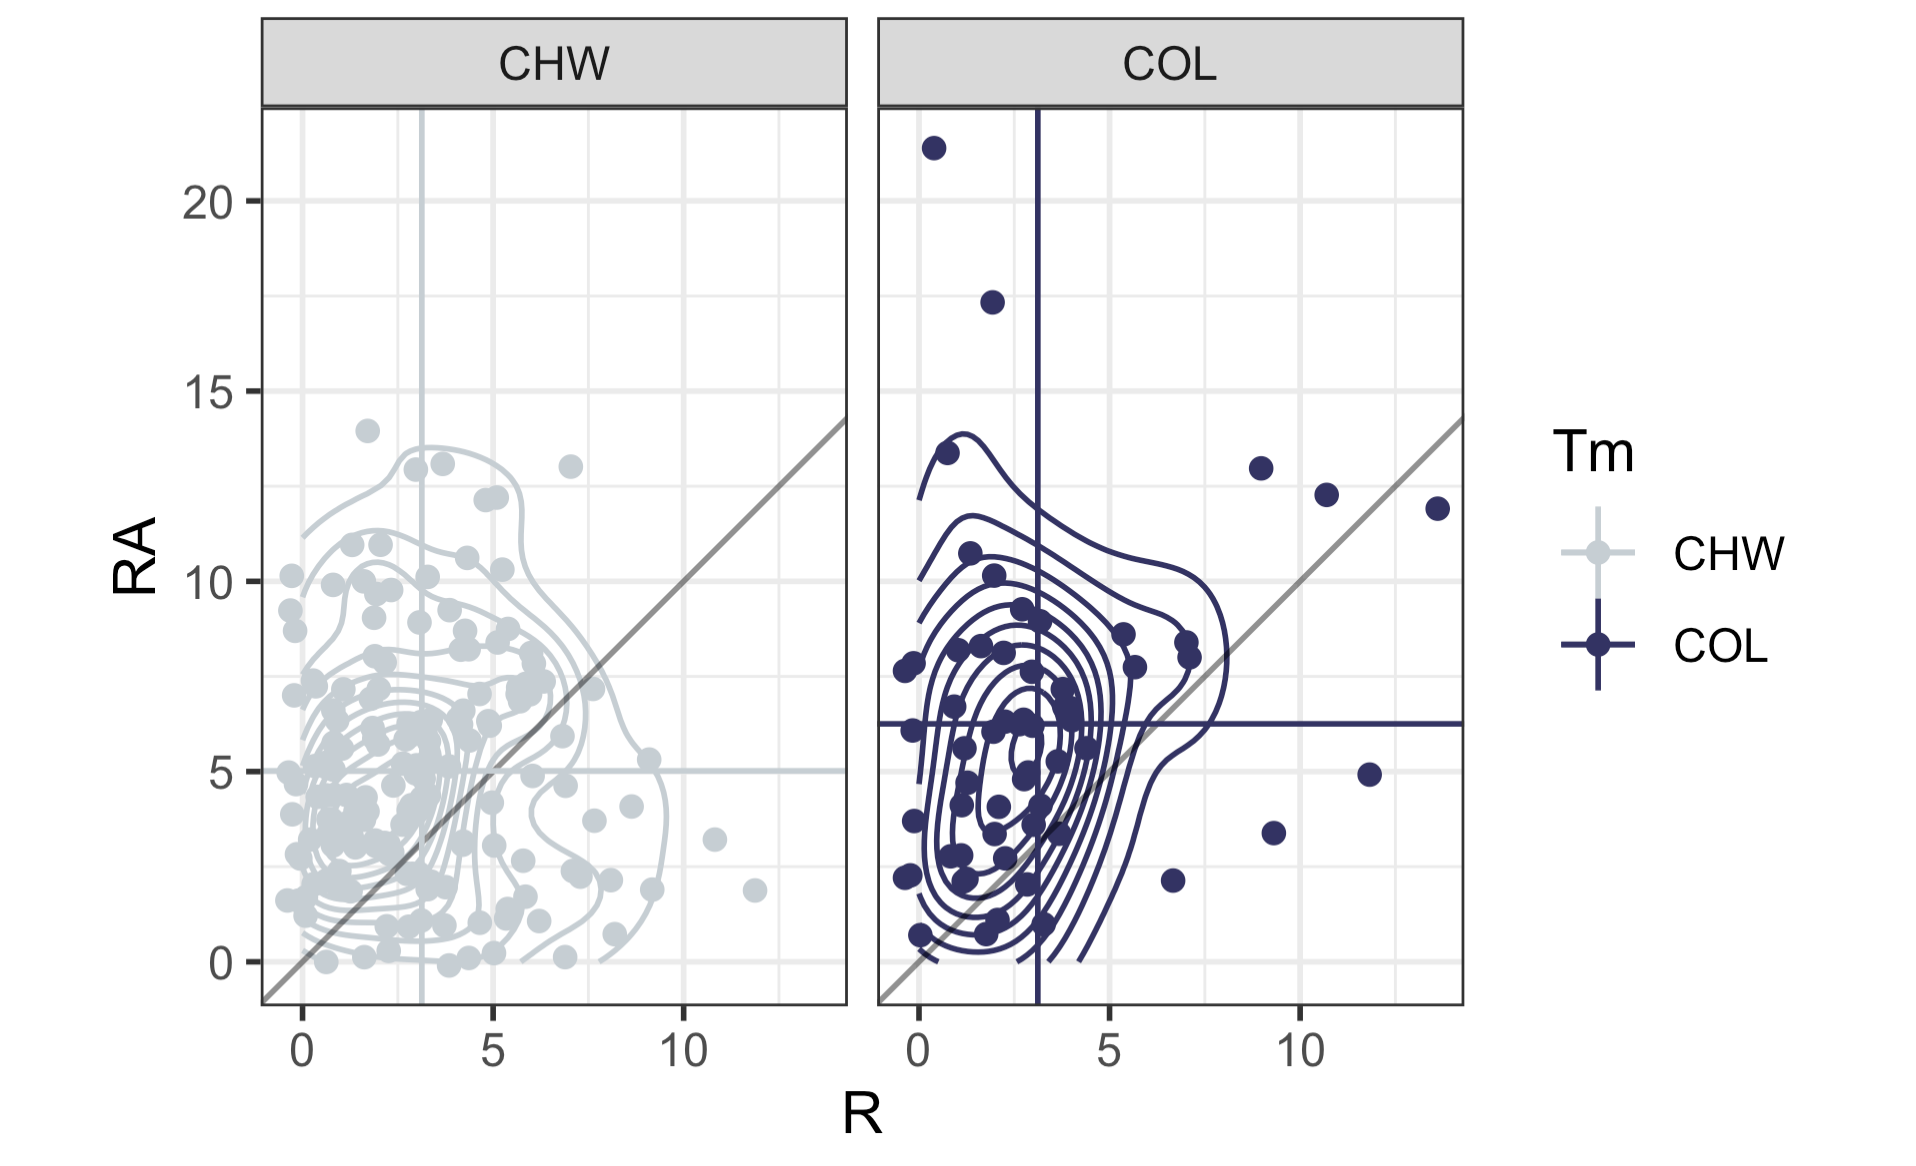
Now let’s take a look at scoring for the Rockies. Below is a 2d contour plot of for the runs for and runs against for every game from the White Sox 2024 season in the left panel and every game of the current Rockies season. The horizontal and vertical lines are the mean number of runs for and against and the diagonal lines shows whether the game was won or lost by the respective team (above the line is a loss, below the line if a win). What’s really interesting about this is that in the entire season last year, the White Sox only score 10 or more runs TWICE. The Rockies have already done this 3 times. Also, the most runs that the White Sox gave up all season was 14 runes. The Rockies have given up more than 14 runs twice already. (a 17-2 loss to the Brewers and a 21-0 loss to the Padres).
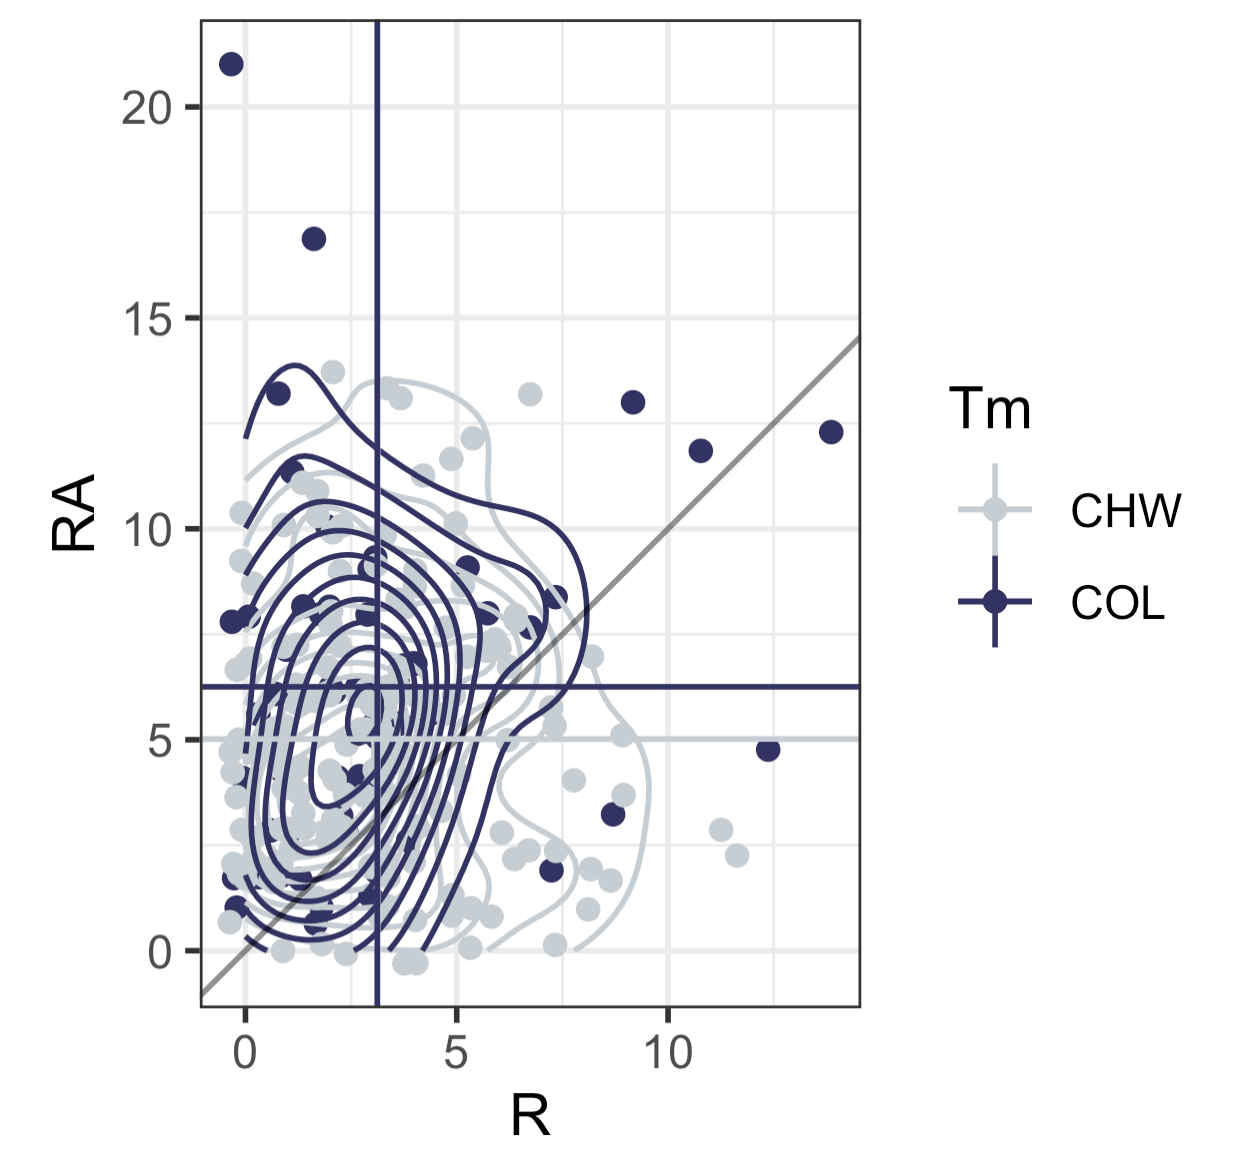
Here is what these plots look like on top of one another. What you’ll notice is that it’s hard to see the vertical line for the White Sox (i.e. their mean number of runs) because it’s nearly identical to the Rockies. The White Sox average 3.13 runs per game last year and the Rockies are just slightly below that at 3.12 runs per game. But where Colorado really “shines” is their defense. While the White Sox gave up an average of just over 5 runs per game (5.02, to be exact), the Rockies are currently allowing, and I can’t believe this is true, 6.25 runs per game. That 1.23 more runs per game on average than the worst team in the modern history of baseball. Incredible work.
If you’re a median type of person, I computed those two. The White Sox last year scored a median of 3 runs and allowed a median of 5 runs. For the Rockies this year, they are scoring a median of 2 runs and allowing a median of 6 runs.
Anyway, the point is that the Rockies are [really]+ bad.
My code is below.
Cheers.
rock <- read.csv("/Users/gregorymatthews/Dropbox/statsinthewild/rockies2025_20250602.csv")
ws <- read.csv("/Users/gregorymatthews/Dropbox/statsinthewild/whitesox2024.csv")

names(rock)[1] <- names(ws)[1] <- "gameno"
rock$streak_num <- as.numeric(paste0(substring(rock$Streak,1,1),nchar(rock$Streak)))
rock$W <- as.numeric(unlist(lapply(strsplit(rock$W.L.1,"-"),function(x){x[1]})))
rock$L <- as.numeric(unlist(lapply(strsplit(rock$W.L.1,"-"),function(x){x[2]})))

ws$streak_num <- as.numeric(paste0(substring(ws$Streak,1,1),nchar(ws$Streak)))
ws$W <- as.numeric(unlist(lapply(strsplit(ws$W.L.1,"-"),function(x){x[1]})))
ws$L <- as.numeric(unlist(lapply(strsplit(ws$W.L.1,"-"),function(x){x[2]})))
both <- rbind(rock,ws)

library(tidyverse)
library(teamcolors)
small <- teamcolors %>% filter(name %in% c("Chicago White Sox","Colorado Rockies"))
ggplot(aes(x = gameno, y = W,color = Tm), data =both) +
  geom_path() +
  theme_bw() +
  scale_color_manual(values = c(small$secondary[1],small$primary[2])) +
  xlab("Game Number")

ggplot(aes(x = gameno, y = streak_num, col = Tm), data = both) + geom_point() + theme_bw() + facet_grid(Tm~1) + scale_color_manual(values = c(small$secondary[1],small$primary[2])) + xlab("Game Number")

ggplot(aes(x = R, y = RA, color = Tm), data = both) +
  geom_jitter() +
  geom_density2d() +
  scale_color_manual(values = c(small$secondary[1],small$primary[2])) +
  theme_bw() + geom_abline(slope = 1, color = rgb(0,0,0,.5)) +
  geom_vline(aes(xintercept = R, color = Tm), data = both %>% group_by(Tm) %>% summarise(R = mean(R),RA = mean(RA))) +
  geom_hline(aes(yintercept = RA, color = Tm), data = both %>% group_by(Tm) %>% summarise(R = mean(R),RA = mean(RA))) + coord_fixed() +

both %>% group_by(Tm) %>% summarise(median(R),median(RA))
both %>% group_by(Tm) %>% summarise(mean(R),mean(RA))

both %>% filter(Tm == "COL") %>% pull(R) %>% table()
both %>% filter(Tm == "CHW") %>% pull(R) %>% table()
Posted on June 2, 2025, in Baseball, Uncategorized and tagged Baseball, fitness, MLB, SPorts. Bookmark the permalink. 2 Comments.

I love that streak figure, is that original? Nice contours too
I don’t know. It just seemed like a natural way to plot it. I’m gonna be following the Rockies all year. I like good teams, but I love train wrecks.