Author Archives: statsinthewild
AI fails again
I was trying to fit a mixed effects model and I waned to compare the model with the same fixed effects with and without a random intercept in an ANOVA. So I wasn’t sure how to do this using lmer from the lme4 package. So I googled it:

It gave me the following answer with code:

# Example data
data <- data.frame(
  response = rnorm(100),
  fixed_effect_1 = rnorm(100),
  fixed_effect_2 = rnorm(100)
)

# Fit a linear mixed model with no random effects
model <- lmer(response ~ fixed_effect_1 + fixed_effect_2, data = data)

# Display the model summary
summary(model)
I was pretty sure this wouldn't work, but I tried it anyway. And it doesn't work. You can't fit an lmer model without specifying random effects. 
For the record, I’m not sure my question even makes sense. I think I should be comparing these models with AIC rather than ANOVA, now that I think about it for more than a second.
Anyway,
Cheers.
However bad you think the Rockies are, they are worse. Even worse than the White Sox last year (so far).
Update: They swept the Marlins and are now on a 3 game winning streak and sit at 12-50. They are 25 games out of first place with 100 games to play.
Update: They won last night and are now 10-50 as of noon on June 3.
The Rockies are 9-50. That’s 50 losses in 59 games. A winning percentage of .153. That’s the fastest any team has gotten to 50 losses since 1901. But didn’t we just get a new worst ever team last year in the Chicago White Sox? Yup! The Chicago White Sox lost 121 games last year, the most ever. And the Rockies are currently on pace to shat. ter. the White Sox loss record from last year. They are currently on pace to go 25-137. How bad is this? At this point in the season, the White sox were 15-44. SIX games ahead of where the Rockies are right now. To see this, let’s look at some data viz that I made.
Below is a plot of game number versus cumulative wins. Up until about game 30 the Rockies were merely just as bad as the White Sox. Since then they have really stepped down their game thanks to multiple 8 game losing streaks. Speaking of streaks, let’s take a look at that.

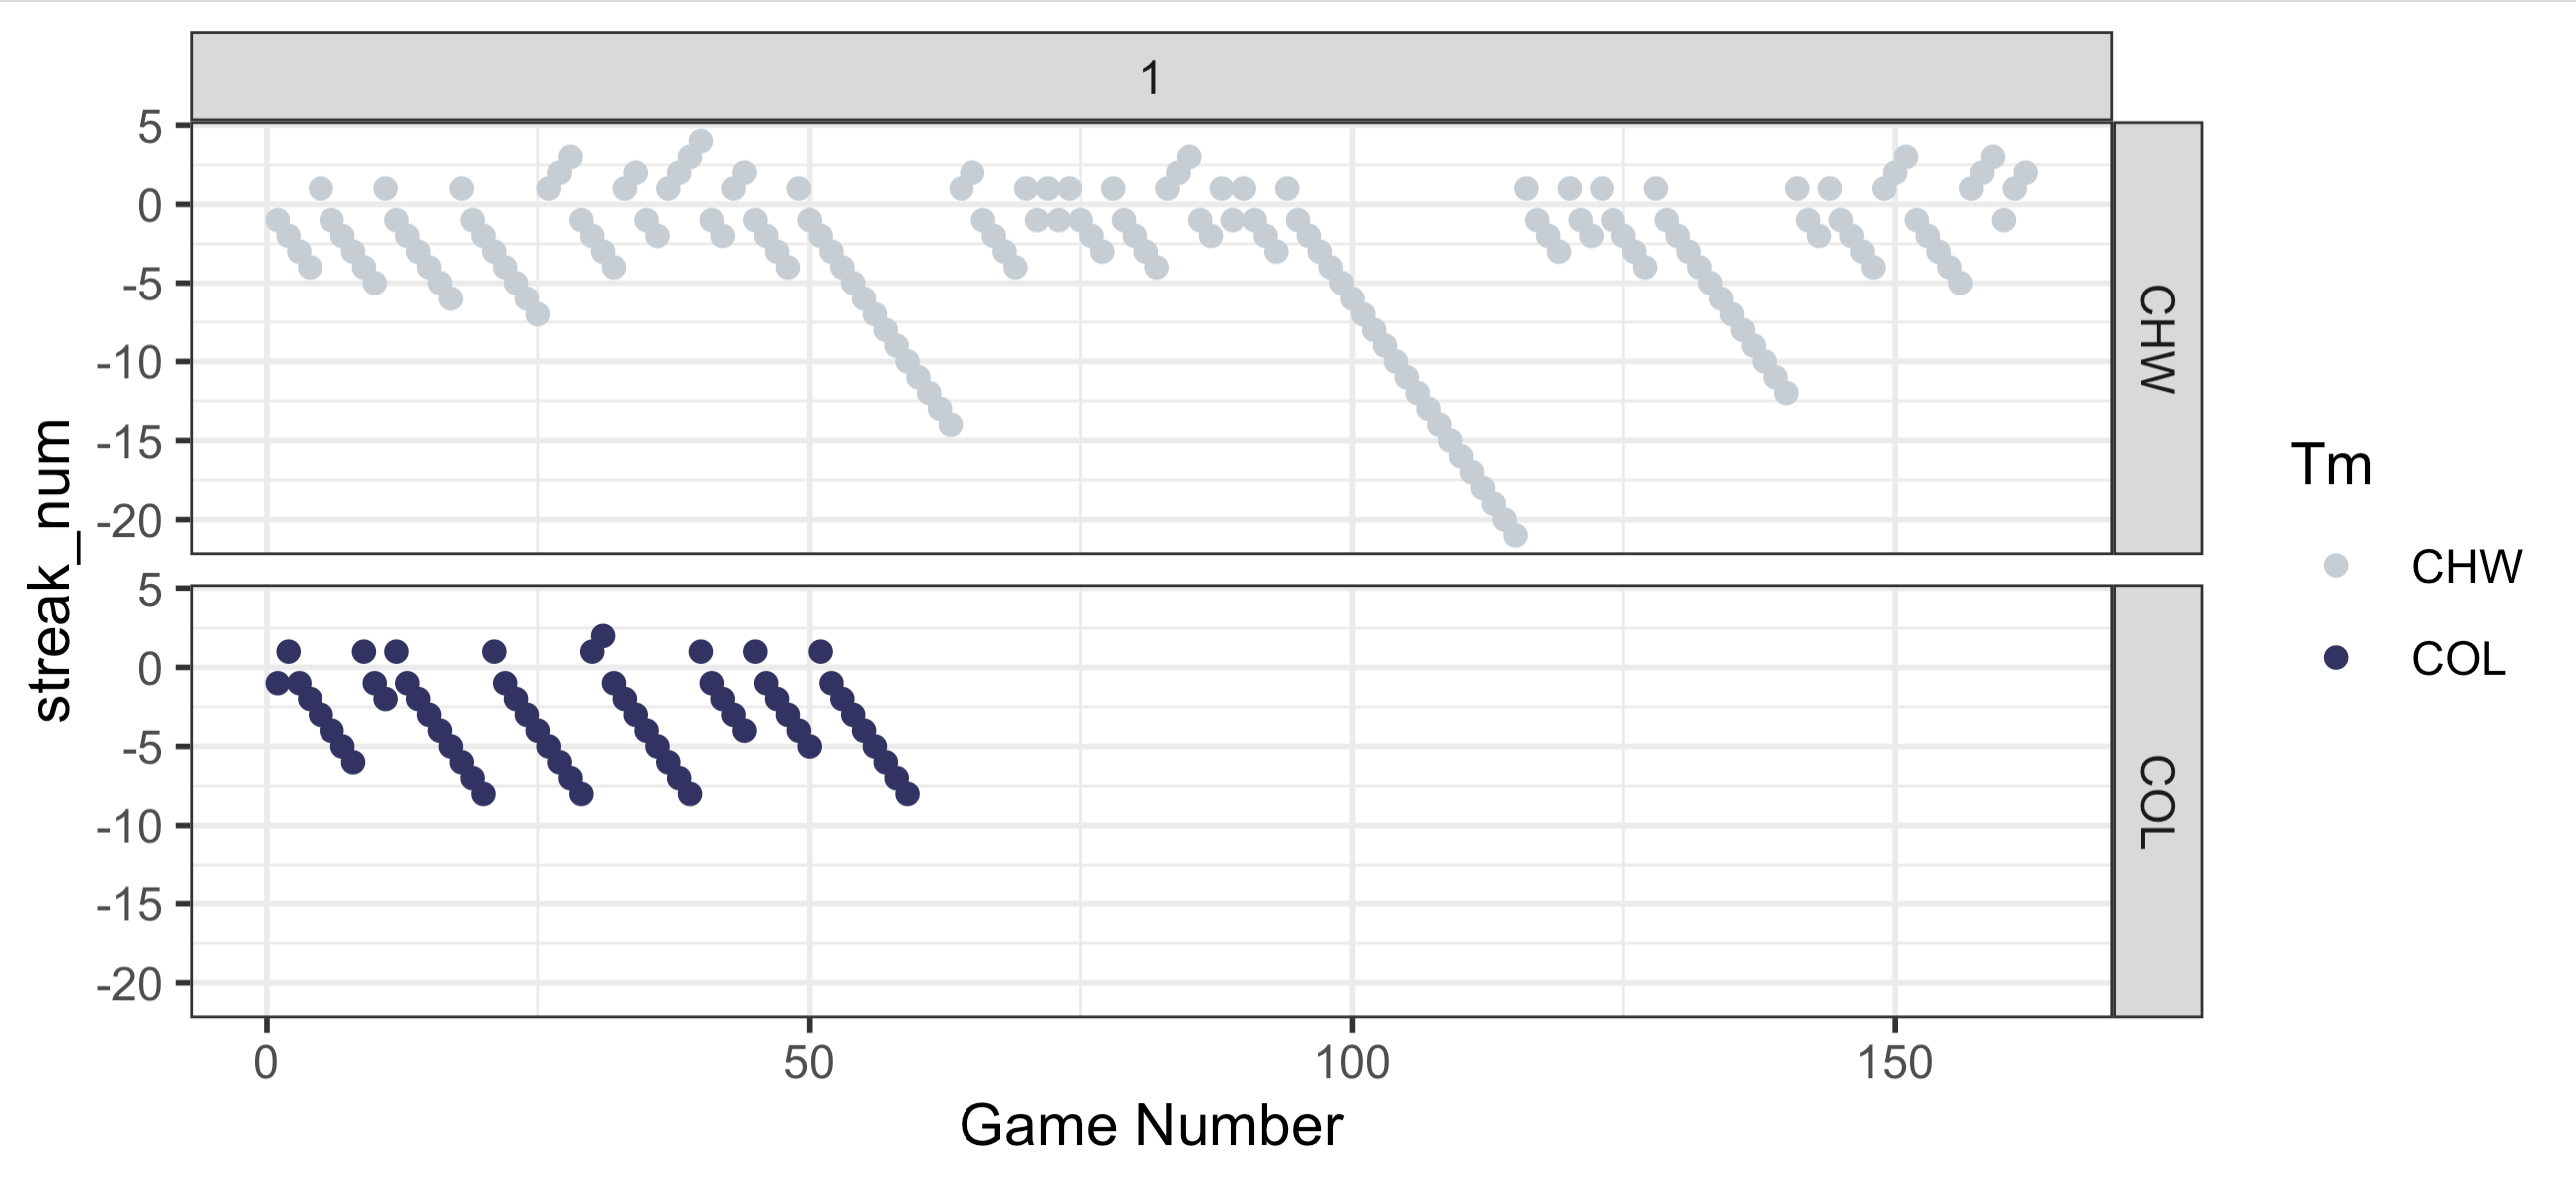
Below, you’ll find a plot of game number on the x axis and the win/loss streak on the y-axis. Positive numbers are winning streaks and negative numbers are losing streaks. You can see that the Rockies have already had FOUR 8 game losing streaks. But even more impressive than that is that they’ve only won back to back games a single time this season. Let me repeat this: Their largest win streak of the season is 2 games and it’s happened exactly once. The White Sox last year has winning streak of 2 or more 9 times total and 4 up to this point in the season,. They even had a nifty little 4 game winning streak (They also had losing streaks of 12, 14, and 21(!!!) games).
Now let’s take a look at scoring for the Rockies. Below is a 2d contour plot of for the runs for and runs against for every game from the White Sox 2024 season in the left panel and every game of the current Rockies season. The horizontal and vertical lines are the mean number of runs for and against and the diagonal lines shows whether the game was won or lost by the respective team (above the line is a loss, below the line if a win). What’s really interesting about this is that in the entire season last year, the White Sox only score 10 or more runs TWICE. The Rockies have already done this 3 times. Also, the most runs that the White Sox gave up all season was 14 runes. The Rockies have given up more than 14 runs twice already. (a 17-2 loss to the Brewers and a 21-0 loss to the Padres).
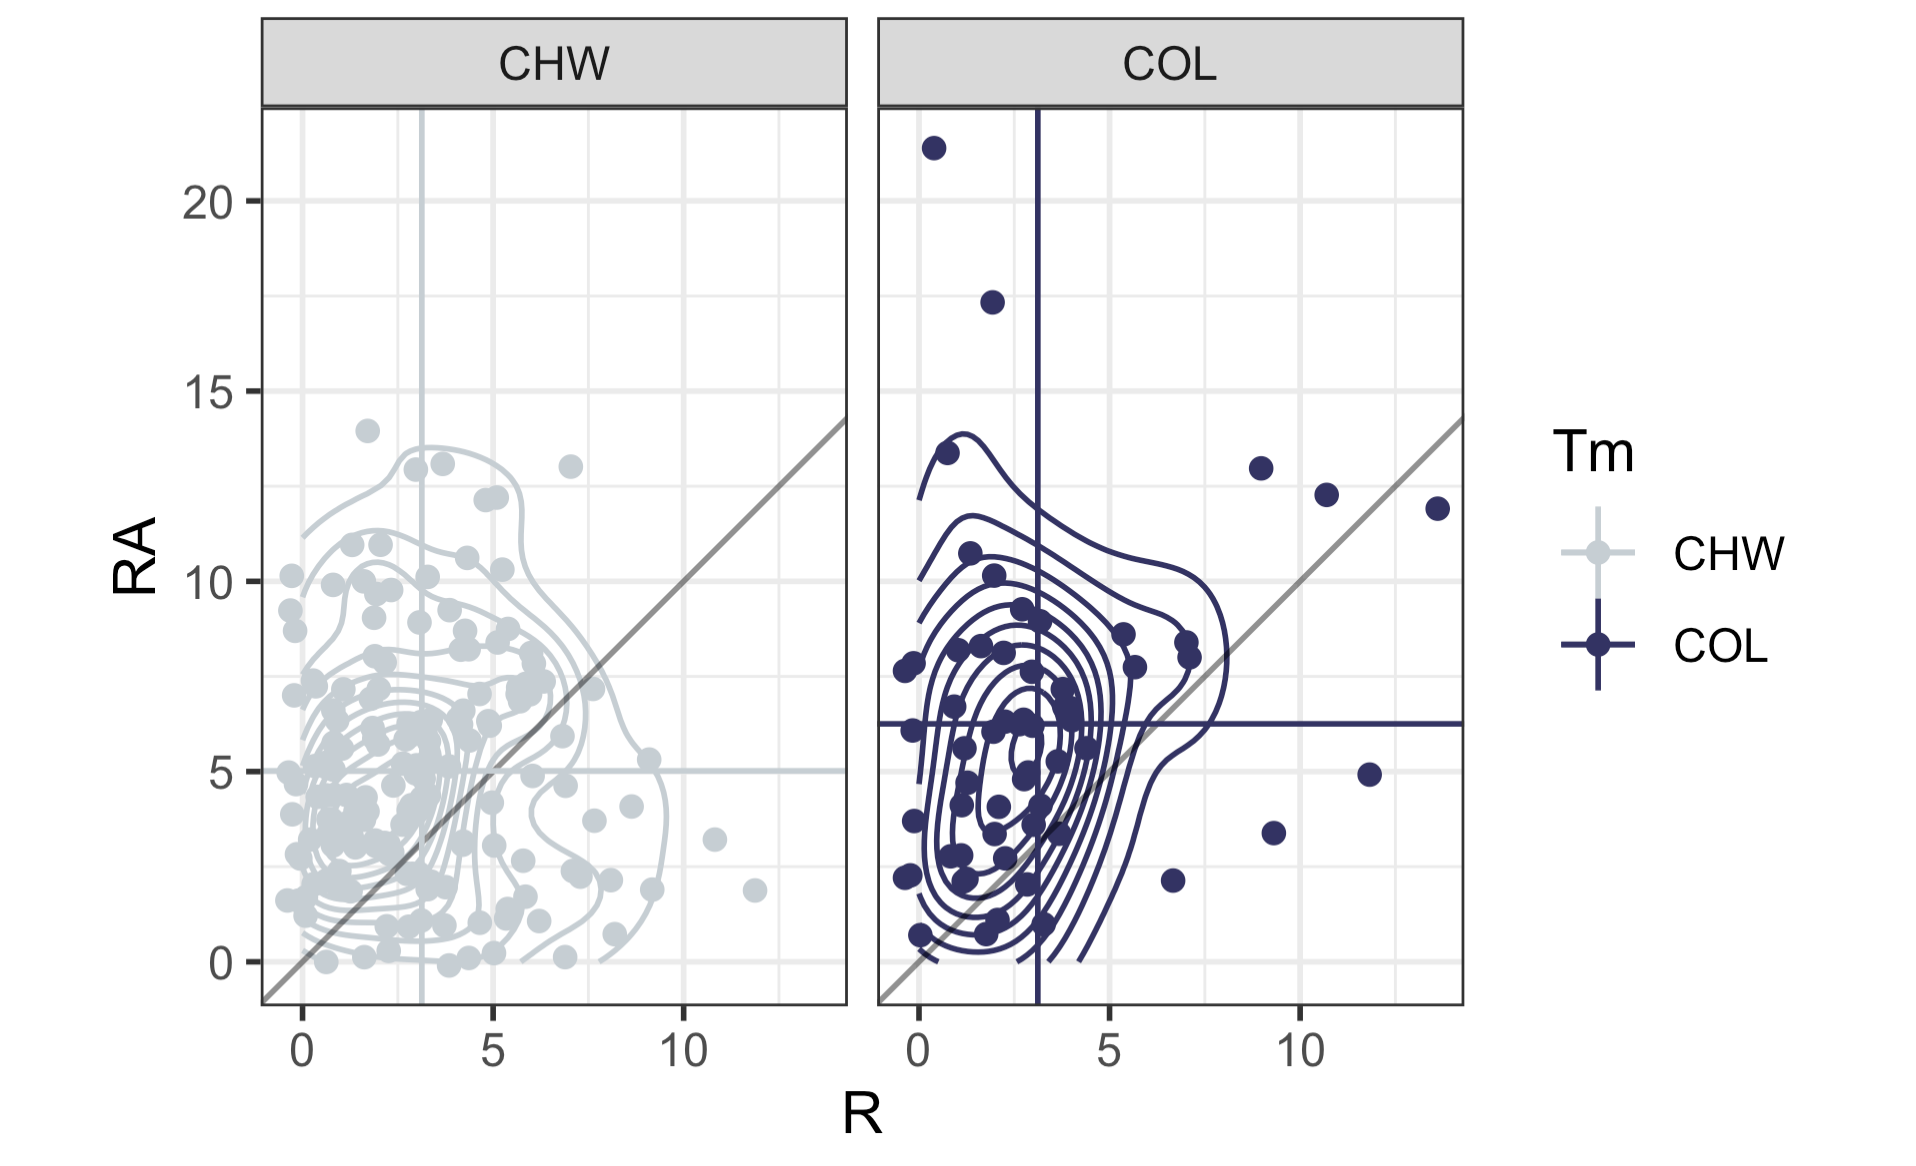
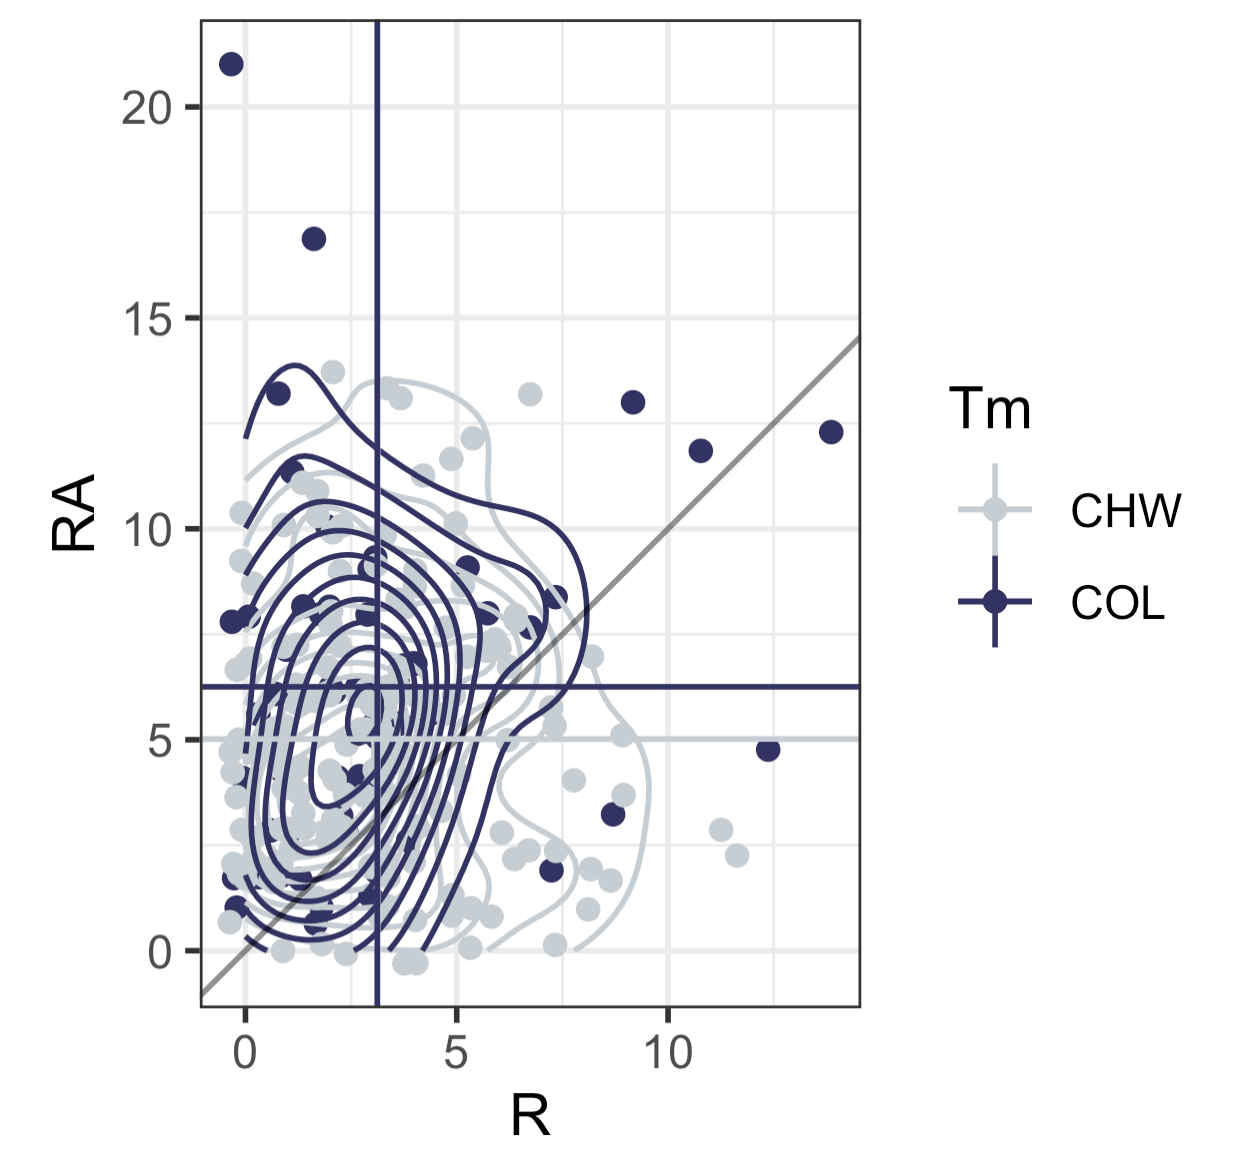
Here is what these plots look like on top of one another. What you’ll notice is that it’s hard to see the vertical line for the White Sox (i.e. their mean number of runs) because it’s nearly identical to the Rockies. The White Sox average 3.13 runs per game last year and the Rockies are just slightly below that at 3.12 runs per game. But where Colorado really “shines” is their defense. While the White Sox gave up an average of just over 5 runs per game (5.02, to be exact), the Rockies are currently allowing, and I can’t believe this is true, 6.25 runs per game. That 1.23 more runs per game on average than the worst team in the modern history of baseball. Incredible work.
If you’re a median type of person, I computed those two. The White Sox last year scored a median of 3 runs and allowed a median of 5 runs. For the Rockies this year, they are scoring a median of 2 runs and allowing a median of 6 runs.
Anyway, the point is that the Rockies are [really]+ bad.
My code is below.
Cheers.
rock <- read.csv("/Users/gregorymatthews/Dropbox/statsinthewild/rockies2025_20250602.csv")
ws <- read.csv("/Users/gregorymatthews/Dropbox/statsinthewild/whitesox2024.csv")

names(rock)[1] <- names(ws)[1] <- "gameno"
rock$streak_num <- as.numeric(paste0(substring(rock$Streak,1,1),nchar(rock$Streak)))
rock$W <- as.numeric(unlist(lapply(strsplit(rock$W.L.1,"-"),function(x){x[1]})))
rock$L <- as.numeric(unlist(lapply(strsplit(rock$W.L.1,"-"),function(x){x[2]})))

ws$streak_num <- as.numeric(paste0(substring(ws$Streak,1,1),nchar(ws$Streak)))
ws$W <- as.numeric(unlist(lapply(strsplit(ws$W.L.1,"-"),function(x){x[1]})))
ws$L <- as.numeric(unlist(lapply(strsplit(ws$W.L.1,"-"),function(x){x[2]})))
both <- rbind(rock,ws)

library(tidyverse)
library(teamcolors)
small <- teamcolors %>% filter(name %in% c("Chicago White Sox","Colorado Rockies"))
ggplot(aes(x = gameno, y = W,color = Tm), data =both) +
  geom_path() +
  theme_bw() +
  scale_color_manual(values = c(small$secondary[1],small$primary[2])) +
  xlab("Game Number")

ggplot(aes(x = gameno, y = streak_num, col = Tm), data = both) + geom_point() + theme_bw() + facet_grid(Tm~1) + scale_color_manual(values = c(small$secondary[1],small$primary[2])) + xlab("Game Number")

ggplot(aes(x = R, y = RA, color = Tm), data = both) +
  geom_jitter() +
  geom_density2d() +
  scale_color_manual(values = c(small$secondary[1],small$primary[2])) +
  theme_bw() + geom_abline(slope = 1, color = rgb(0,0,0,.5)) +
  geom_vline(aes(xintercept = R, color = Tm), data = both %>% group_by(Tm) %>% summarise(R = mean(R),RA = mean(RA))) +
  geom_hline(aes(yintercept = RA, color = Tm), data = both %>% group_by(Tm) %>% summarise(R = mean(R),RA = mean(RA))) + coord_fixed() +

both %>% group_by(Tm) %>% summarise(median(R),median(RA))
both %>% group_by(Tm) %>% summarise(mean(R),mean(RA))

both %>% filter(Tm == "COL") %>% pull(R) %>% table()
both %>% filter(Tm == "CHW") %>% pull(R) %>% table()
Live blogging the 2024 presidential election
2:54am Central Time:
So, uh, what went wrong in that Selzer poll?
10:32pm Central Time:
Just got back from my run. What are we doing America? What the fuck are we doing? The next four years are going to be so bad. So much worse than you can even imagine. It’s just. so. stupid. Good night. I’m gonna go watch a documentary about aliens and then smash my face through a window.
9:24pm Central Time:
I still haven’t gone running. But I haven’t checked the race in a while. It looks much worse than it did before. What the fuck are we doing America? You think this guy is gonna save the economy? Jesus. Christ.
8:27pm Central Time:
I’m going running.
8:18pm Central Time:
It’s just past quarter past 8. Nothing terribly surprising has happened so far. NYT gives Trump a 66% chance to win.

7:54pm Central Time:
Is there ANY other election in the world where the person with the most votes can lose the election? Or is it only the election to pick the most powerful person in the world?
7:44pm Central Time:
The NYT gives Trump a 53% chance to win Pennsylvania. But that prediction right now is based only on pre-election polls and their “model”. Nothing to do with actual results yet. Why even report this?

7:42pm Central Time:
I still think Harris is gonna win Pennsylvania. But it’s gonna be really, really close.
7:36pm Central Time:
Sometimes I reflect on how stupid it is that a few thousand people in Pennsylvania who probably can’t find Canada on a map get to decide who the most powerful person in the world is. Everything is so stupid.
7:35pm Central Time:
Virginia looks to be much closer than it was in 2020. That’s a good sign for Trump. How wild would it be if just everyone got this race completely wrong and Trump wins a place like Virginia and Harris wins something like Iowa or Ohio?
7:27pm Central Time:
In 2023, the Census estimates that about 44000 people from Georgia moved to Florida, around 26000 Michiganders moved to Florida, and about 28000 Pennsylvanians moved to Florida. And something like 9000 people from Wisconsin moved to Florida. Again, based on nothing, I’m guessing thats a vast majority of these people were right leaning. Would it make sense then that all these states get slightly bluer and Texas and Florida get slightly redder?
7:16pm Central Time:
Crazy theory based on nothing: Enough right leaning voters moved to Texas and Florida from swing states in the last 4 years that Trump’s margin in Florida and Texas will beat his margin’s in those states relative to 2020. But all those people leaving give Harris safe wins in swing states like Pennsylvania, Michigan, and Wisconsin (and Iowa?).
7:08pm Central Time:
New York Times has a much better data presentation than NBC News for election results. Great work NYT.
6:55pm Central Time:
Florida — already America’s inner thigh — continues to get redder and redder. And also it’s shifted further right. (“How the pandemic turned Florida red”)
6:44pm Central Time:
I’m seeing the same thing in Georgia as I saw in Indiana: Substantial shifts towards Harris in the suburbs.
For reference, Harris won Douglas County by 25.1% in 2020 and Rockdale by 40.77%. That’s about +7 and +11 with about 70% reporting. Trump in 2020 won Houston, Bartow, Oconee, and Troup by 12.42%, 50.67%, 33.47%, and 21.84%, respectively. That’s shifts of about 1, 0 , -2, and -5 for Trump. He’s about the same in counties he won last time in Georgia, but there are pretty big shifts in the Atlanta suburbs.

6:33pm Central Time:
Trump up 23-3. Kentucky, Indiana, and West Virginia for Trump; Vermont for Kamala. (Can we stop and think about how fucking weird Vermont is for a second?)
6:28pm Central Time:
Going back to Hamilton and Boone County. In 2016, Trump won Boone county by 29.12% and Hamilton by 19.32%. (Note: Boone has 91% of counties reported and Hamilton has 65%). But Trumps support in the Indianapolis suburbs has absolutely cratered since 2016.

6:18pm Central Time:
And…..they’ve called Vermont. Harris is on the board with 3 points. Trump leads 19-3.
6:16pm Central Time:
The north suburbs of Indianapolis are shifting about 8ish points towards Harris so far. That feels like a big deal to me.
- Boone County 2020: Trump by 18.38%
- Boone County 2024 (91% reporting): Trump by 10%
- Hamilton County 2020: Trump by 6.78%
- Hamilton County 2024 (65% reporting): HARRIS by 1.2%
My completely uninformed prediction for the election
I’m a guy on the internet. So naturally I have uninformed opinions. And because this is the internet, I’d like to share them with everyone because….well, what’s the point of the internet if I can’t post uninformed opinions? So here I go.
Here’s what I’ve been looking at recently. I took the polls that fivethirtyeight has listed and I took only the polls that have a grade of 2.5 or higher. I aggregated each of those polls to get a single prediction based on pooling all the polls in a sliding 15 day period. I then bootstrapped some error clouds around these predicted lines and you get the following results for swing states (plus a few bonus states) if you use polls for registered voters:
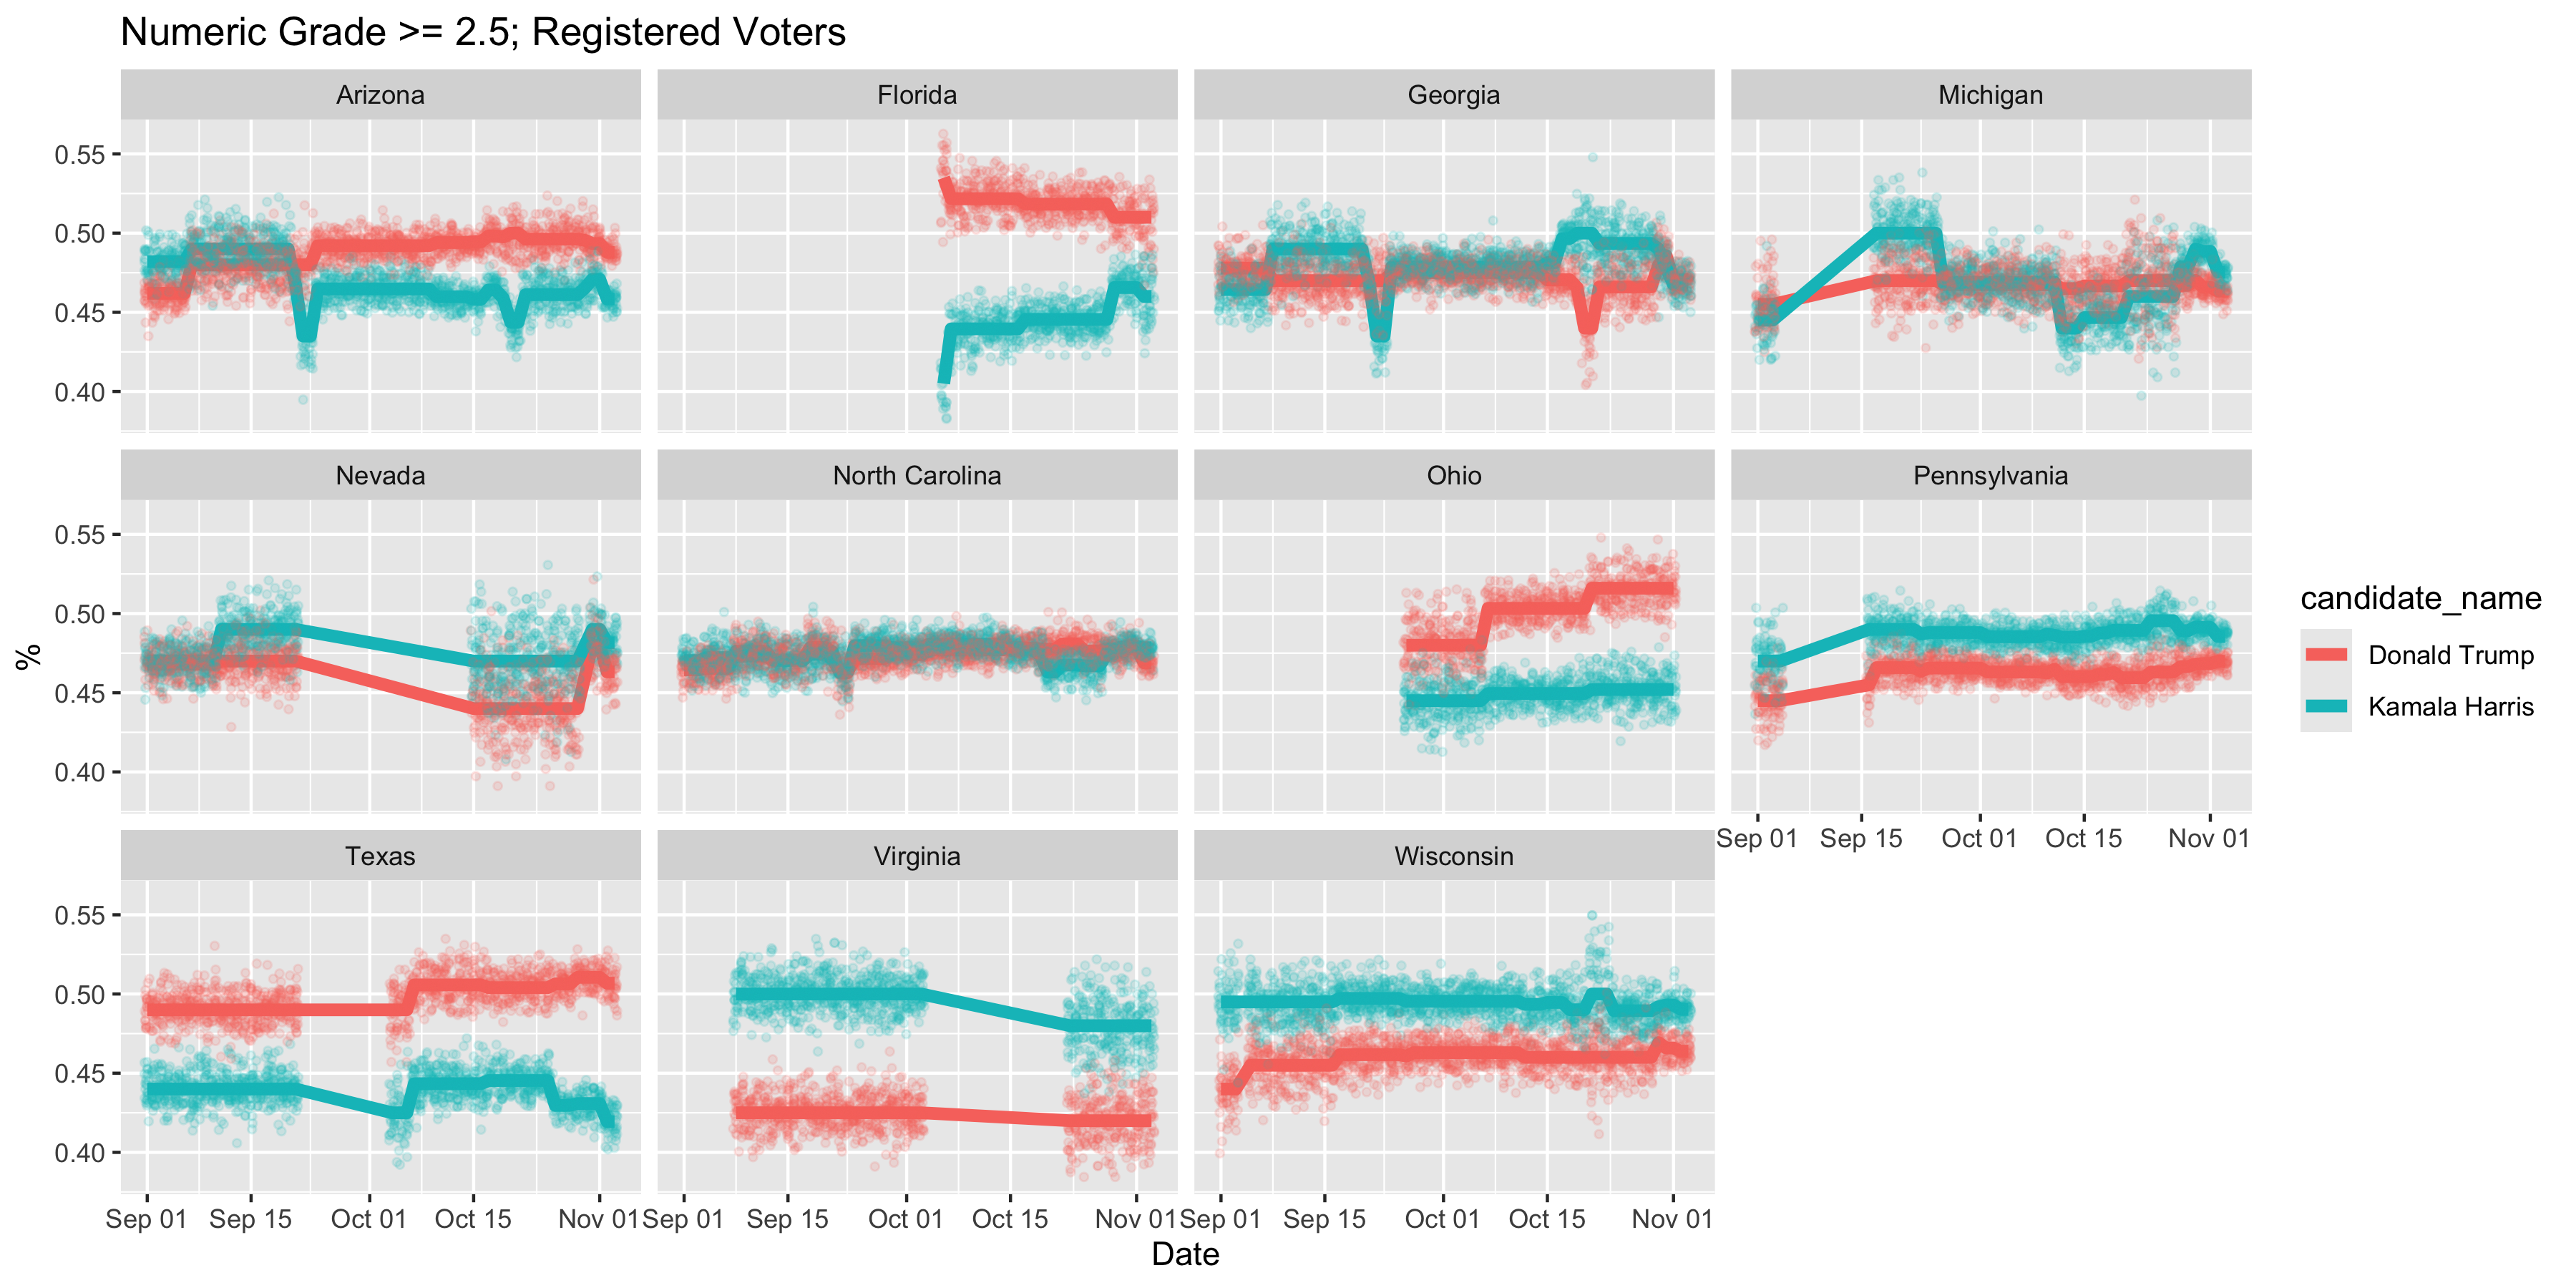
Based on these results, it looks like Pennsylvania and Wisconsin aren’t all that close and Harris has had them locked up for weeks with very little movement at all. Whereas the other swing states, Georgia, Michigan, Nevada, and North Carolina all seem incredibly close. Which gives up basically this map:

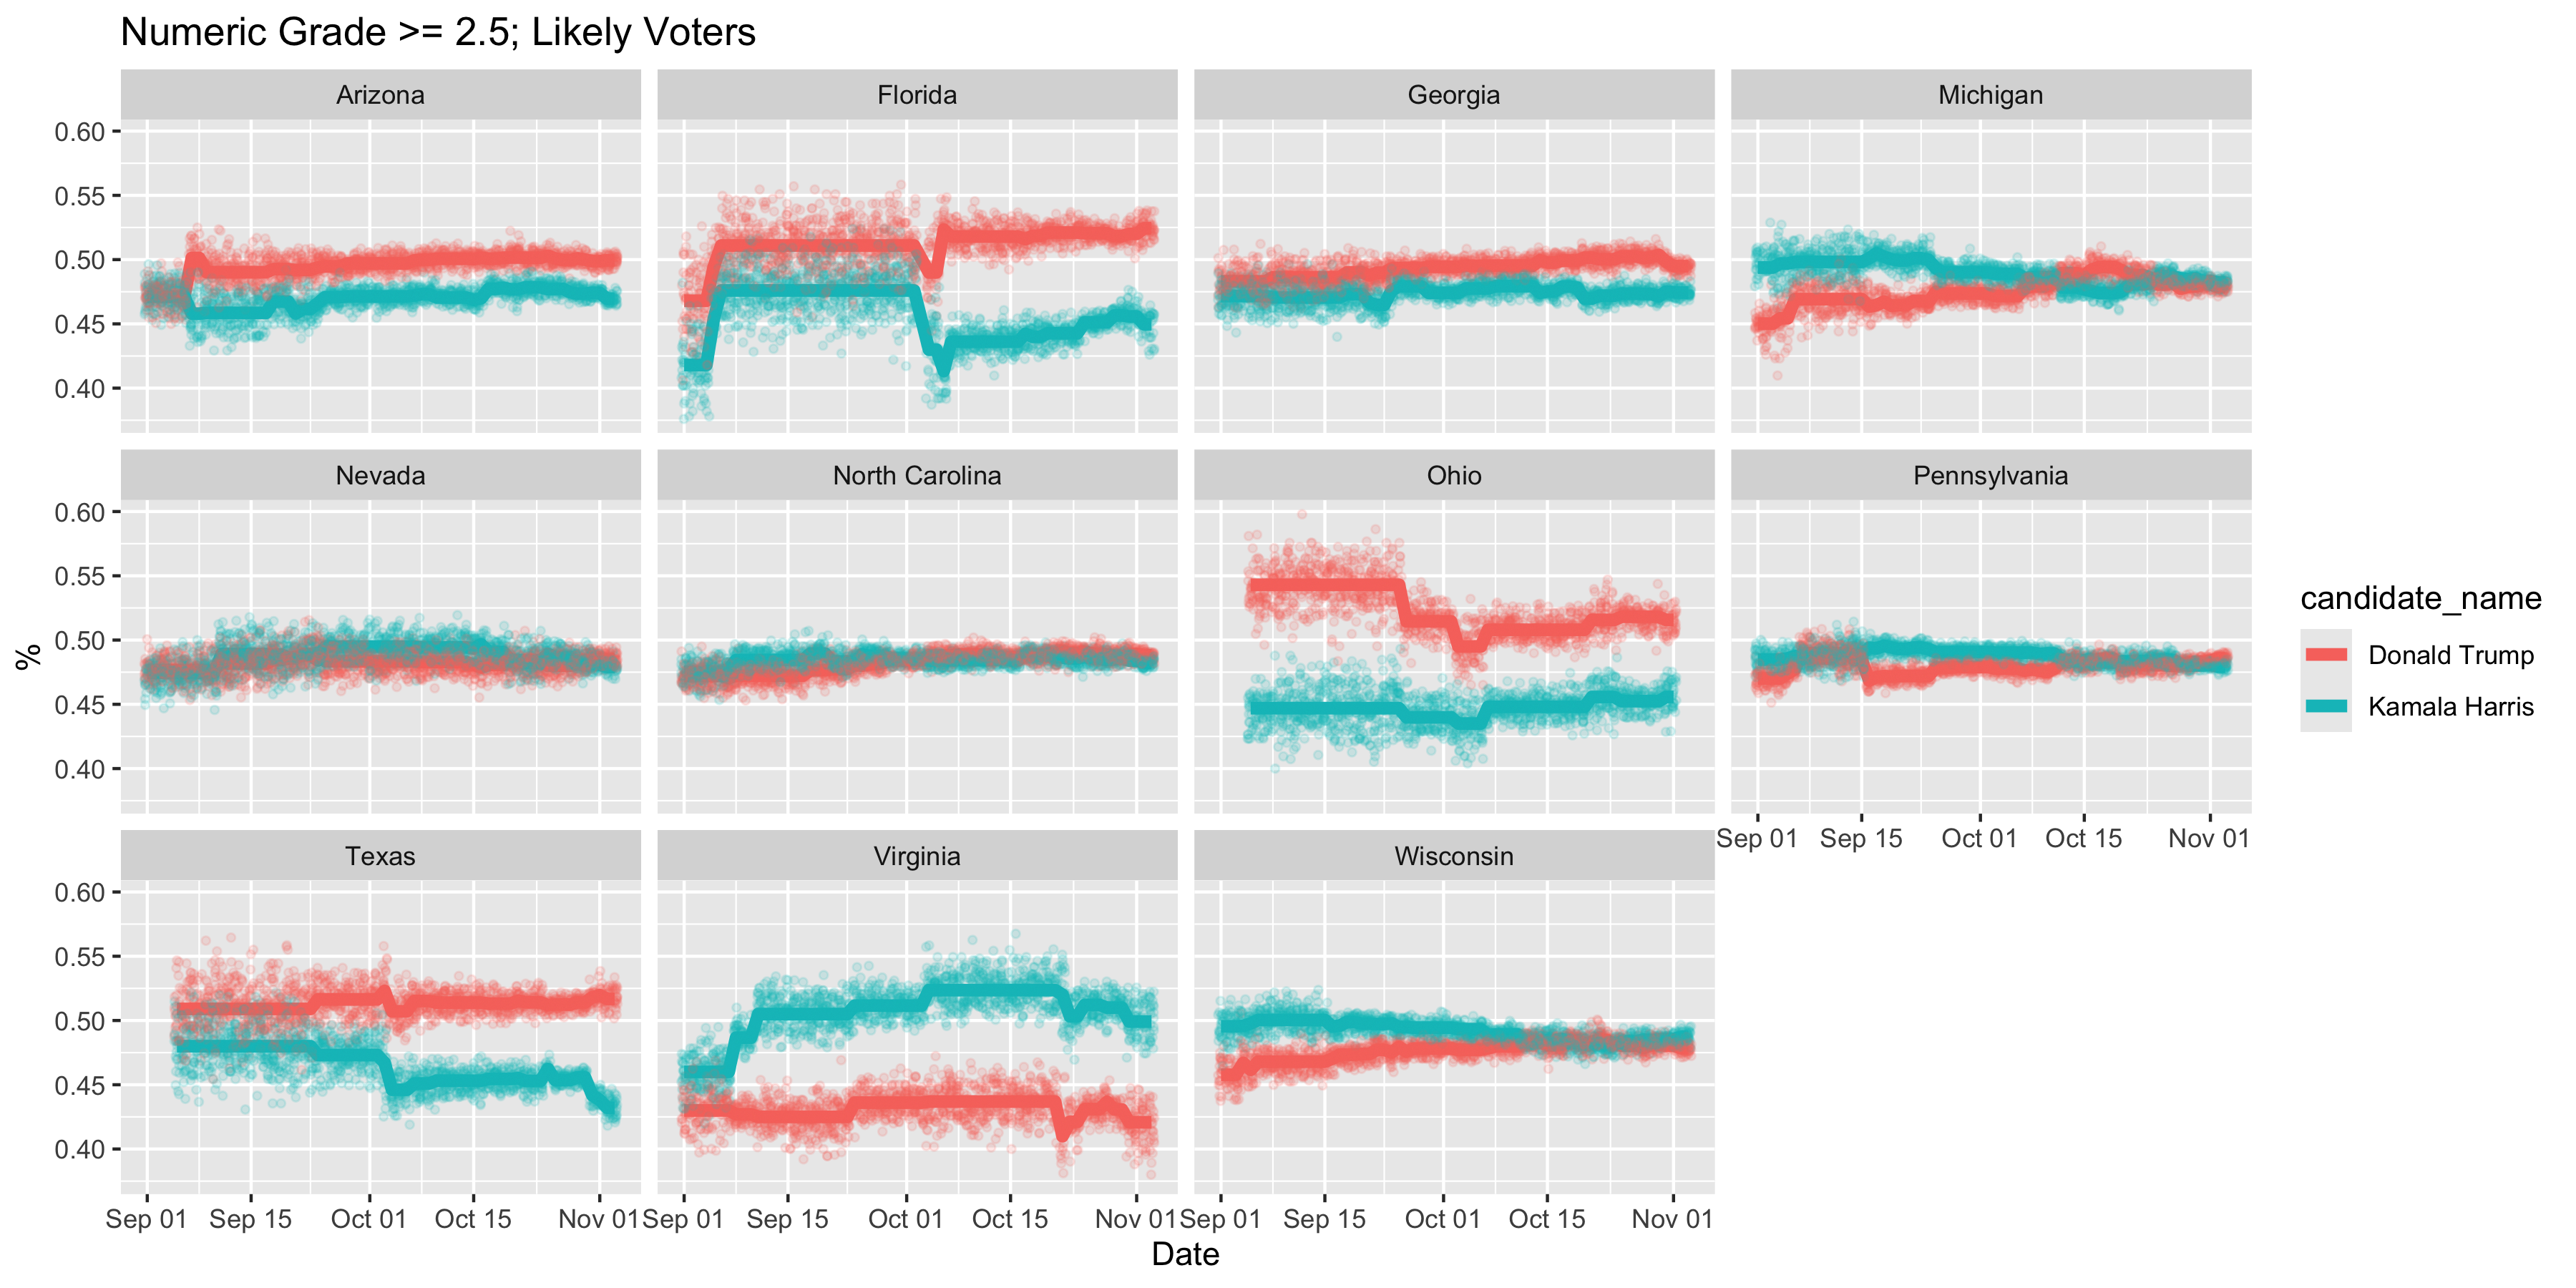
With this map all Kamala needs to win is one of Michigan and Nevada OR North Carolina OR Georgia. But if we look at likely voters, the story is different. (How do they determine likely voters? Do they ask respondents? Or do they model that?).
Here, Georgia is safely in Trumps column but the other five swing states are all statistically tied.
This would give us this map:
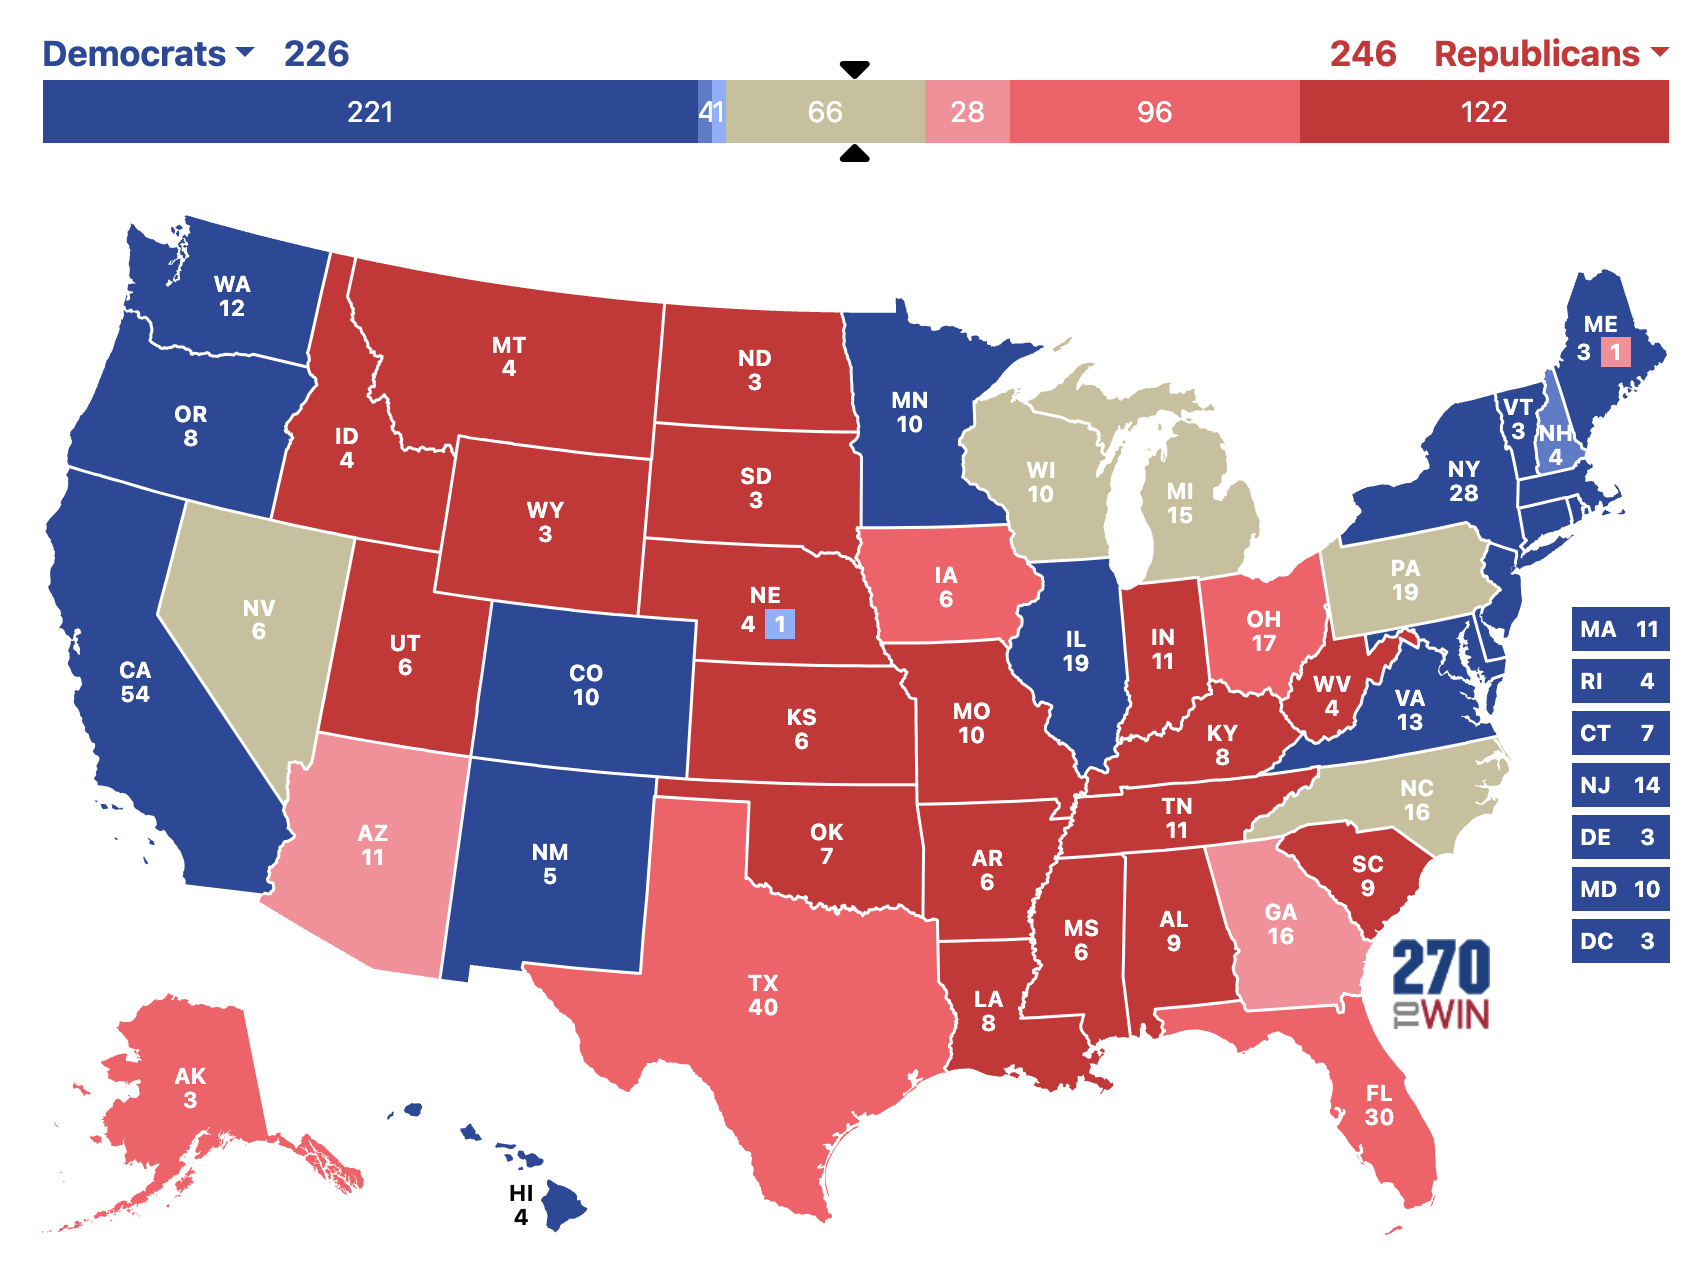
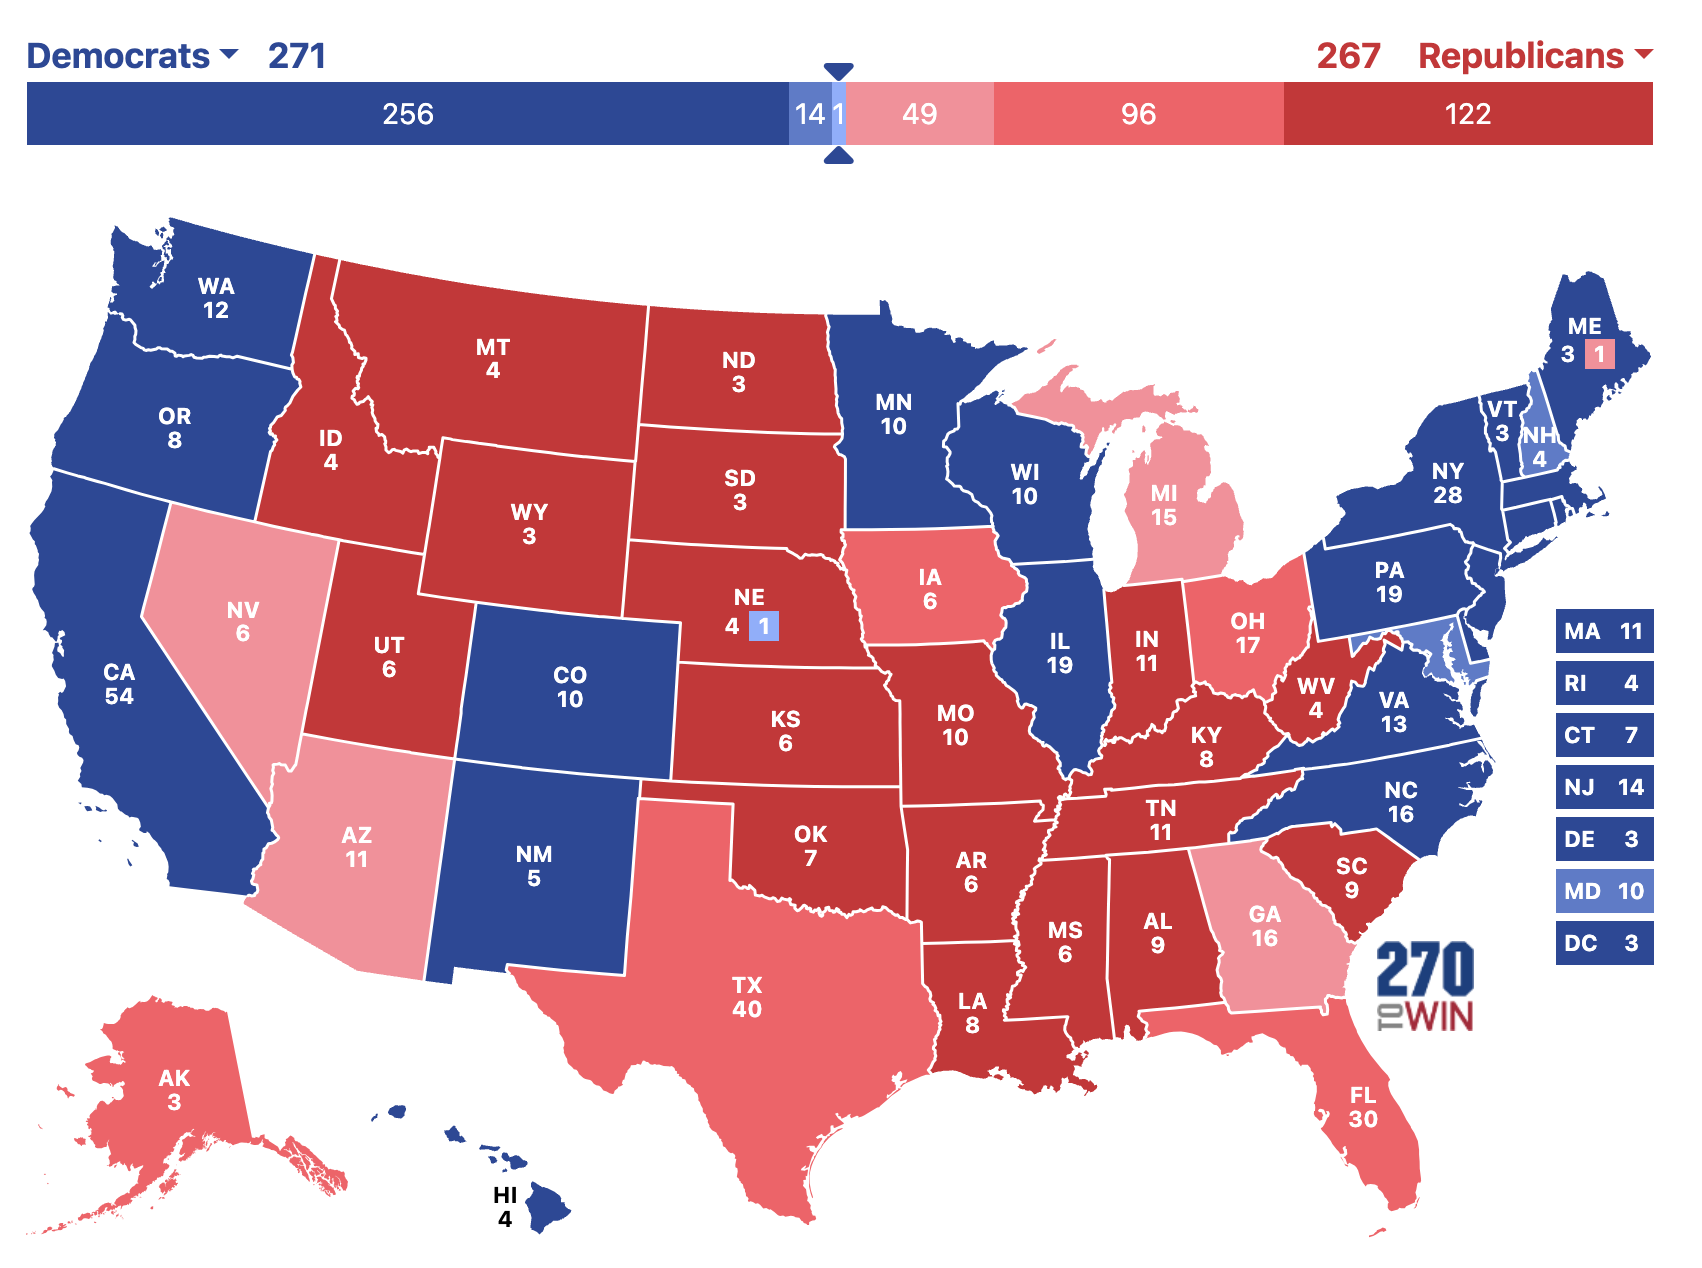
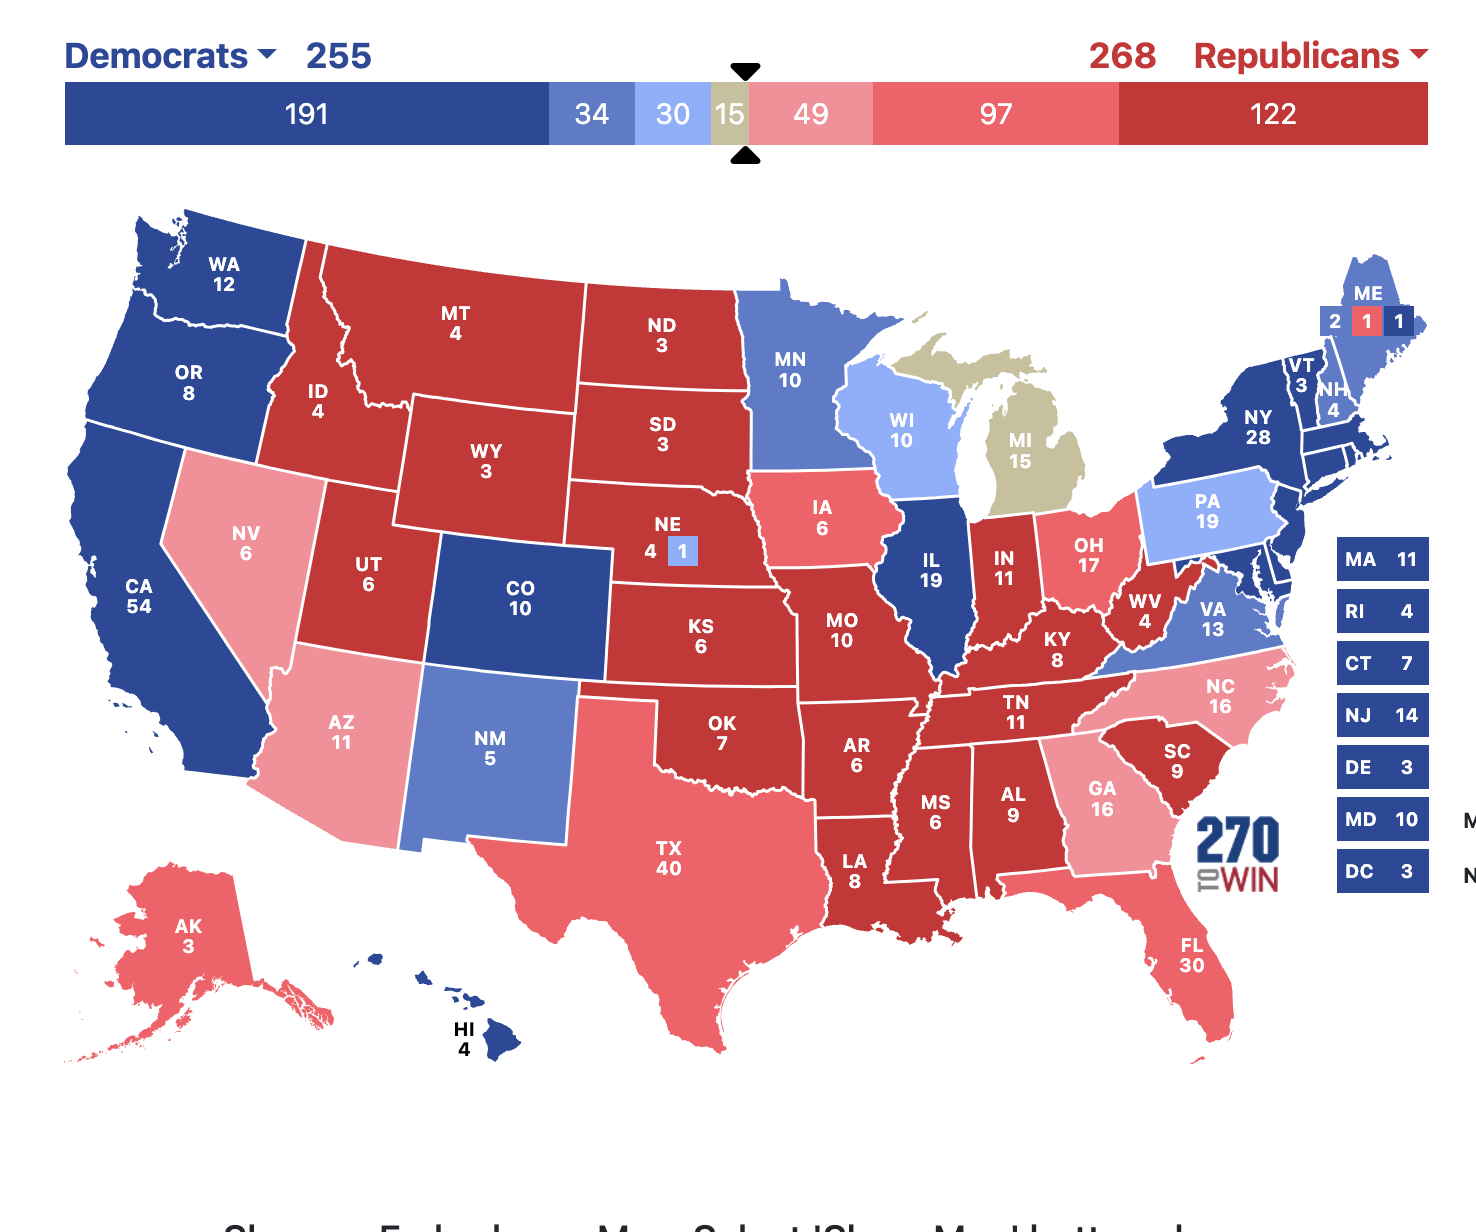
And this would mean all Trump needs to do to win would be to win any two of Wisconsin, Michigan, Pennsylvania, and North Carolina. But you didn’t come here for insight or rational discussion. This is the presidential race in 2024 where facts don’t matter and numbers are just completely made up. So what do I think will happen? I present to you my official completely uninformed prediction for the 2024 presidential race. I think Kamala wins the popular vote by 3 points and we end up with this map. And she wins by two electoral votes (and then there are 3 faithless electors and Trump wins anyway because….everything is stupid).
In all seriousness, no one knows what is going to happen. And polling is incredibly complicated in 2024. Response rates for polls used to be in the SIXTIES. Today? It’s less than 1 percent. I think about this all the time, think about this question: “Is it even possible for a pollster to reach you?”. For me the answer is 100% no. I don’t have a land line and I’m not answering my cell phone for a number I don’t know. I’m not gonna respond to an email from a pollster. So I genuinely will never be a poll responded. Now think about how true this is for everyone you know. Polling in 2024 is really difficult. That’s why even with all this polling we still have no idea who’s going to win. It is important to note than in both 2016 and 2020 Trump was underestimated in polls. Pollsters have attempted to correct for this by using something called “recall-vote weighting” which “in practice inflates Trump’s support”. So it’s very likely that Trump’s support is being over-estimated in many of these polls. And if it’s even slightly over estimated by even a point or two, Trump is going to lose very badly. But it might work! No one knows!
But I’m not a coward like Nate Silver, so I’m making a prediction: I’m taking Kamala 271 to 267. But also I am a coward and Trump might win. I have no idea what’s going to happen. But, rest assured, it will all end with chaos no matter who wins.
Cheers.
John Stewart is wrong and Joe Rogan is right (mostly).
Just a quick note unrelated to statistics.
Tony Hinchcliffe recently made a “joke” about Puerto Rico that might sway the 2024 election. And People are really mad. Hinchcliffe is being universally trashed (see what I did there) over this. But he has an unlikely defender: Jon Stewart. But Jon Stewart is wrong.
Choosing to think Tony Hinchcliffe is funny or not is a matter of personal taste. (I personally think he’s terrible, but that’s just one old man’s opinion). But the larger issue here is that context matters. Tony Hinchcliffe wasn’t on a comedy stage. He wasn’t on a celebrity roast. He wasn’t recording a comedy podcast. He was at a politically rally (A politically rally, mind you, for a guy who was recently called a fascist by an actual retired US general. That’s no small thing).
The context matters! And Joe Rogan somehow knows this better than liberal hero Jon Stewart. While Rogan also defend Hinchcliffe, he also claims he told Hinchcliffe: “It’s a political rally, and you’re doing jokes like you’re in a comedy club. Don’t do it!”
(Rogan goes on to say: “I’ve gotta tell you, that joke kills at comedy clubs. I don’t like the joke, but it kills.” What the fuck?!!?!? That joke KILLS? It’s genuinely a bad joke. It doesn’t even make sense. I don’t even understand why it’s a joke. The only way I can even conceive of it being funny is if you have some pretty terrible feelings about Puerto Rico and Puerto Ricans.)
My point is this: I’m so sick of these right wing “comedians” spewing the most racist hateful shit you’ve ever heard and then hiding behind: “It’s just a joke” and “People are so easily offended these days”. Fucking. Stop.
Finally, I think Sean O’Connor sums up the entire situation better than anyone possibly could:

Cheers.
I have no idea who is going to win, but I’d rather be Kamala than Trump right now (despite what the markets and poll aggregators are saying).
So, there are less than two weeks until election day and Trump is “leading”. FiveThirtyEight gives Trump a 54% chance to win the election. And betting markets also have Trump as a favorite to win (Polymarket gives Trump a 66.1% chance to win). And Trump might win. But…..I don’t see it. I think I’d rather be Harris right now than Trump. (But also I’m always wrong.)


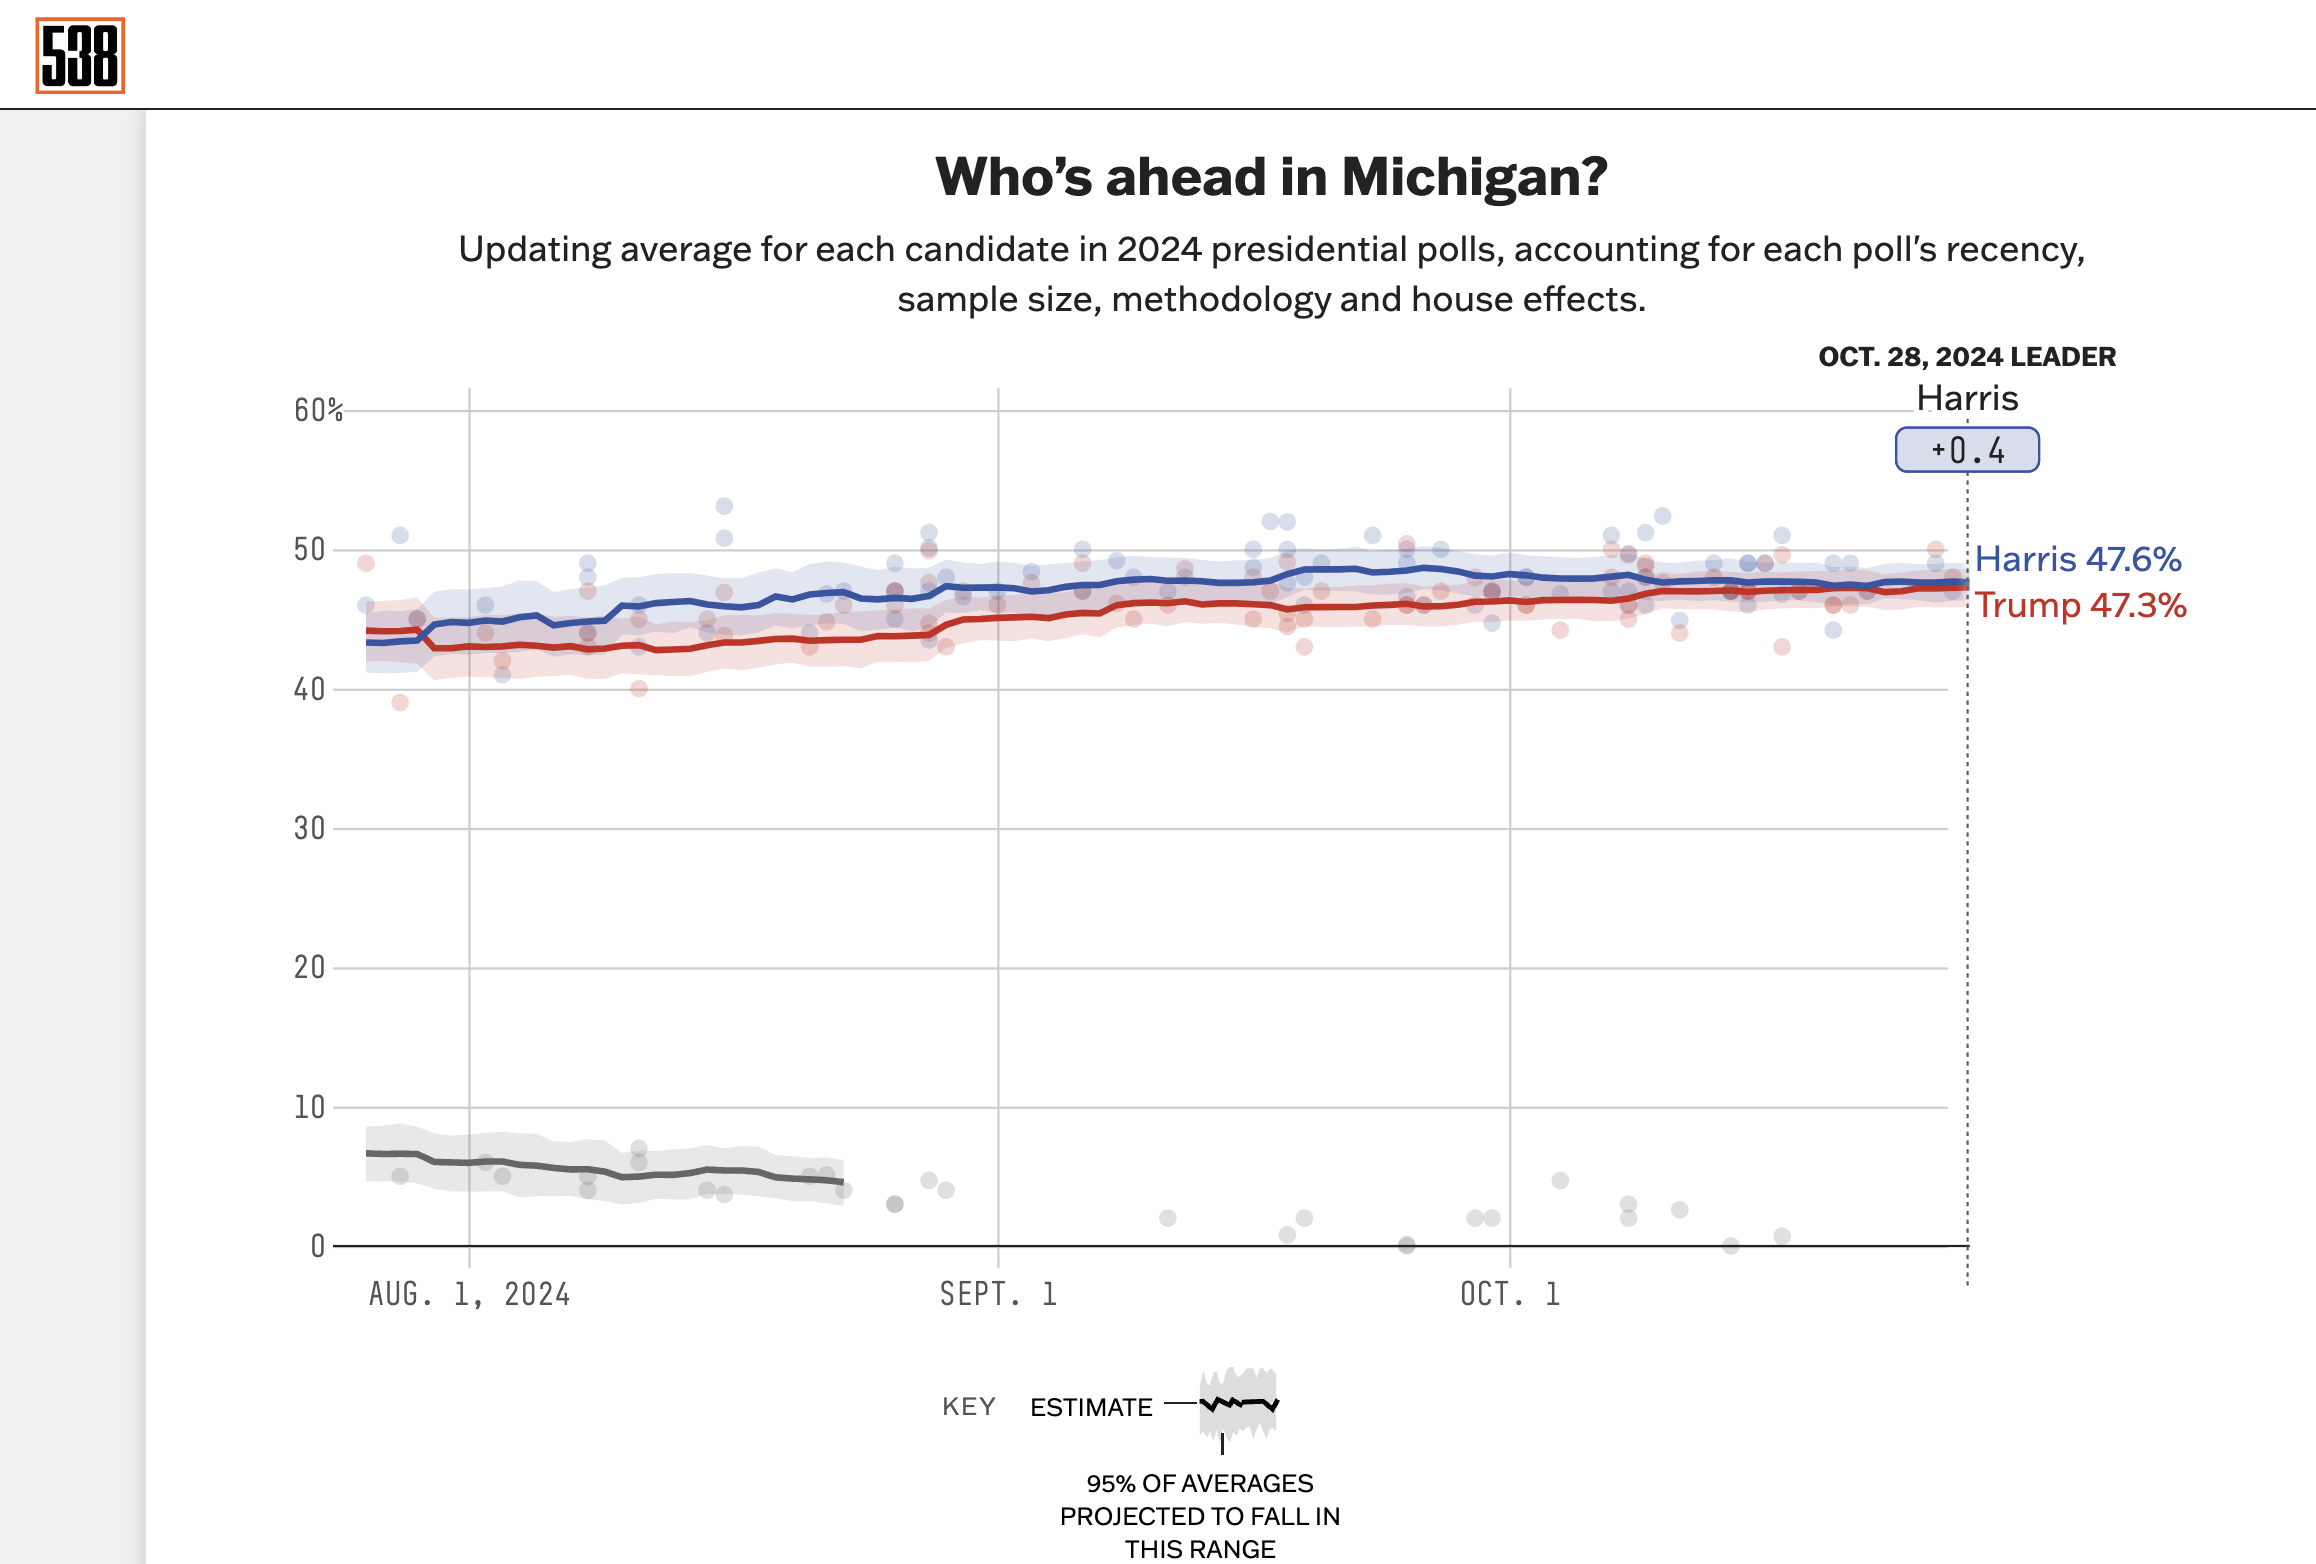
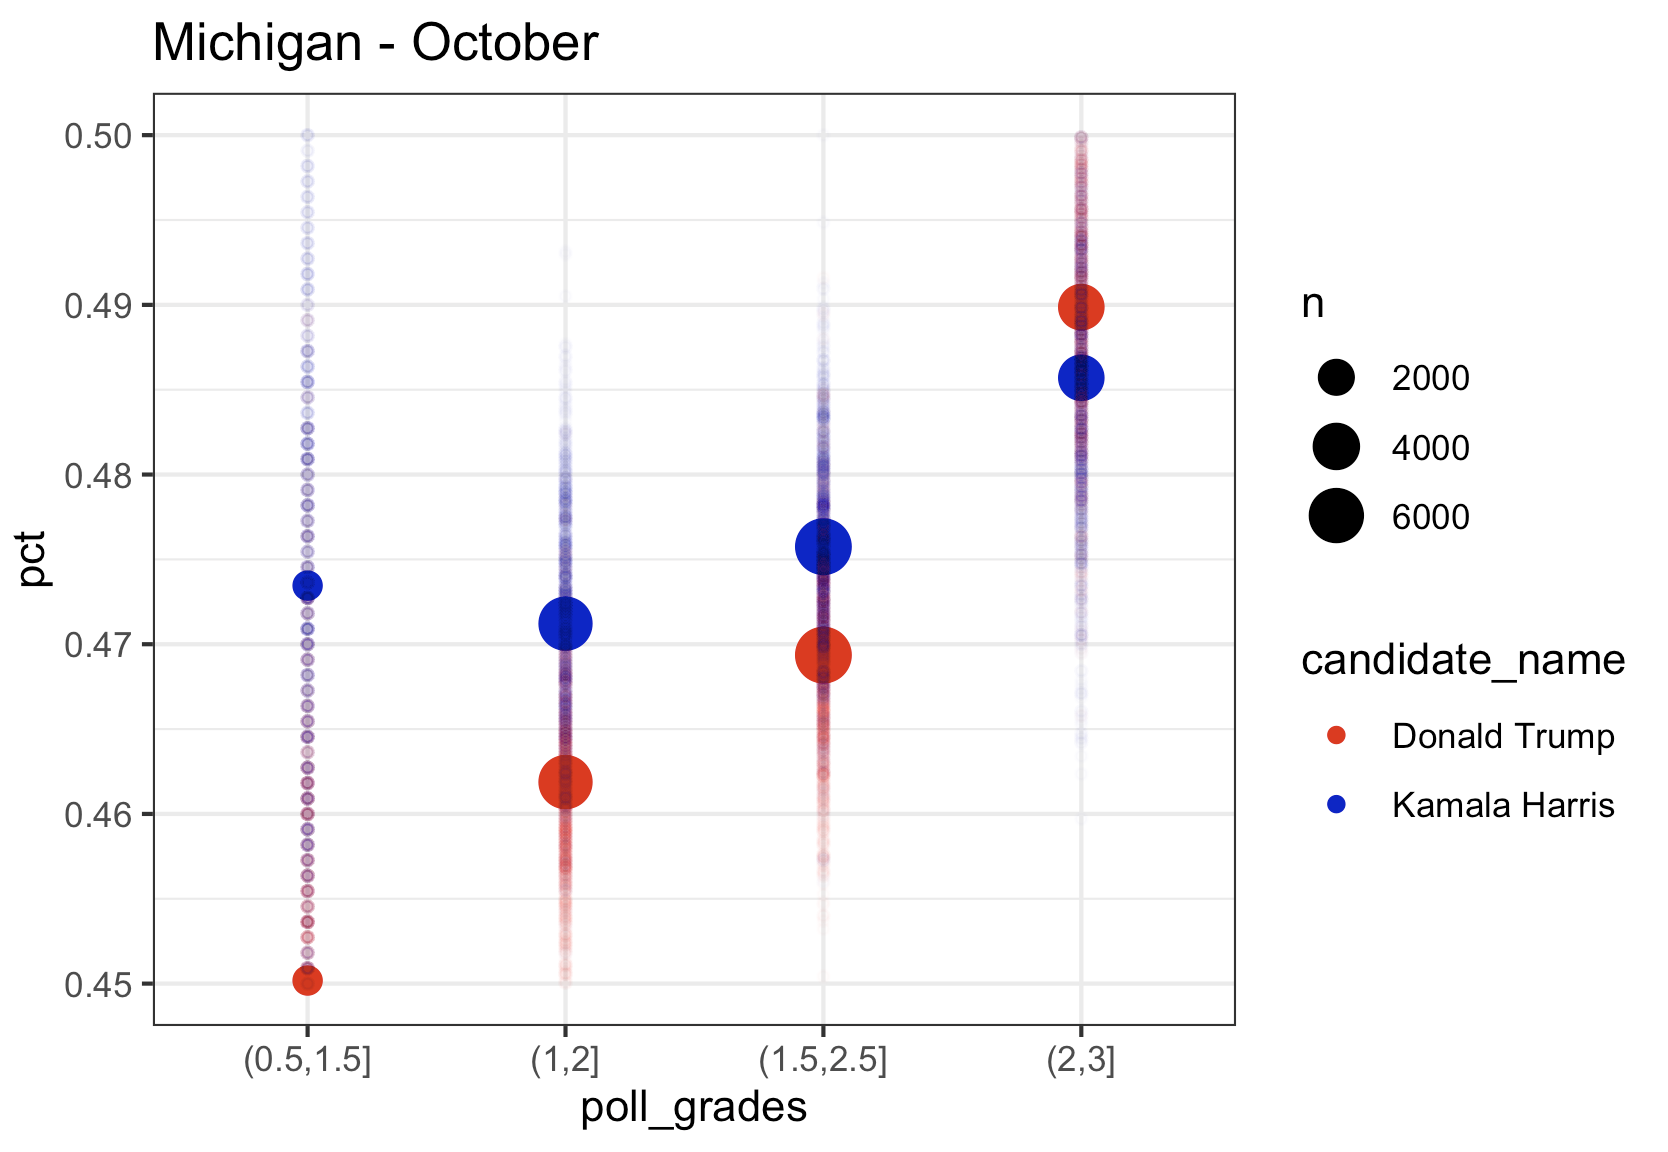
Let’s take a look at Michigan as an example. Polymarket has Trump with a 53% chance to win and FiveThirtyEight has Michigan tied (with Harris leading by 0.4% in their poll aggregator.

But when you dig into the most recent polls, there is a wildly different story. Take a look at the polls that FiveThirtyEight lists from Oct 16 through today. There are six different polling companies listed here. Two of these six have Harris leading just at about the margin of error (Quinnipiac and Bloomberg). According to FiveThirtyEight’s ranking of pollsters, based on their track record of accuracy, Quinnipiac is 2.8/3 and Morning Consult (for Bloomberg) is 1.9/3. The other four polls listed here are Trafalgar Group, The Telegraph, Patriot Polling, and InsiderAdvantange, which all have Trump tied or leading. One of these, Trafalgar Group, is designated by FiveThirtyEight as “Republican-funded” and known to skew red.

The other three are:
- The Daily Telegraph: A British Conservative newspaper that endorsed Boris Johnson in 2019. (This polls was conducted by Redfield and Wilton Strategies which is rated 1.8/3 by FiveThirtyEight).
- Patriot Polling: A “non-partisan organization” that was literally founded by high school students and has a FiveThirtyEight rating of 1.1/3.
- Insider Advantage: The founder of this company was the on air pollster for Sean Hannity. FiveThirtyEight gives this polling company a 2/3.

So, all I’m trying to say is that the polls that have been flooding the news recently are openly partisan and right leaning. If you look at only the top rated pollster in the rankings from FiveThirtyEight (Siena College), the story from them is different than the Polymarket map in two big ways: Wisconsin and Pennsylvania. Siena College has Harris leading in both those states and kind of comfortably leading in Pennsylvania. In this scenario, it all comes down to Michigan which has flip flopped between blue and red in the last two elections. But factor in that in the Senate race that Slotkin, the Democrat, is leading by 4-5 points, which is advantage Harris. I just have a. hard time imagining a huge number of people voting for Slotkin and Trump. But who knows. I’m always wrong.
The point is this: Boy howdy, this is going to be close. Buckle up and strap in because we aren’t gonna now who won for days (weeks?) after election night. But I’d rather be Harris right now than Trump.
Cheers.
Some thoughts on this election and the polls.
So someone pointed me to this article, “Weaponized Polling Is More Dangerous Than Ever” where the author argues that right leaning pollsters (or “pollsters”) are conducting polls that intentionally make Trump look like he’s in a stronger position than he is. (The author goes on to offer what I consider to be compelling reasons why they are doing this.)
But I wanted to check this for myself. So, I went and got the poll data from fivethirtyeight.com (Click here to download the latest polling data from fivethirtyeight as a .csv file). Fivethrityeight also includes grades for each of the pollsters based on past performance.
The lowest rated polls in fivethirtyeight are:
- McLaughlin – 0.5
- Peak Insights – 0.6
- Research America – 0.7
- The Political Matrix/The Listener Group – 07.
- Trafalgar Group – 0.7
- Hendrix College – 0.9
- Tulchin Research – 0.9
On the other end of the spectrum, fivethirtyeight gives only 8 pollsters their top grade of 3: ABC/Washington Post, Marquette Law School, McCourtney Institute/YouGov, Siena/NYT, The Washington Post, YouGov, and YouGov Blue. Many of the top University polls have just slightly lower ratings like Emerson, Marist, Suffolks, UMass – Lowell (all 2.9 out of 3). In total, there are 158 polls with 80 of them rated 2.0 or higher.
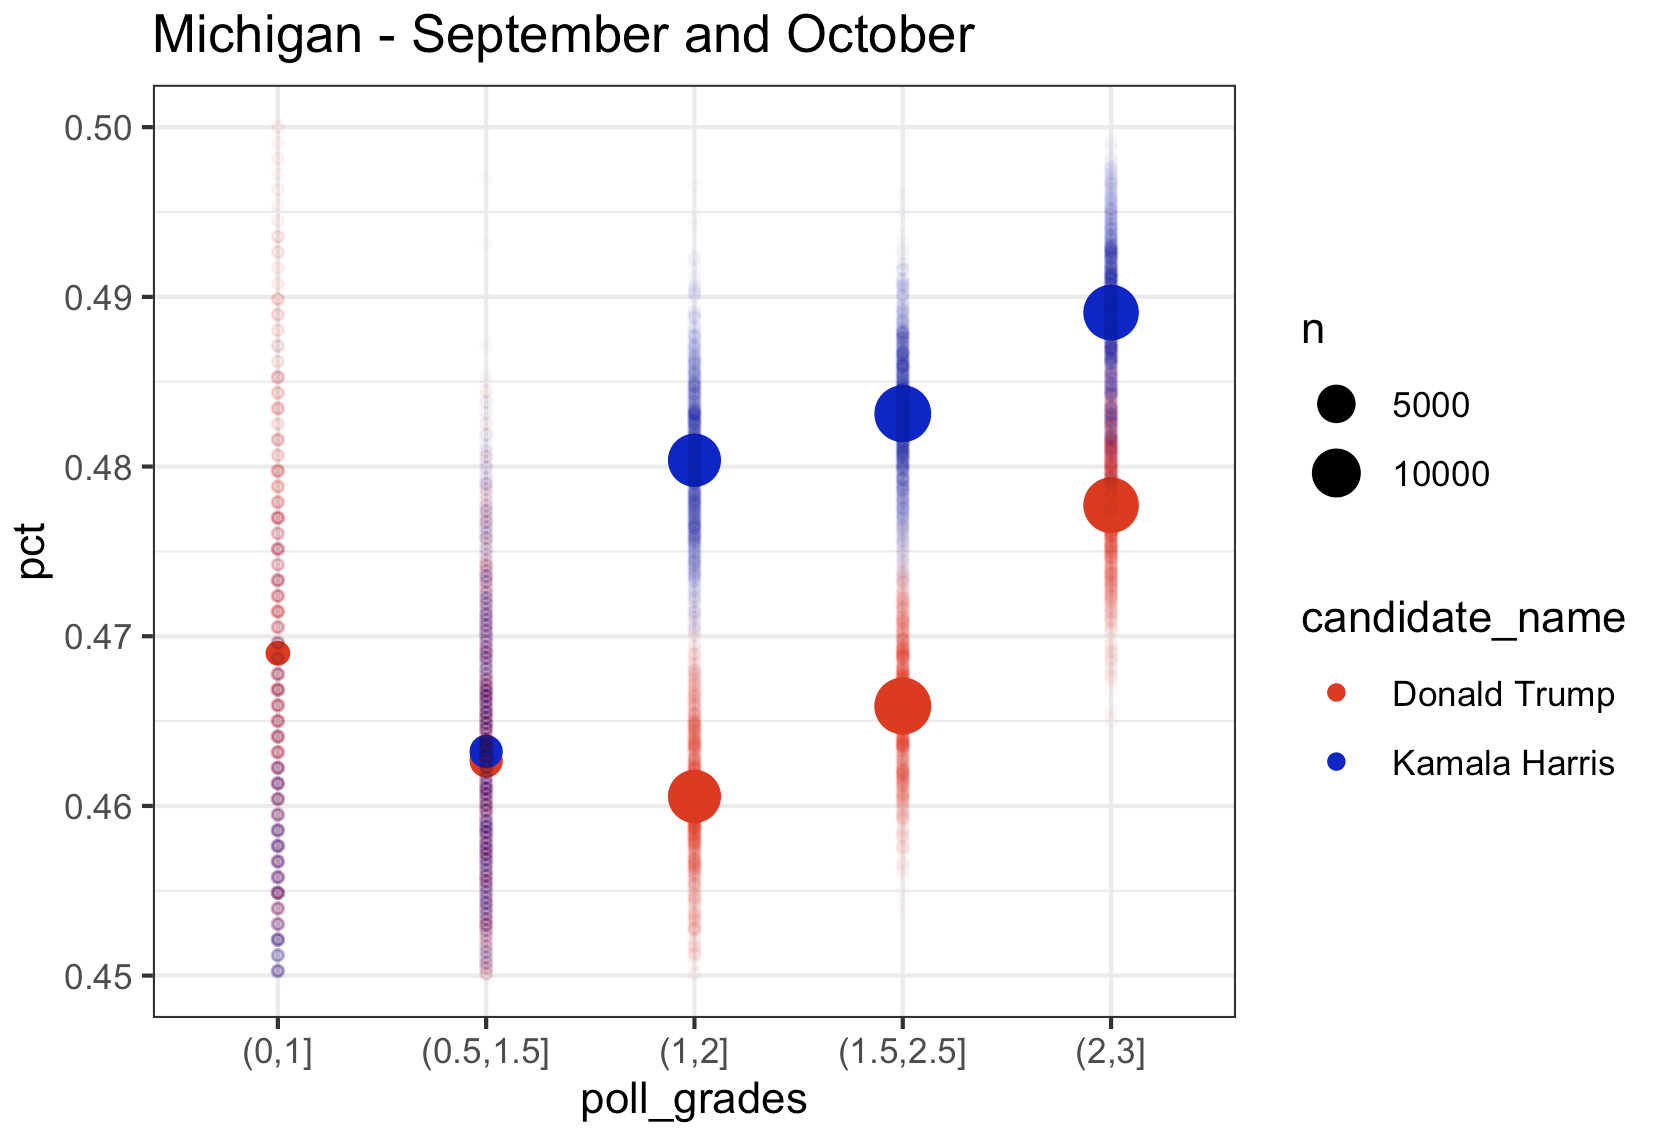
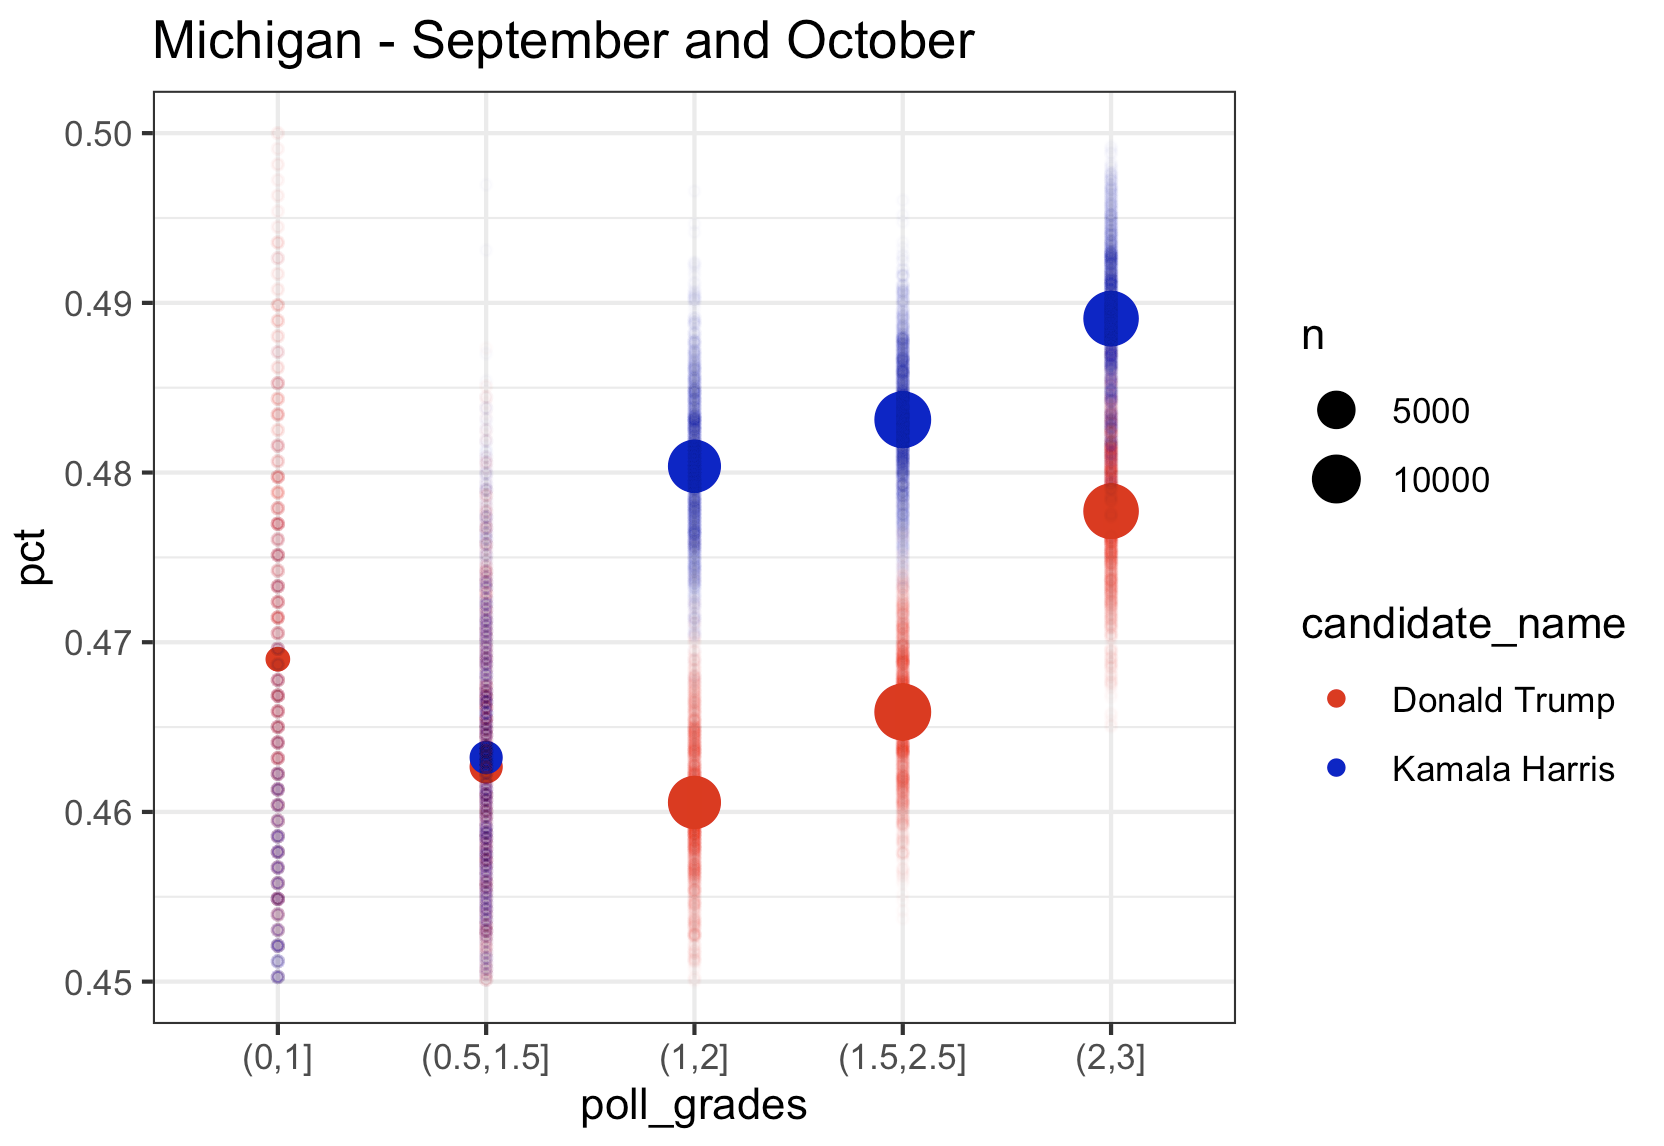
So what I want to look at is how the polls of different quality score the race right now. So here is what I did (with Pennsylvania as an example): I took all the polling data and and removed “duplicate” polls (I don’t quite understand why 538 seems to have these duplicates in their file, but there are records in the data that look exactly the same to me except for the percentage. So, I included only one of these records when there were multiple. If anyone can explain the difference in these records to me, I’m all ears). I then only kept polls consisting of “likely voters”. I then took all those polls over a certain period of time and combined all the polls over these period of time to come up with one single estimate for each candidate (basically mini meta-analysis). I then computed these estimates by filtering on a range of polling grades (i.e. 0.5-1.5, 1-2, 1.5-2.5, 2-3) and I plotted these estimates (with fun little error tails), on a plot. Here is Pennsylvania for August, September, and October, and then September and October pooled together at the end:
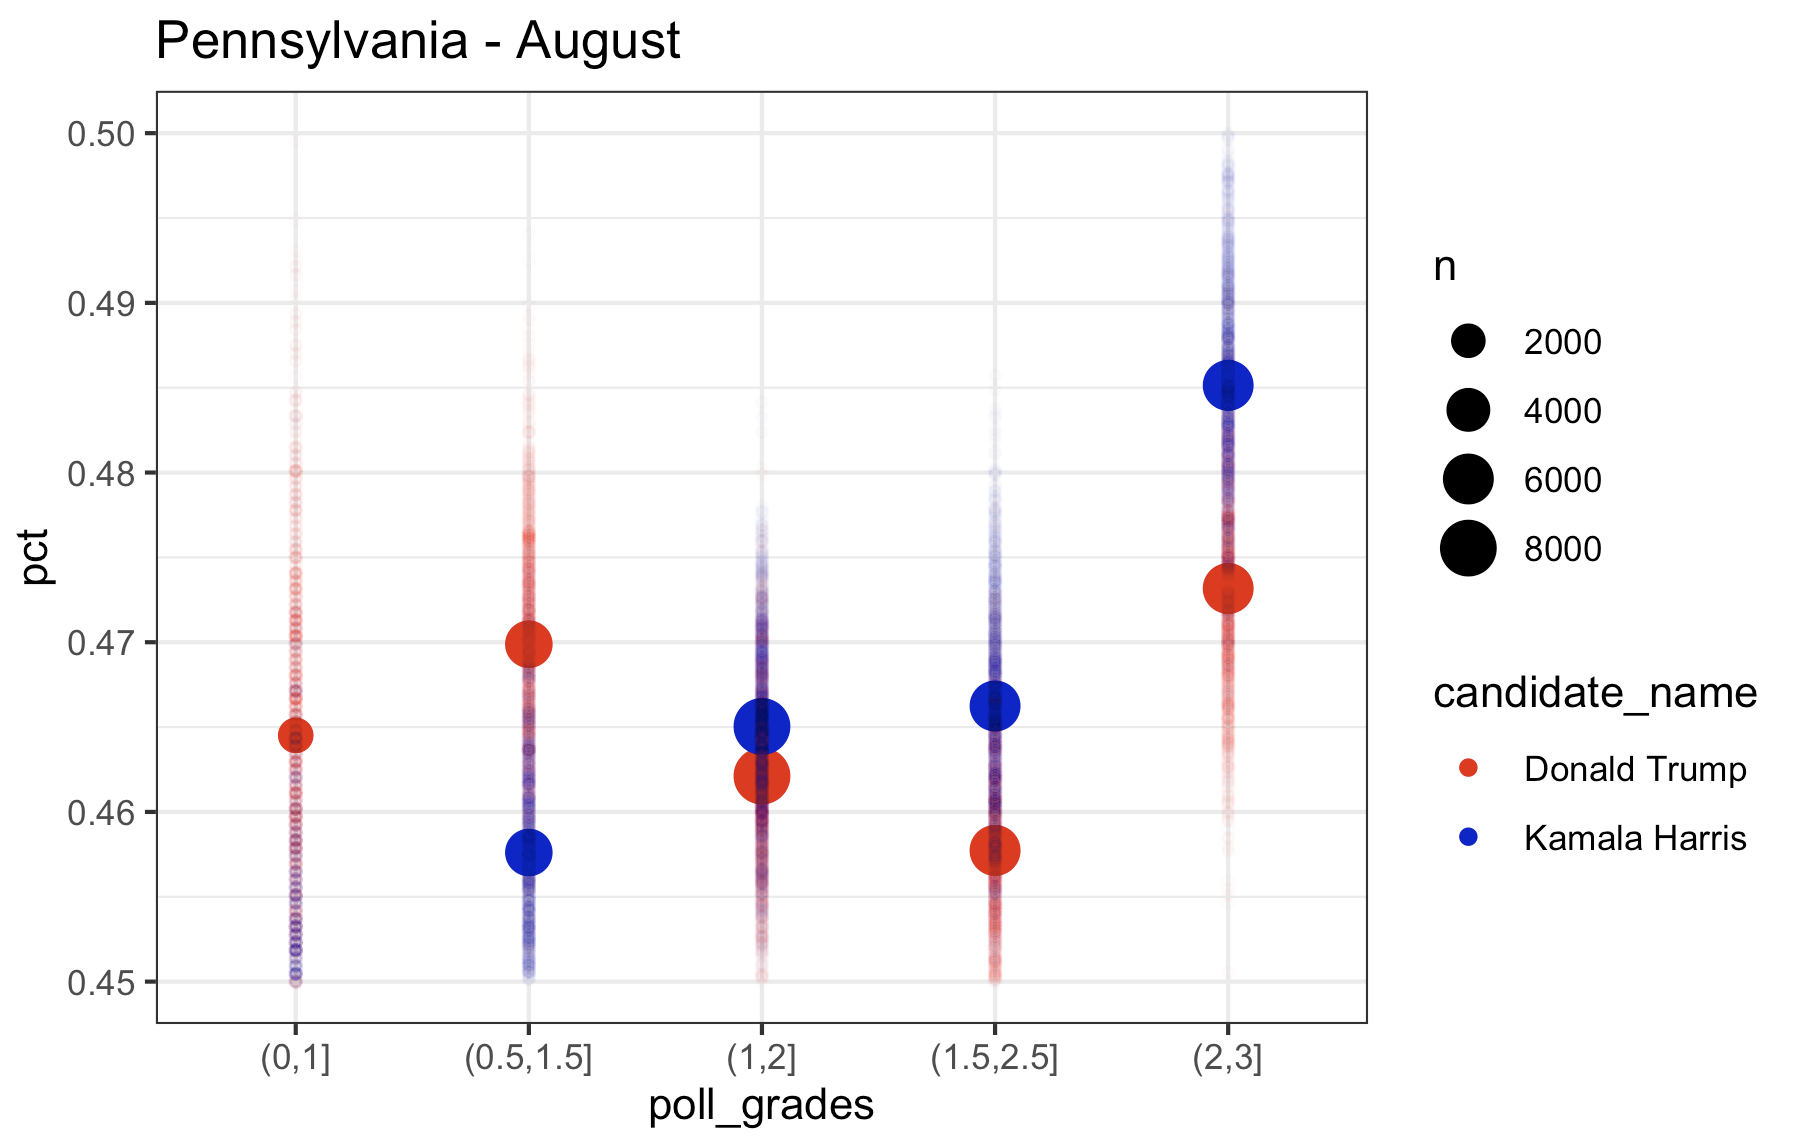
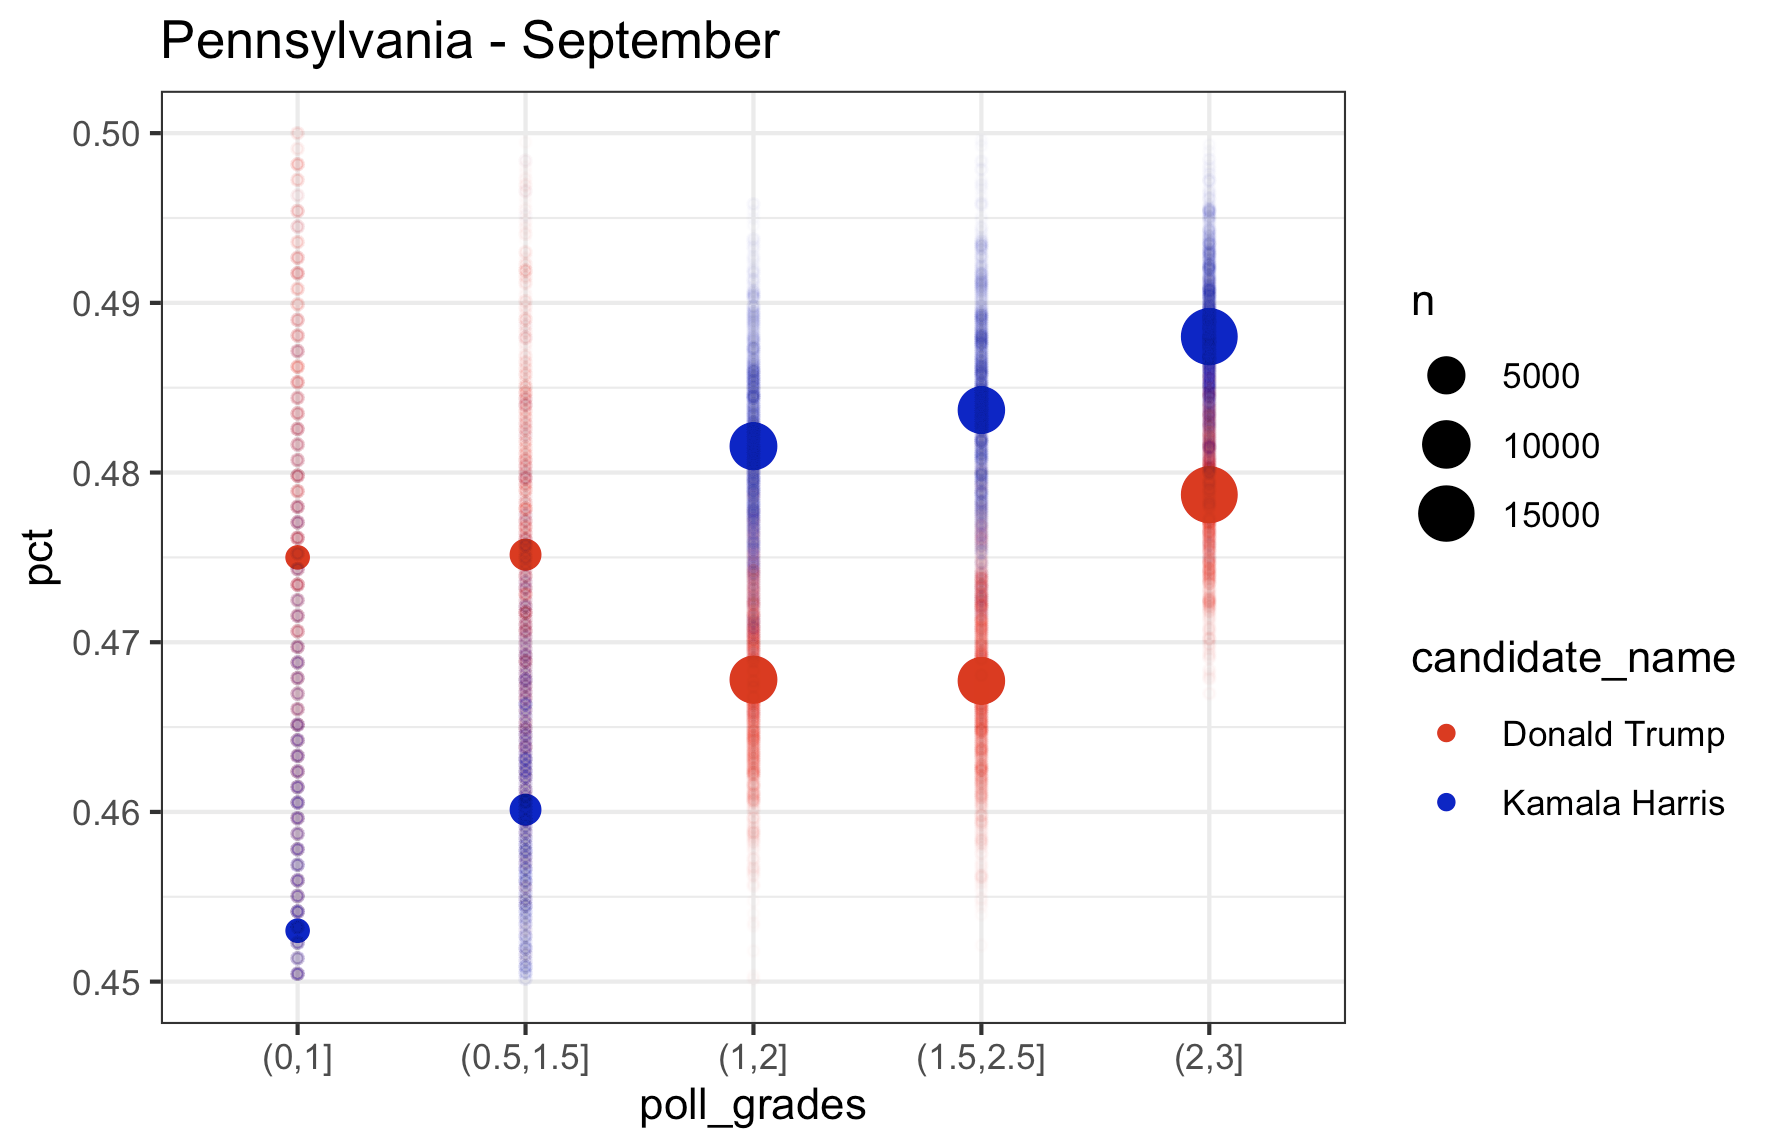
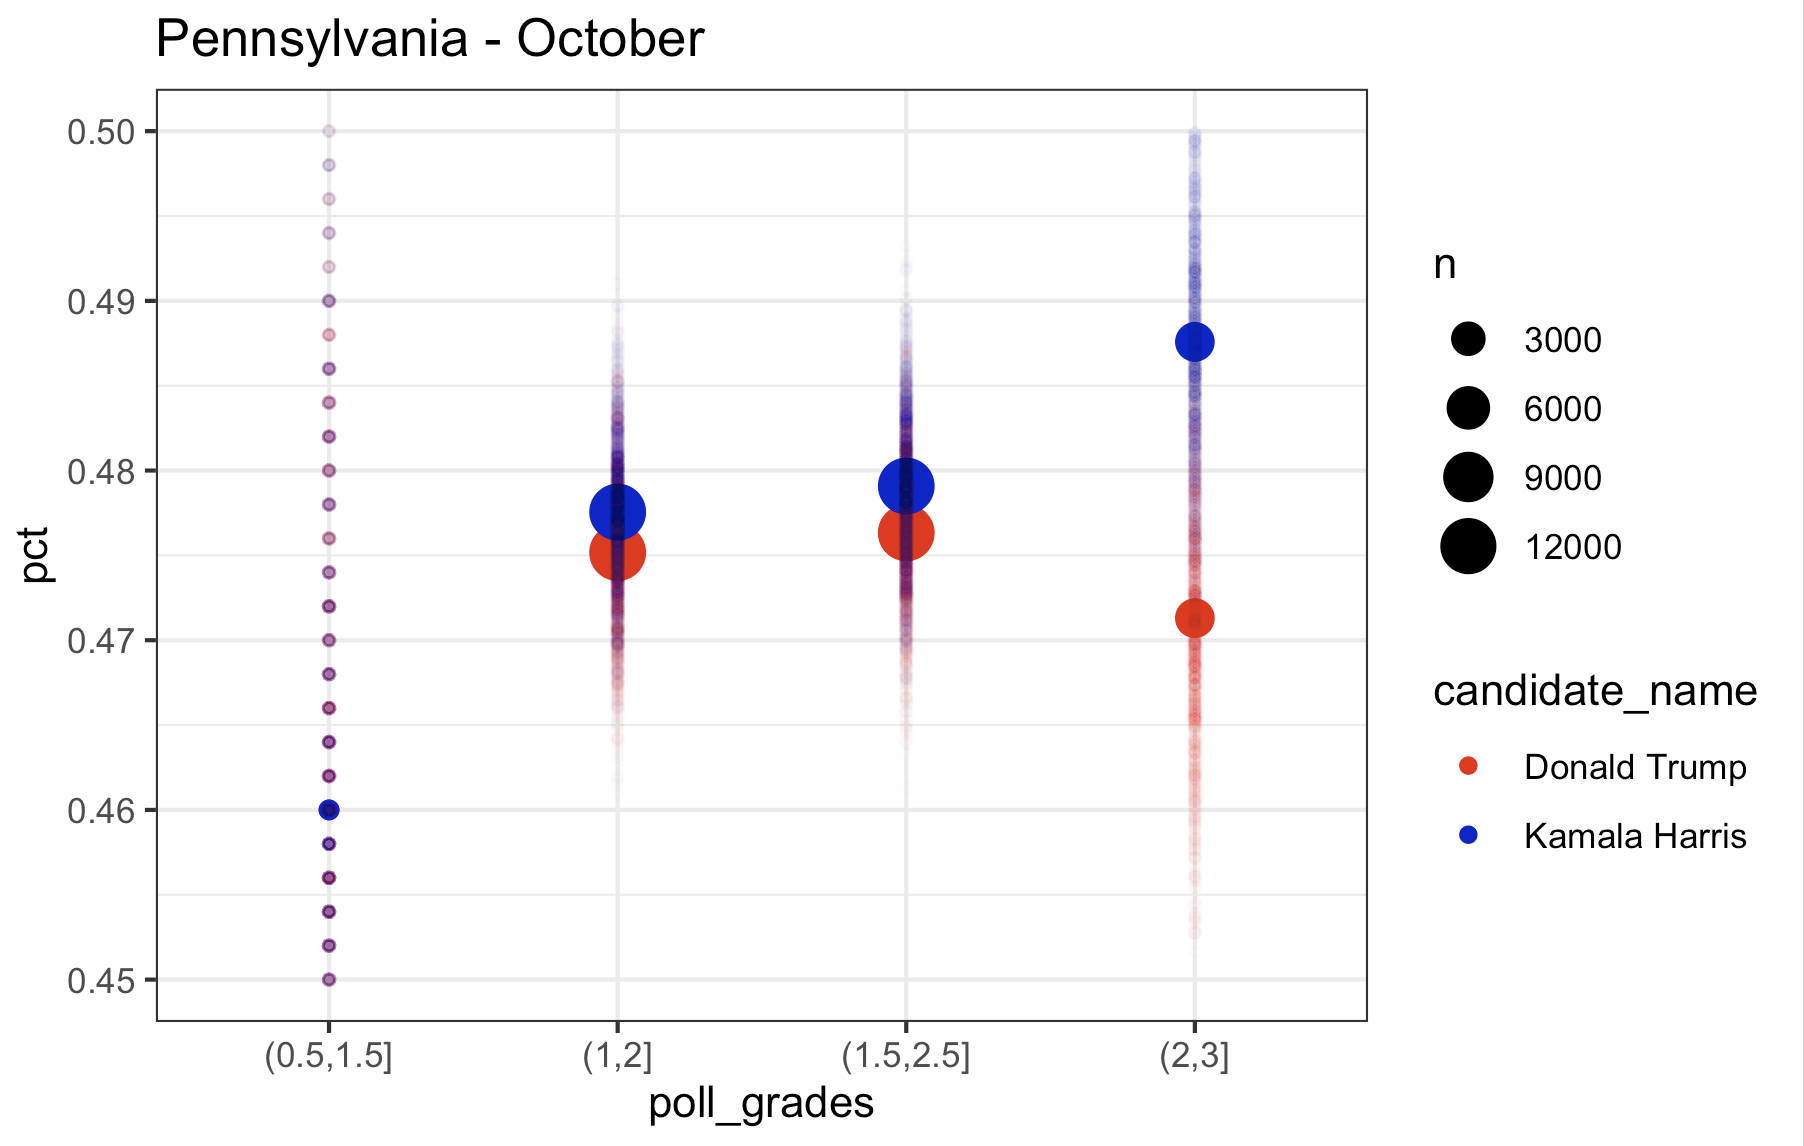
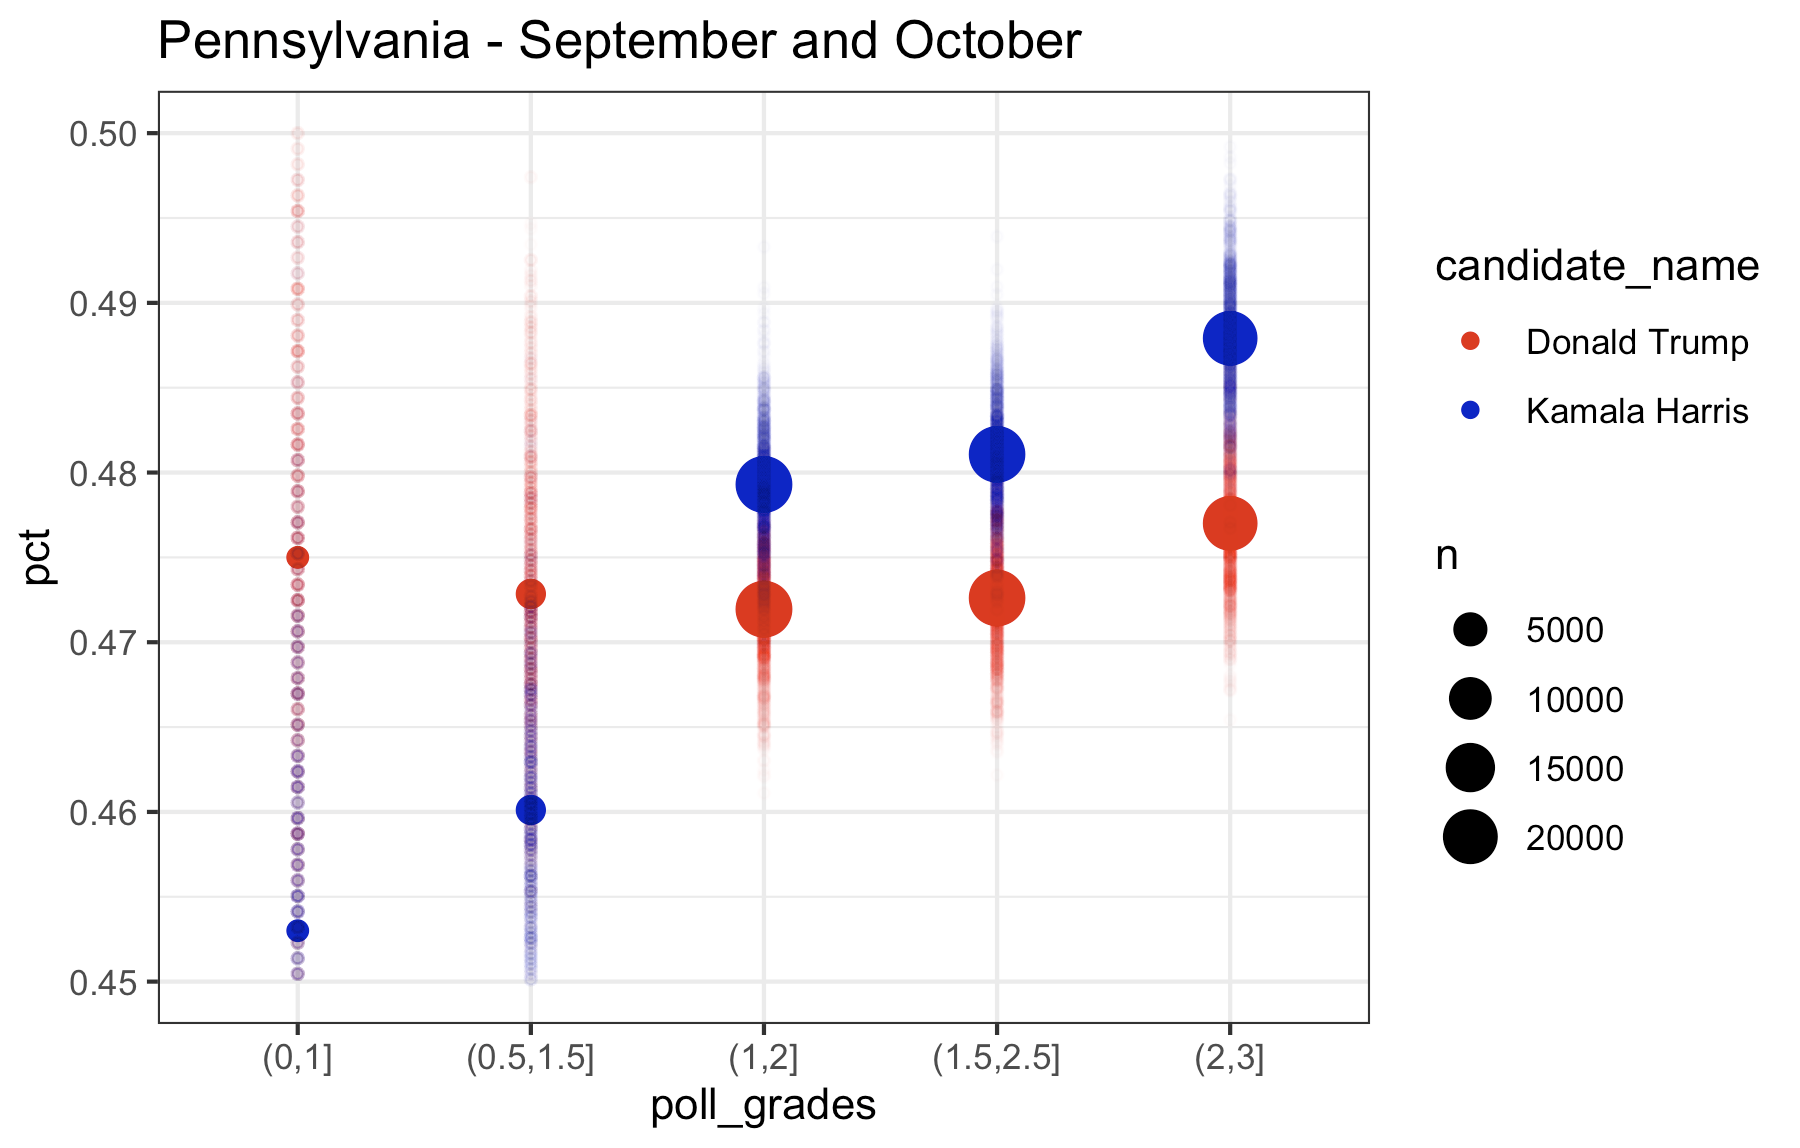
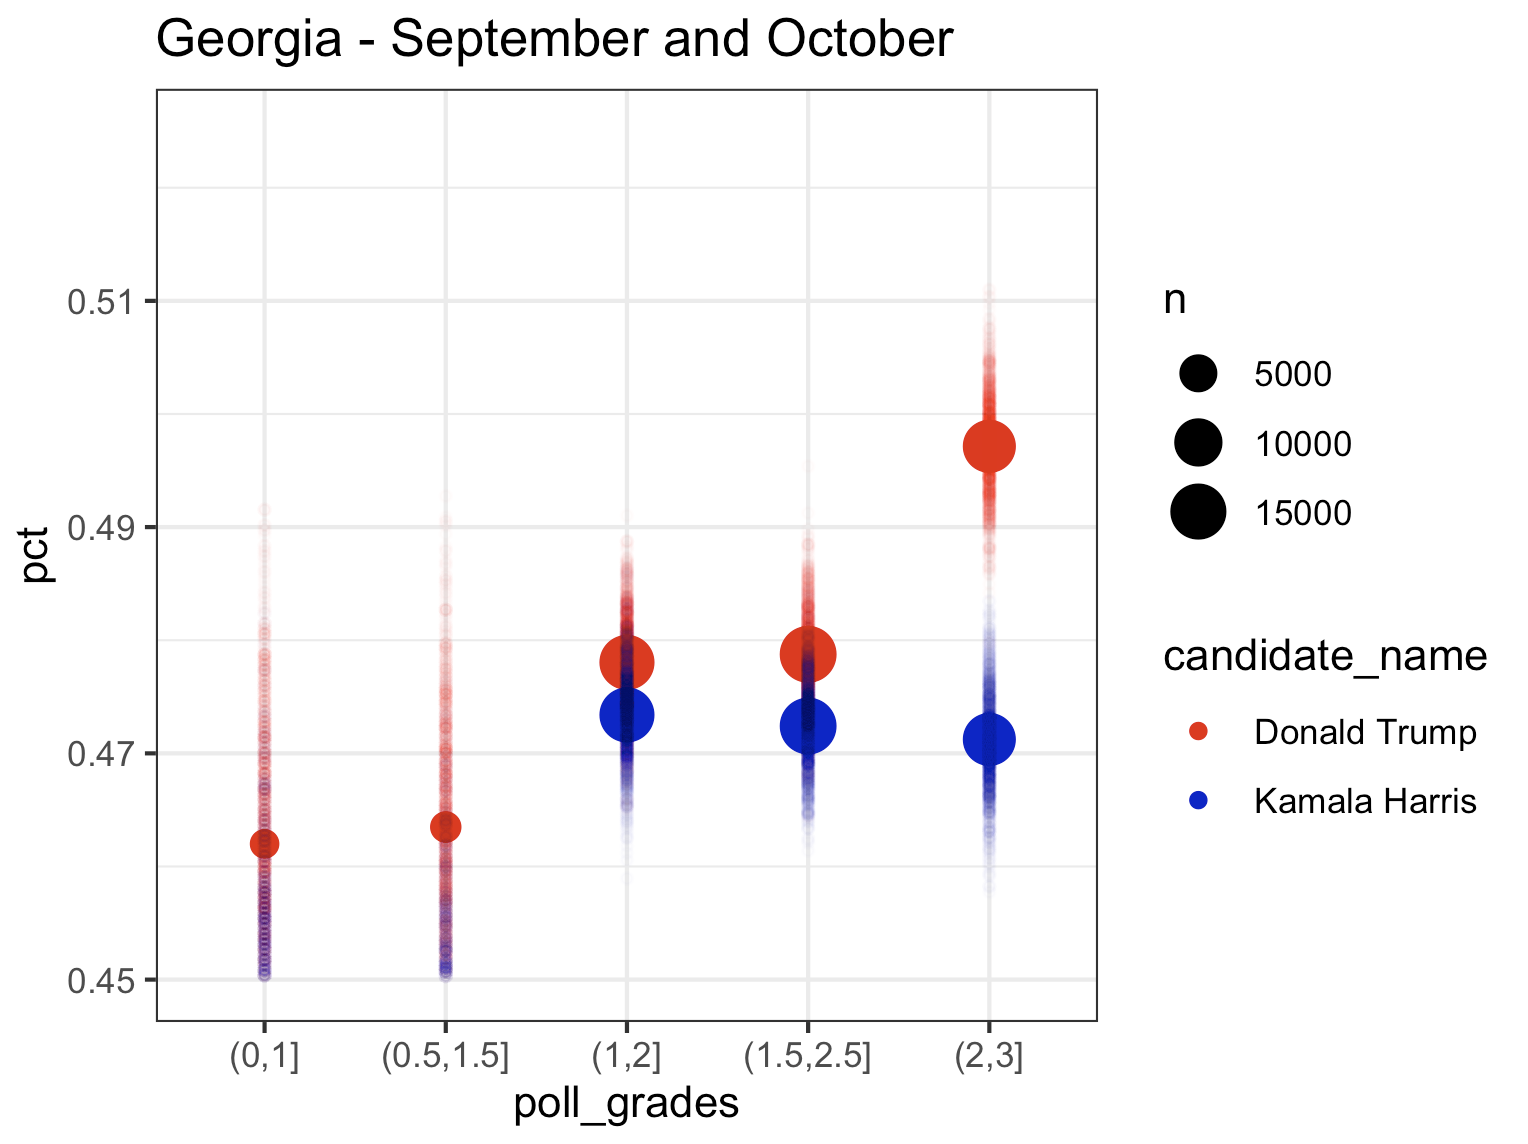
What you’ll notice is that the higher the rating on the filter of which polls to include, the higher the estimate is for Kamala, while Trump remains relatively consistent across polls. If you look at the last plot (September and October pooled together), the lowest rated polls have Kamala trailing in Pennsylvania by almost 2 points. The top rated polls have Kamala leading by a point. So, based on this it looks to me like…..Pennsylvania isn’t actually that close. Kamala is consistently leading in the top rated polls and and the polls in 2022 were, according to 538, “historically accurate“. So this is good news for Kamala. But there also appears to be some not so great news for Kamala, too. Let’s look at the other swing states, which I consider to be Michigan, Wisconsin, Georgia, Arizona, Nevada, and North Carolina (North Carolina is a swing state. Fight me.) Let’s start with the rest of the Midwest (Pennsylvania is Midwest. Fight me.)
Wisconsin
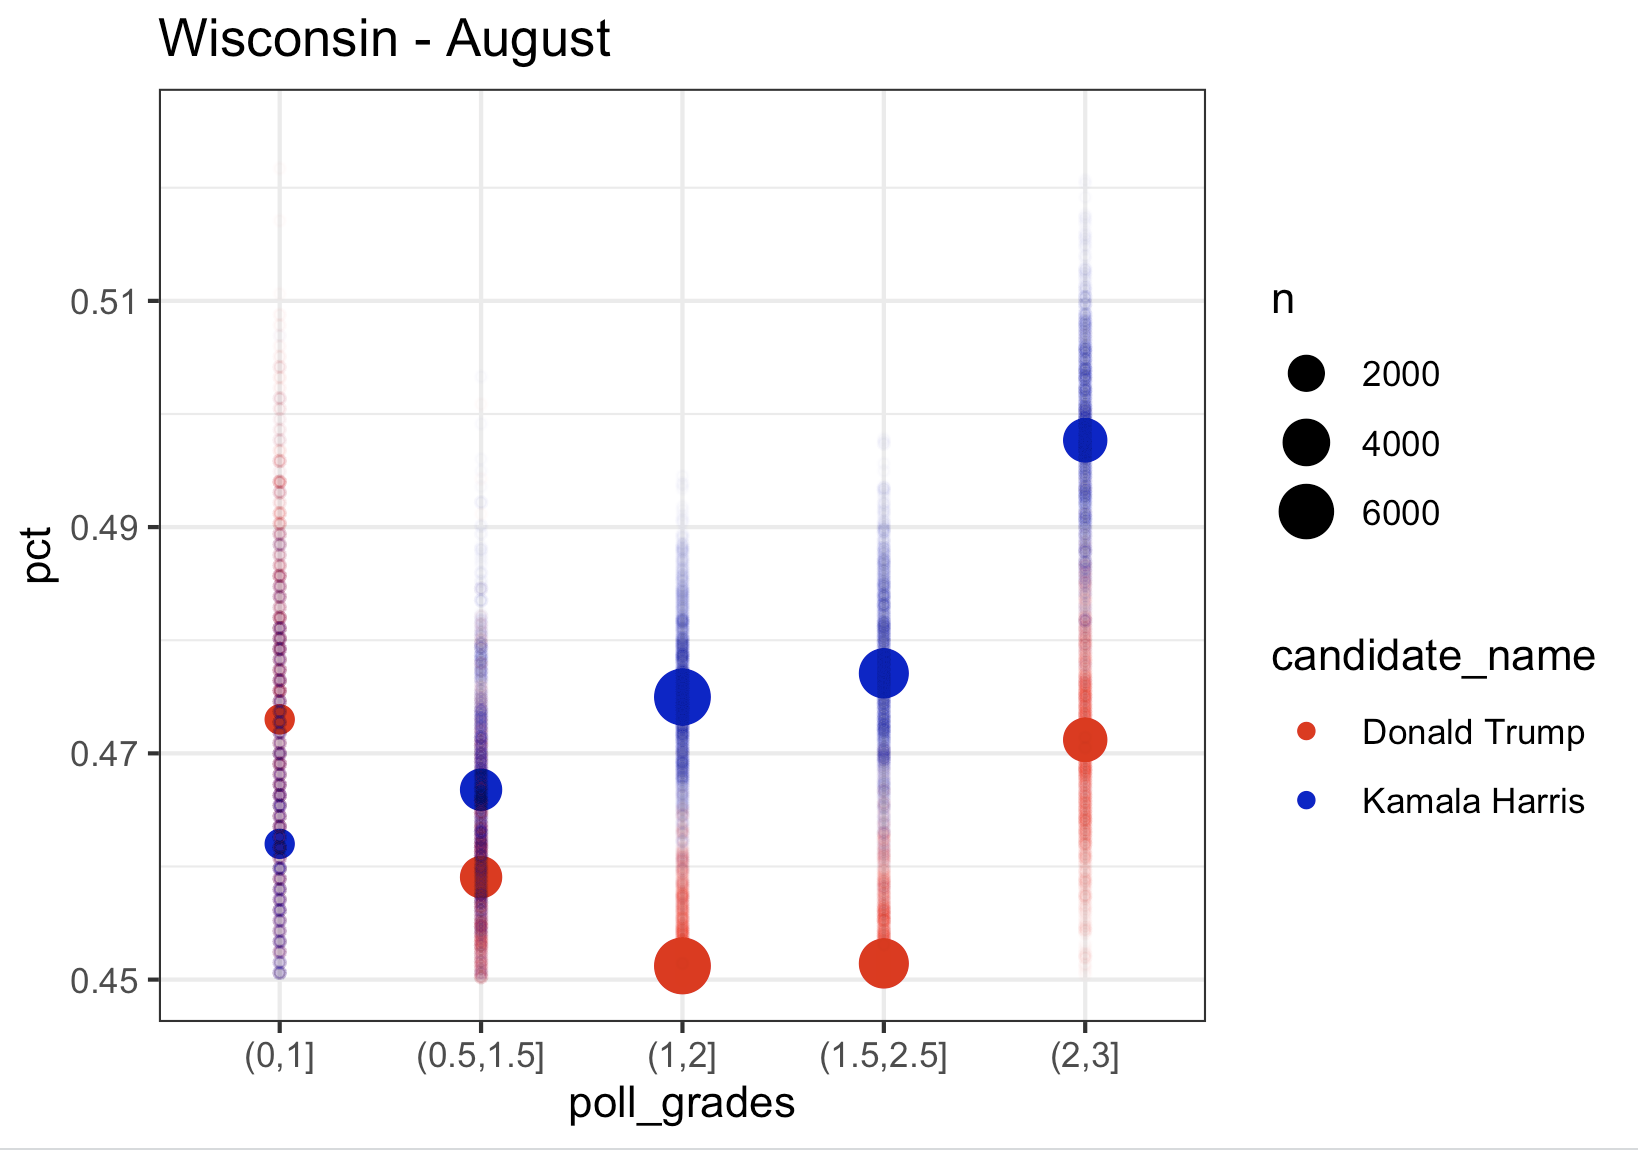
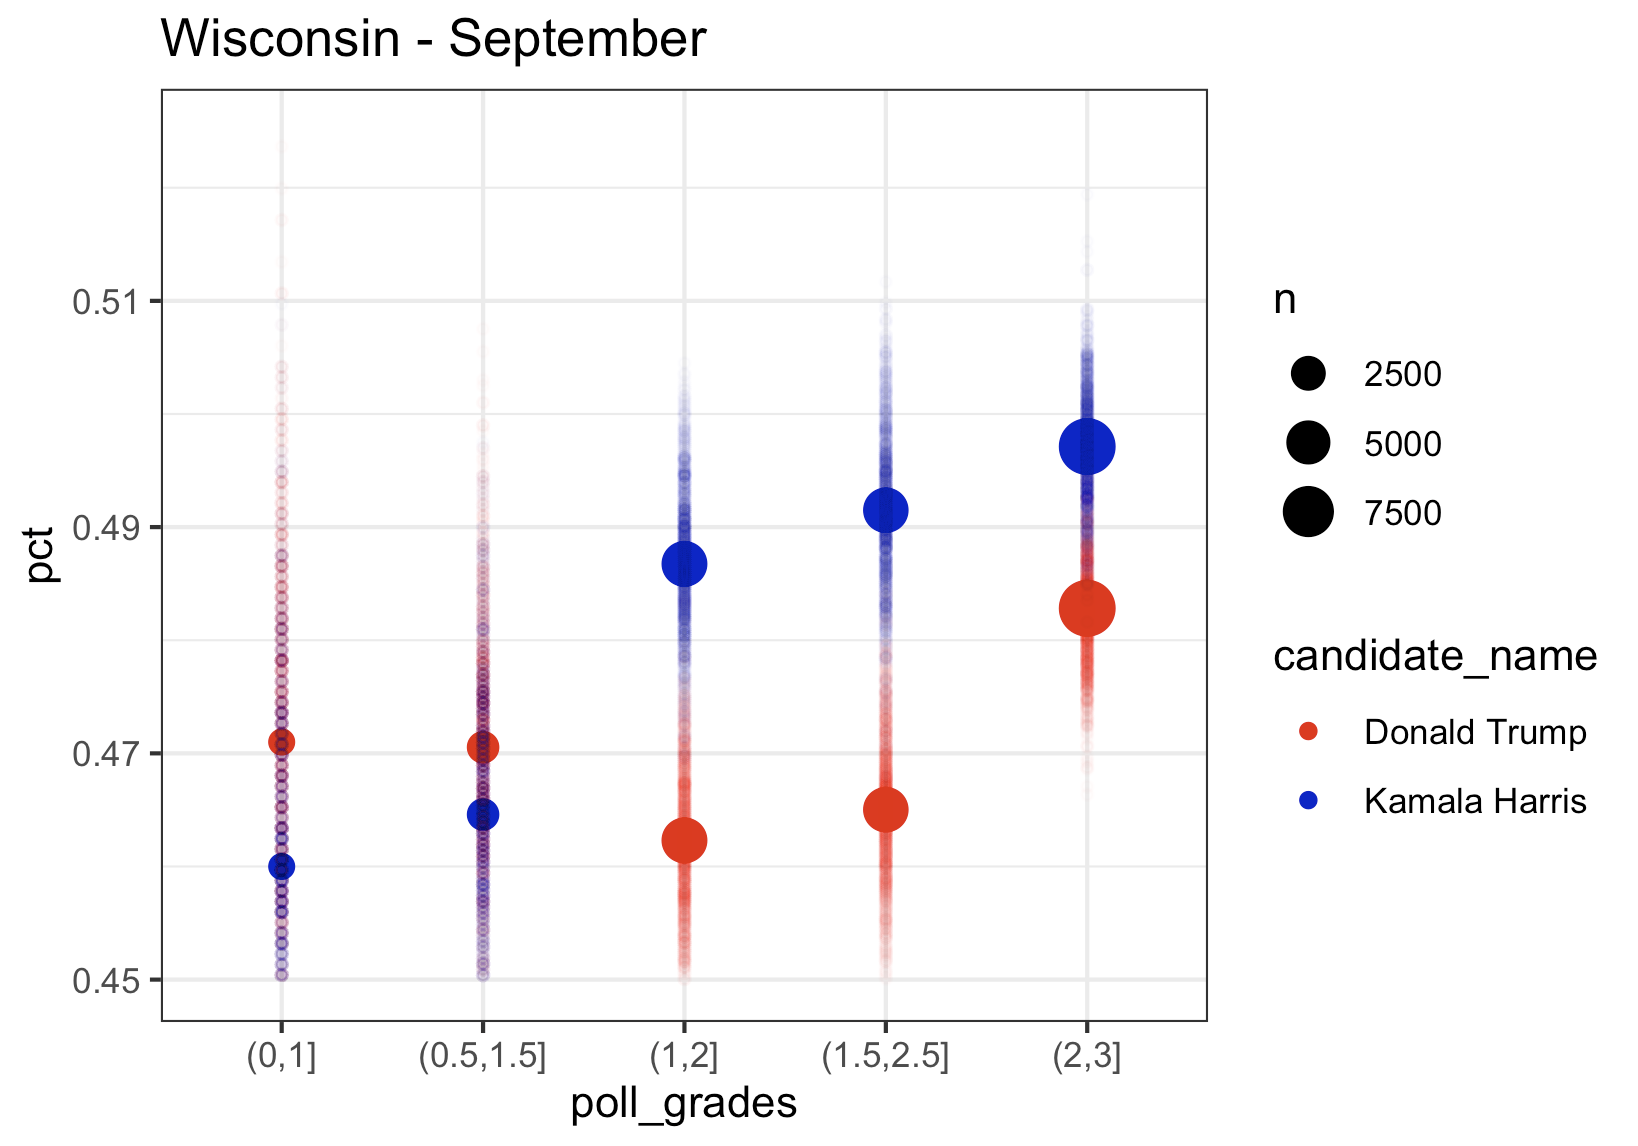
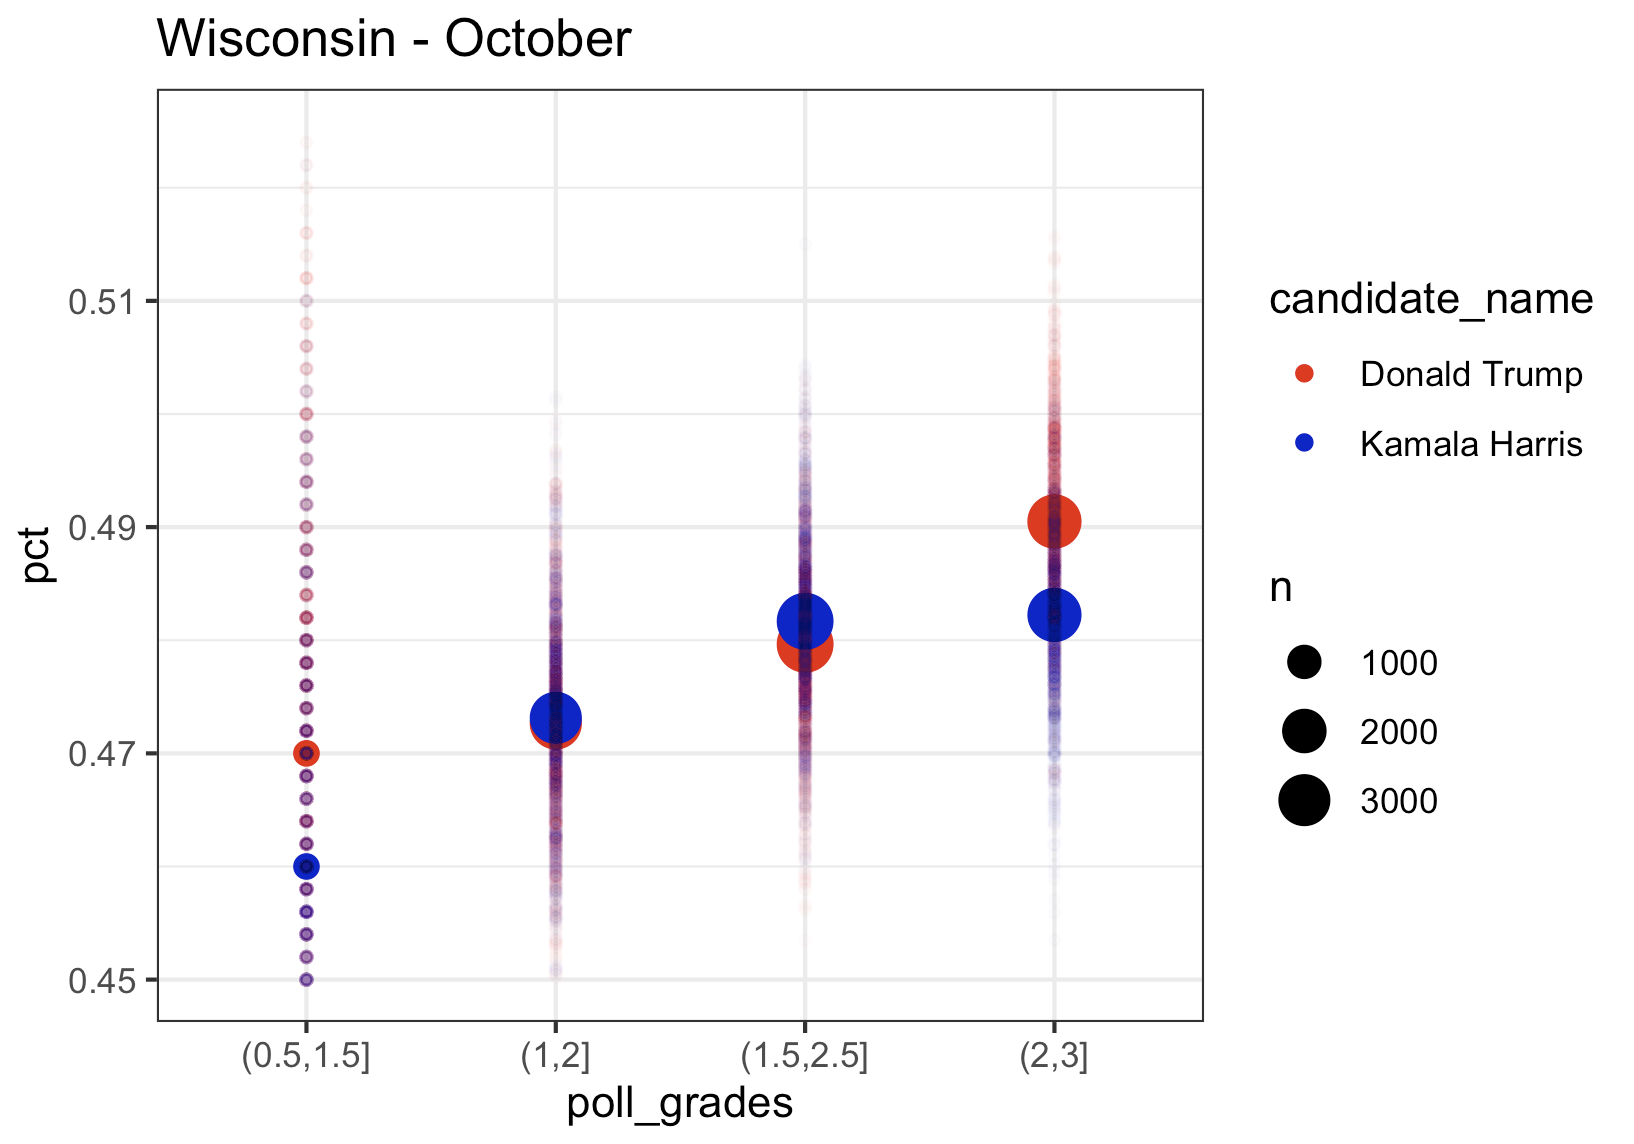
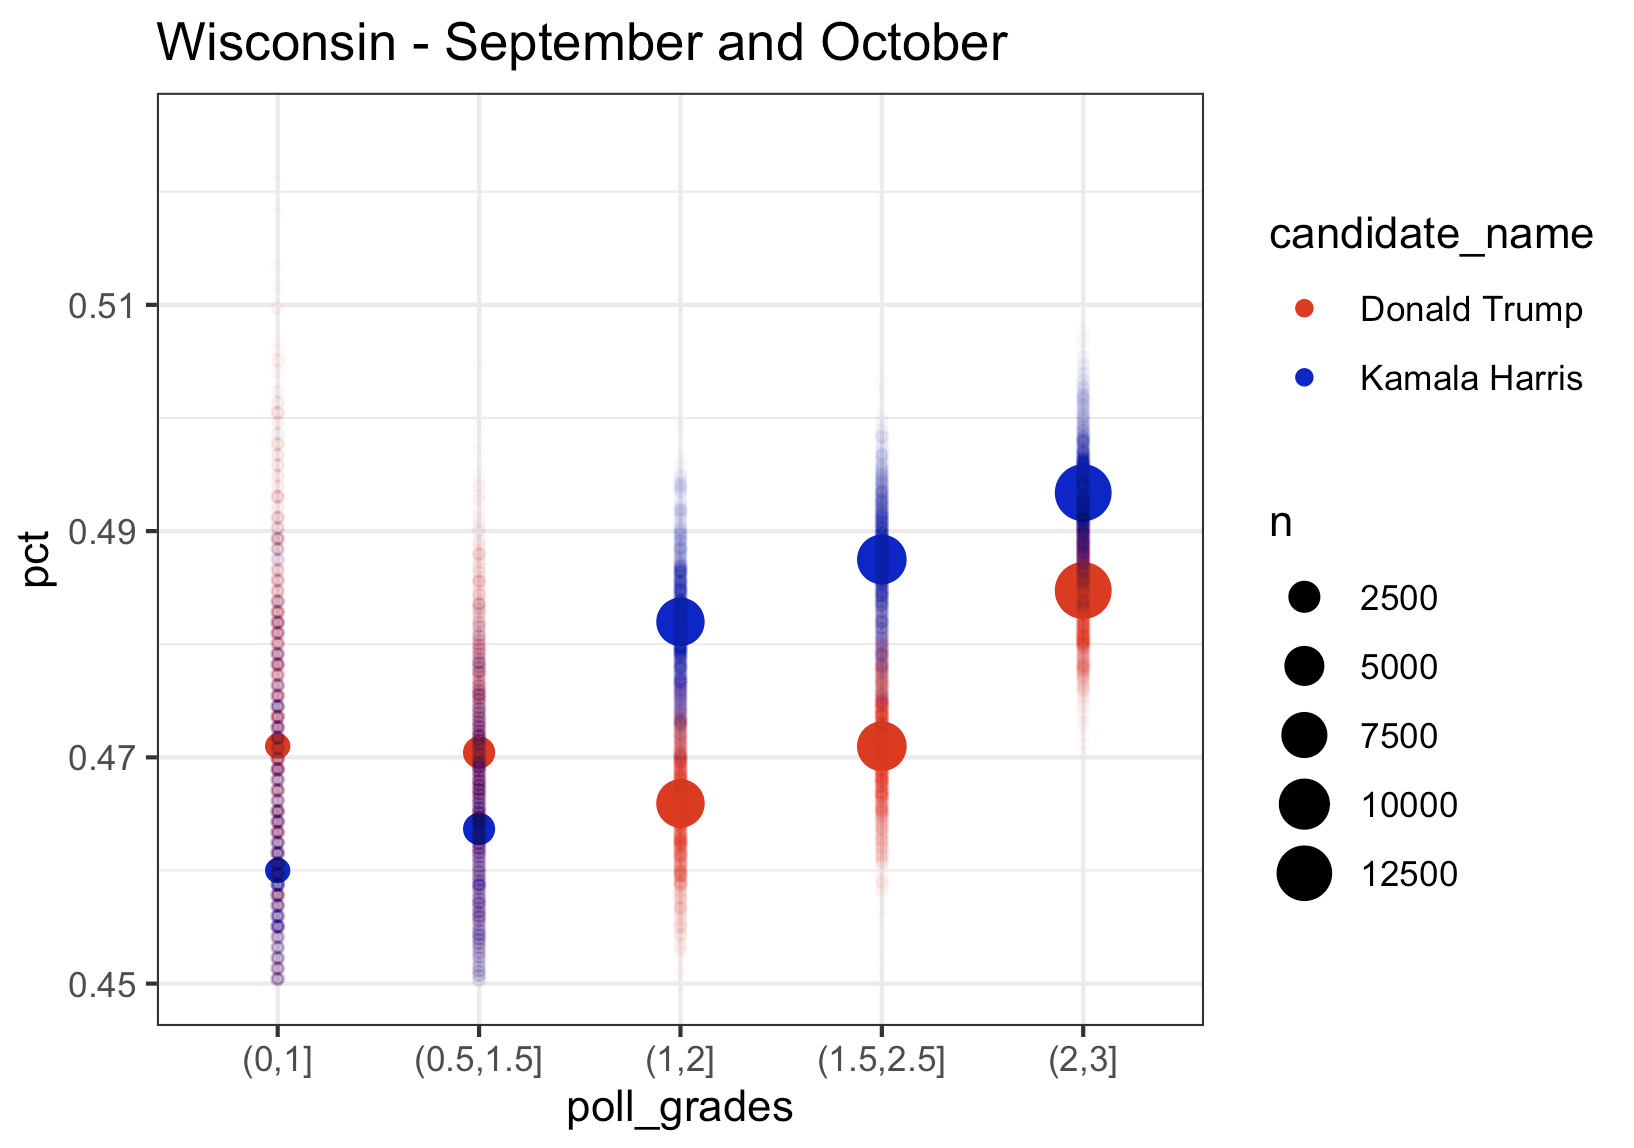
We again see the same pattern where higher rated pollsters have Kamala at a higher percentage, exactly like we saw in Pennsylvania. The bad news for Kamala in Michigan is that her lead using only August data was about 1.5, in September it was down to 1, and with the limited data in October, she is trailing in Wisconsin by about 0.5. And we see the same thing in Michigan.
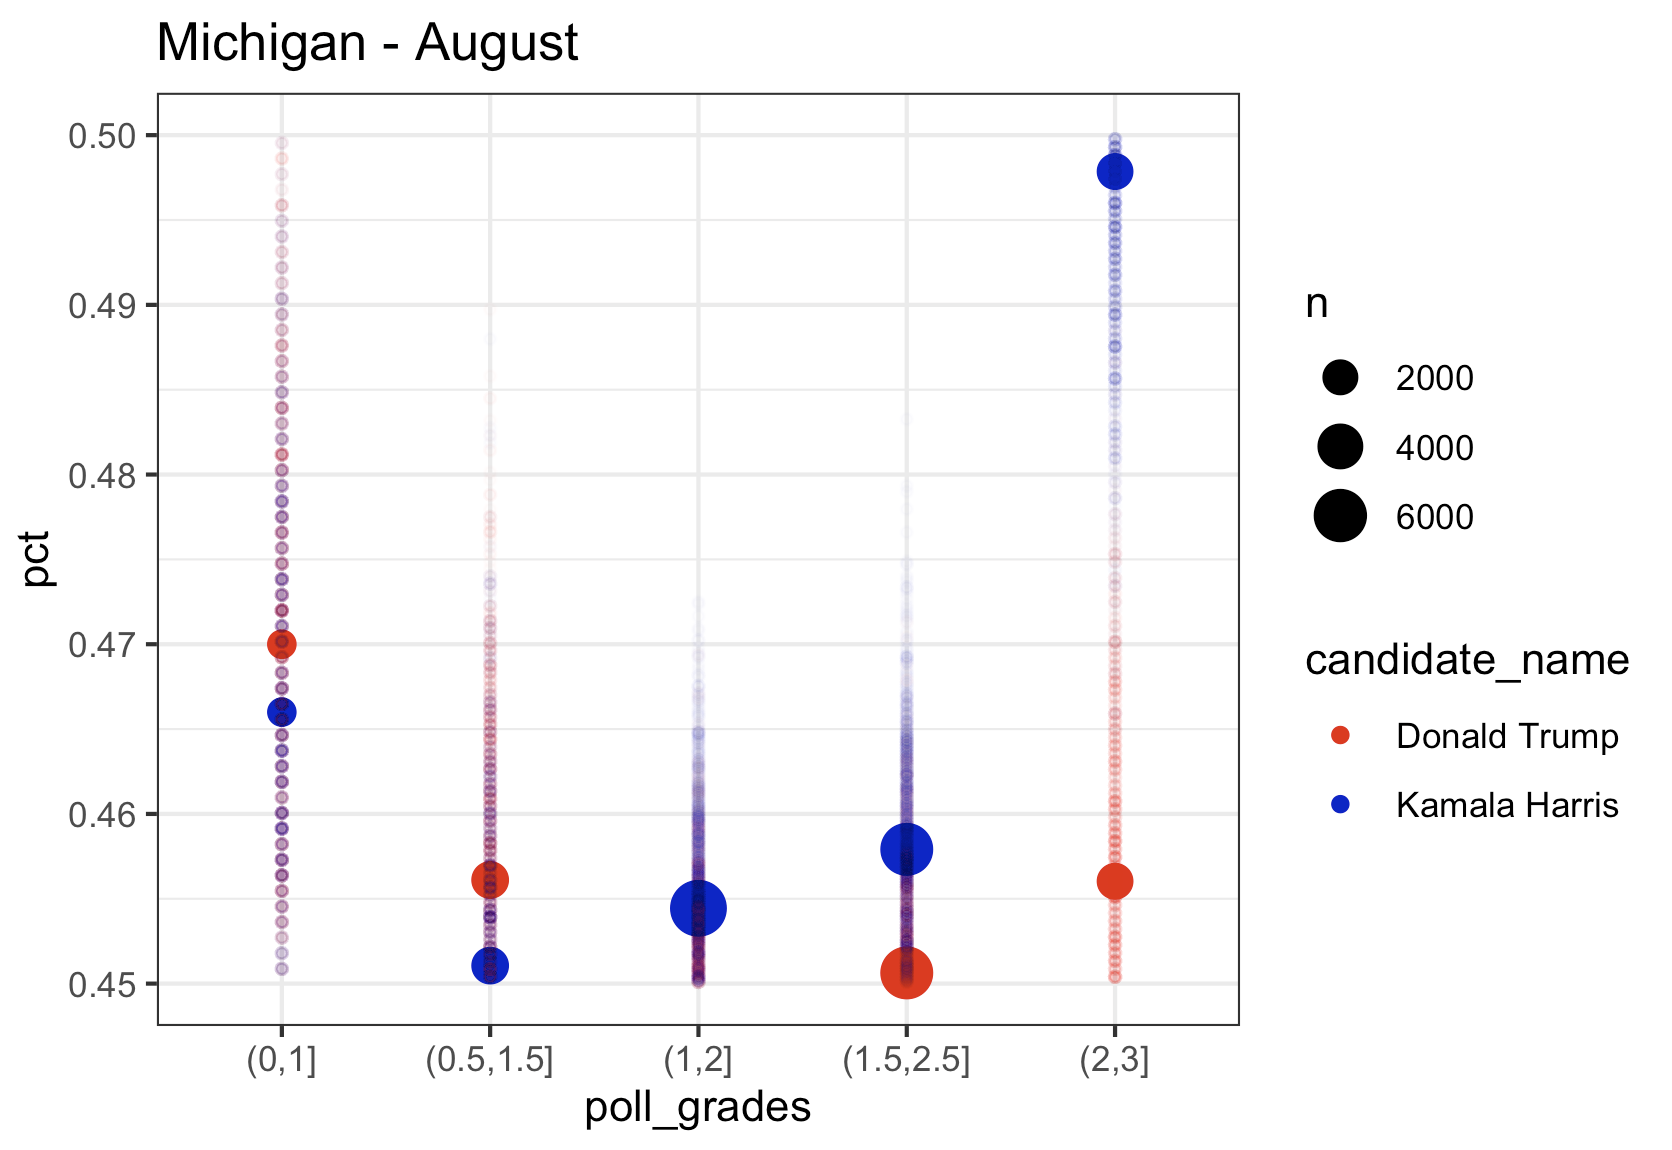
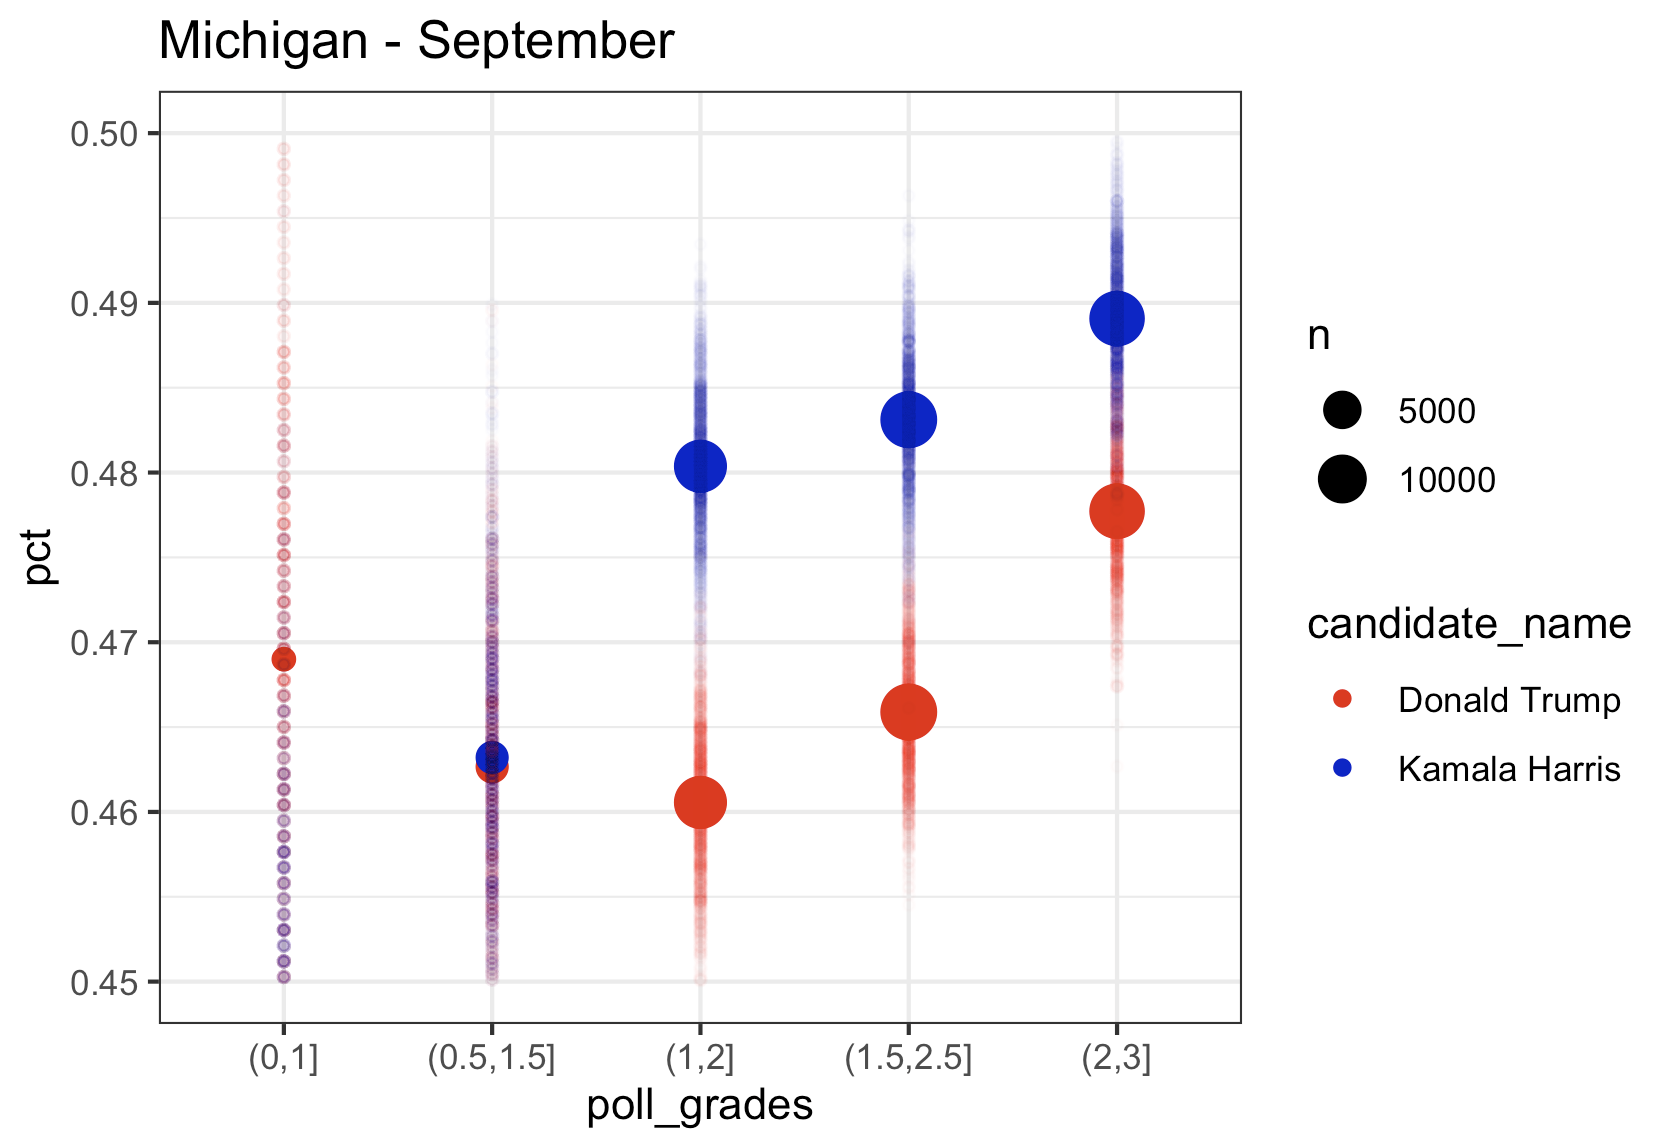
Michigan
Kamala’s lead in Michigan in the top rated polls in August was over 4 points, in September it was down to 1 point, and using only October data from the top pollsters, just like in Wisconsin, she is trailing by 0.5 points. The aggregate of September and October, still has her in the lead, but the trend has to be scary to the Harris campaign. Note that once again we see the lower rated pollsters with Kamala much lower than the highest rated pollsters.
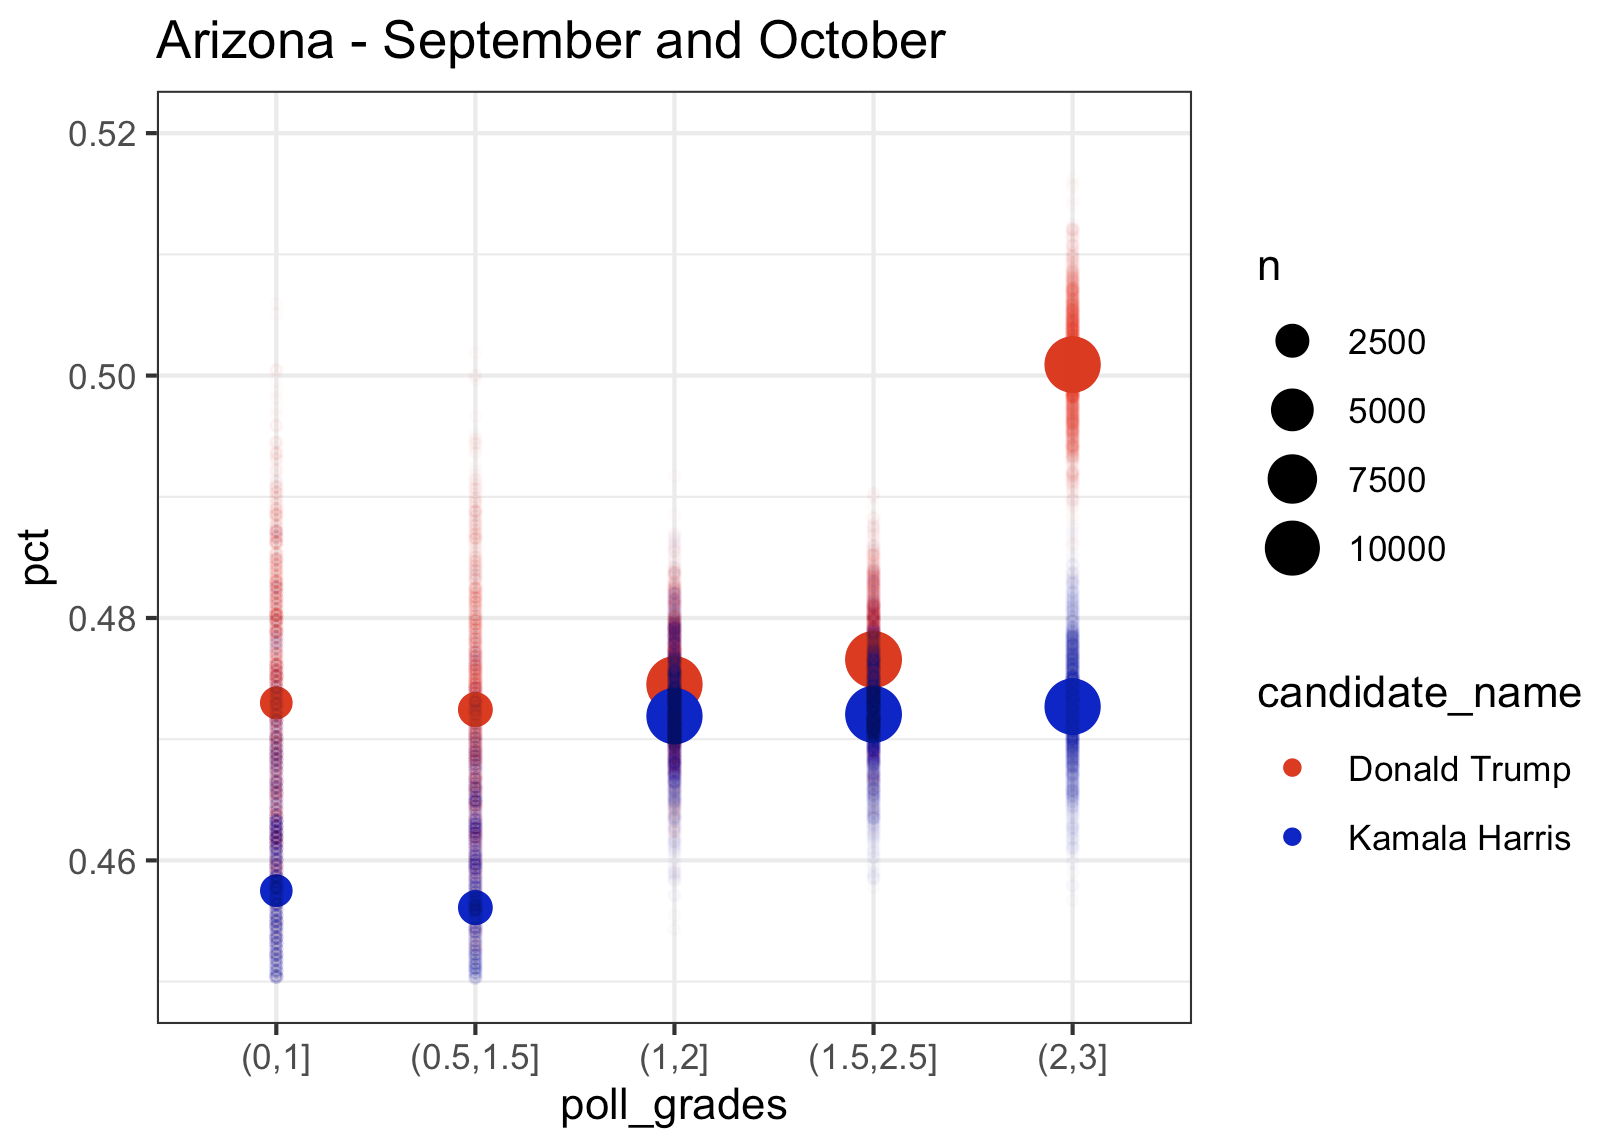
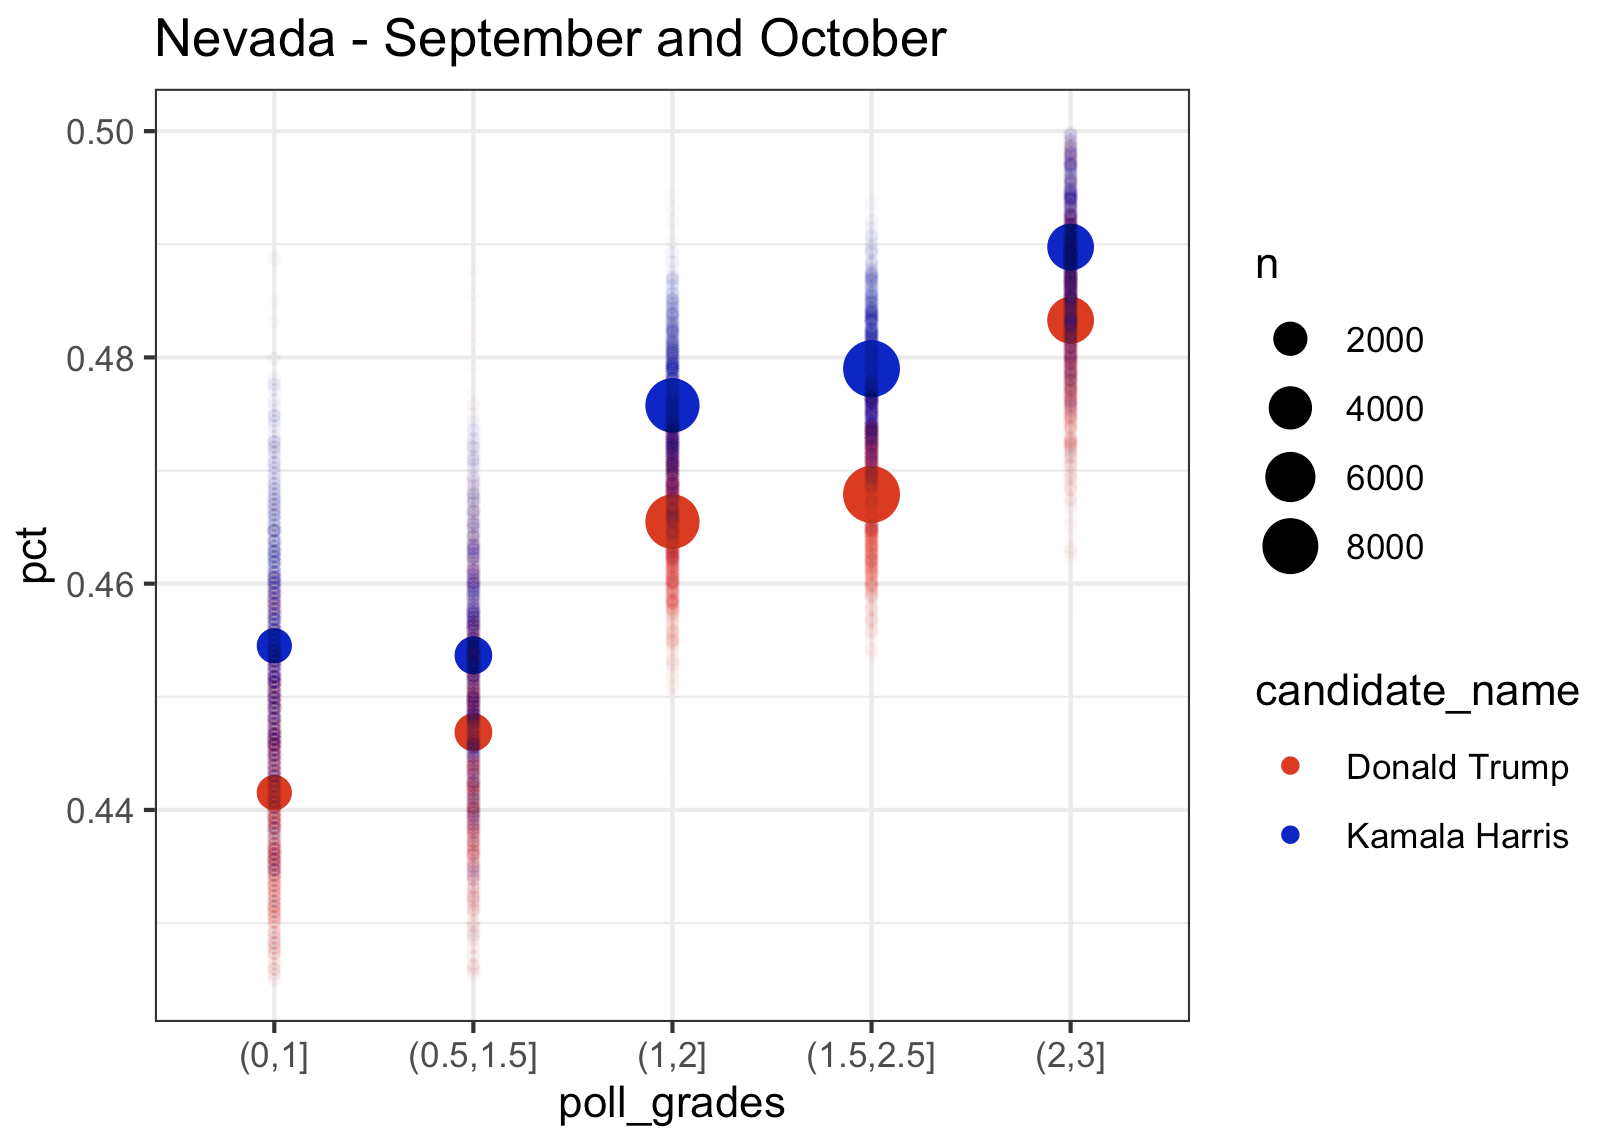
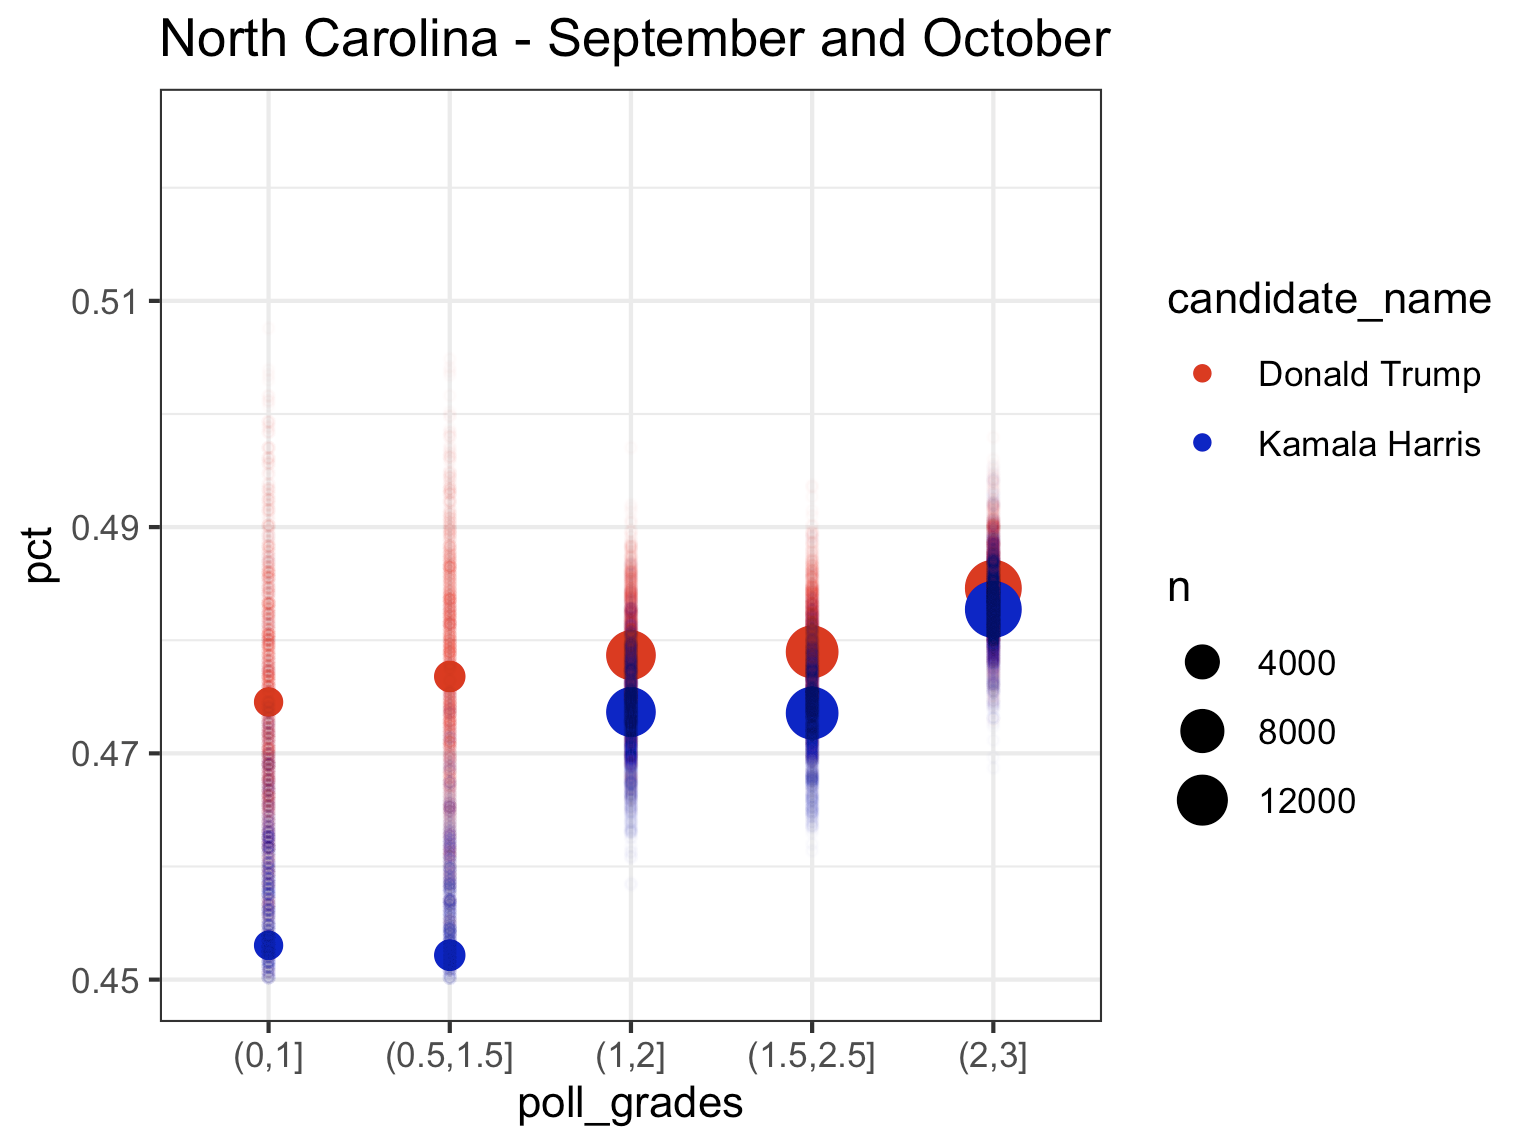
Finally, let’s look at the last 4 swing states. What’s interesting in Georgia is that the top rated polls give Trump more of a lead than the lower rated polls, while Kamala’s percentage remains largely the same across pollster rating groups. Nevada and North Carolina follow the pattern that we saw in the Midwest with higher rated polls giving Kamala a higher percentage. Based on the top rated pollsters, Kamala is slightly leading in Nevada and just barely trailing in North Carolina (which I think Dems can win given the absolute lunatic running for governor).
Georgia
Arizona
Nevada
North Carolina
All this said, I give you an electoral map that I think is totally plausible based on this polling data that I guarantee you will not see anywhere else. Behold:
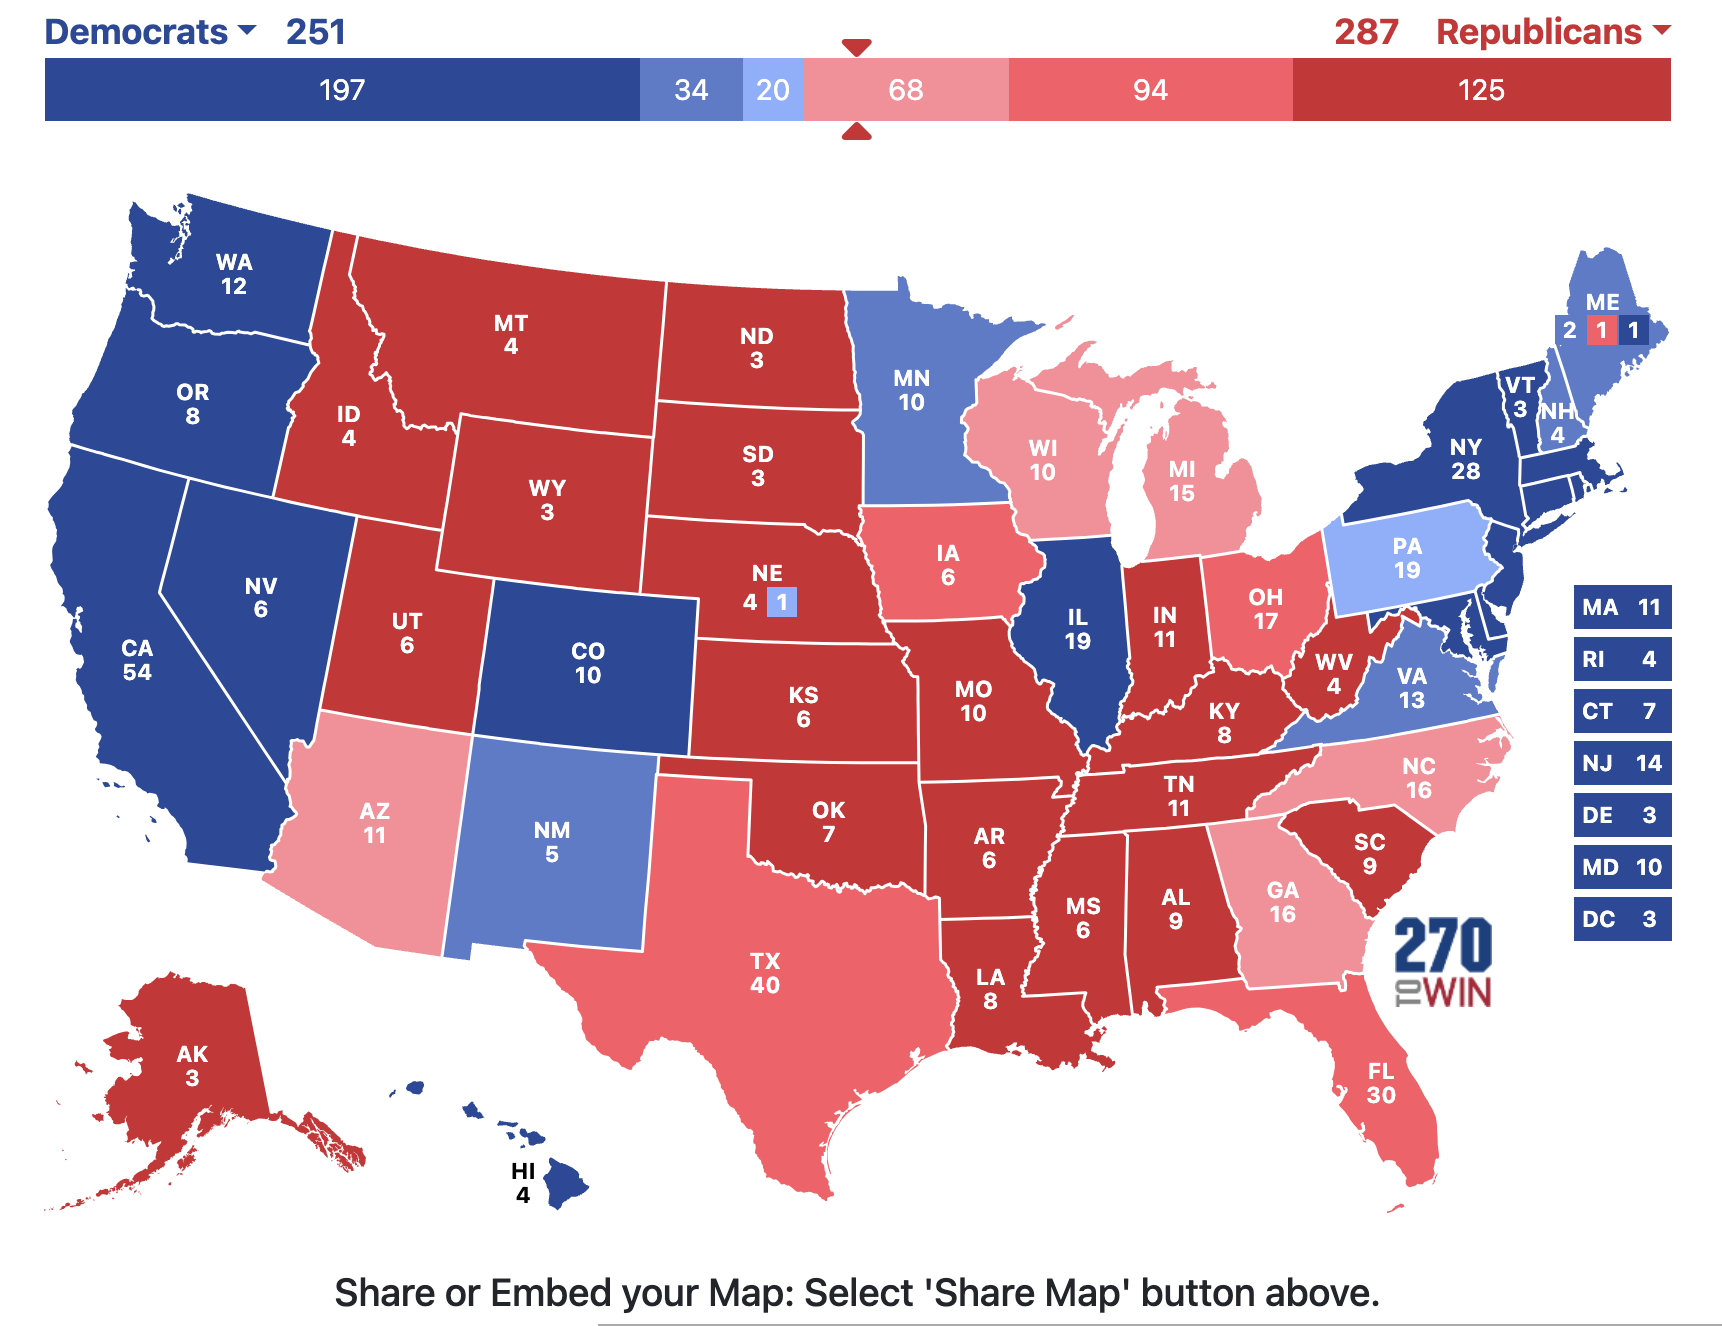
Kamala wins Pennsylvania. Wins the popular vote by 3 points. And loses the election.
What. A. Nightmare.
Cheers.
A US drought is over
American Frances Tiafoe defeated Dimitrov in the US Open quarterfinals last evening. Earlier yesterday another American, Taylor Fritz, beat Zverev to also advance to the semifinals. They will face each other on Friday guaranteeing an American will make the finals for the first time since 2006 when Andy Roddick made it to the finals and lost to some guy name Roger Federer. In honor of this feat, I wasted all morning making the graphic below. I’ve posted my bat shit crazy code at the bottom. Suggestions on how to do this better are welcome.
Cheers.
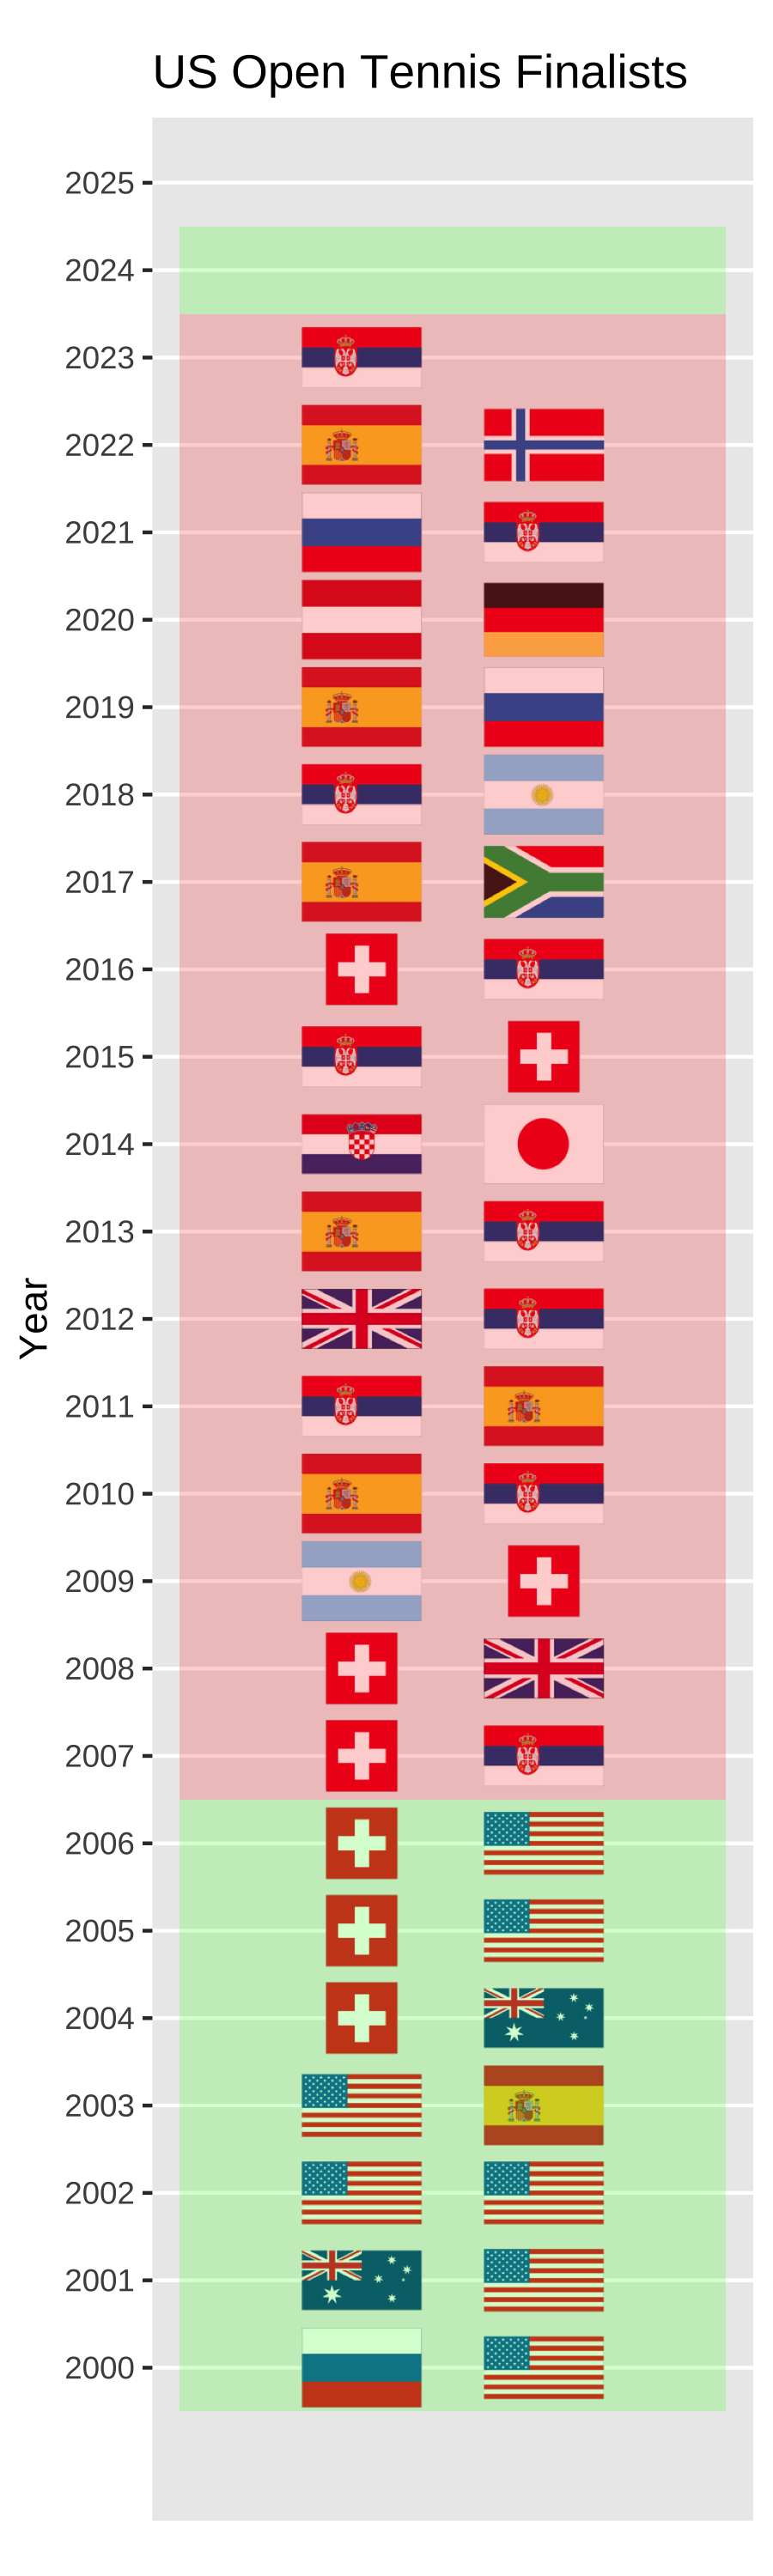
#How do I do this better?
#https://www.kaggle.com/datasets/zhongtr0n/country-flag-urls

library(ggplot2)
library(ggimage)
library(tidyverse)

# d <- data.frame(x = rnorm(10),
#                 y = rnorm(10),
#                 image = sample(c("https://www.r-project.org/logo/Rlogo.png",
#                                  "https://www.worldometers.info//img/flags/small/tn_af-flag.gif"),
#                                size=10, replace = TRUE)
#)
# # plot2
# ggplot(d, aes(x, y)) + geom_image(aes(image=image), size=.05)

finals <- read.csv("/Users/gregorymatthews/usopenfinals.csv")
flags <- read.csv("/Users/gregorymatthews/Downloads/flags_iso.csv")

finals <- finals %>% mutate(Country = ifelse(Country == "CRO","HRV",Country))
finals <- finals %>% mutate(Country = ifelse(Country == "SUI","CHE",Country))
finals <- finals %>% mutate(Country = ifelse(Country == "TCH","CZE",Country))
finals <- finals %>% mutate(Country = ifelse(Country == "FRG","DEU",Country))

finals <- finals %>% mutate(Country.1 = ifelse(Country.1 == "GER","DEU",Country.1))
finals <- finals %>% mutate(Country.1 = ifelse(Country.1 == "RSA","ZAF",Country.1))
finals <- finals %>% mutate(Country.1 = ifelse(Country.1 == "SUI","CHE",Country.1))

finals <- finals %>% left_join(flags %>% select(Alpha.3.code,URL), by = c("Country" = "Alpha.3.code"))
finals <- finals %>% left_join(flags %>% select(Alpha.3.code,URL), by = c("Country.1" = "Alpha.3.code"))
finals

sub <- finals %>% filter(Year >= 2000)
sub$size1 <- sub$size2 <- 0.05
sub$size1[sub$Country == "CHE"] <- 0.03
sub$size2[sub$Country.1 == "CHE"] <- 0.03

sub <- sub %>% mutate(`US finalist` = ifelse(Year == 2024 | Year <= 2006,"Yes","No"))

png("/Users/gregorymatthews/test.png",res = 300, h = 10, w = 3, units = "in")
ggplot(sub) + geom_image(aes(x = Year, y = 1,image=URL.x), size=sub$size1) +
  geom_image(aes(x = Year, y = 1.1,image=URL.y), size=sub$size2) +
  coord_flip() +
  theme(aspect.ratio=4) +
  expand_limits(y = c(.9,1.2)) +
  theme(axis.title.x=element_blank(),
        axis.text.x=element_blank(),
        axis.ticks.x=element_blank()) + ggtitle("US Open Tennis Finalists") +
  scale_x_continuous(breaks = seq(2000,2025, by = 1),
                     minor_breaks = NULL) +
  scale_y_continuous(breaks = c(-100,100)) +
  annotate("rect", ymin = .9, ymax = 1.2, xmin = 2006.5, xmax = 2023.5, alpha=0.2, fill="red") +
  annotate("rect", ymin = .9, ymax = 1.2, xmin = 1999.5, xmax = 2006.5, alpha=0.2, fill="green") +
  annotate("rect", ymin = .9, ymax = 1.2, xmin = 2023.5, xmax = 2024.5, alpha=0.2, fill="green")

dev.off()
My Kaggle Elite 8 probs for Men and Women
Lost a few spots yesterday. Currently in 75th. I still need UConn and South Carolina to win in all in the Men’s and Women’s tournament, respectively.

Pre tournament probabilities that the remaining men’s teams would reach the Final 4:
UConn: 56.0% (100% in my aggressive Bracket)
Purdue: 51.8%
Tennessee: 18.2%
Alabama: 10.5%
Illinois: 8.11% (0% in aggressive Bracket)
Duke: 6.23%
Clemson: 2.87%
NC State: 0.87%
Pre tournament probabilities that the remaining men’s teams would reach the Final 4:
South Carolina: 82.5%% (100% in my aggressive Bracket)
Oregon St: 8.09% (0% in my aggressive Bracket)
Texas: 28.0%
NC State: 13.8%
LSU: 18.0%
Iowa: 28.4%
UConn: 27.5% / Duke: 1.37%
USC: 33.4% /Baylor: 4.21%
Cheers.
