Category Archives: Uncategorized
Gang Stuff. Stupid Stuff.
From this article:
“What do gangs fight about?” Waco police spokesman Sgt. W. Patrick Swanton told theMorning News. “Gang stuff. Who’s the baddest gang around. Stupid stuff.
“Build Sand Castles from Quantitative Sand”
A quote I liked from this article:
As with election polls and athletes’ stats, quantitative evaluations can attract enthusiasts who lack statistical literacy, who then build castles from quantitative sand.
Cheers.
Penalties and the NHL
Noah and I wrote an article about penalty patterns in the NHL. It’s over on FiveThirtyEight – many thanks to the folks over there for efforts in helping us put it together.
I wanted to share two plots that I thought were interesting, and related to our study.
First, here’s a contrast of penalty violations, comparing the probability of a home team penalty by game type (regular, postseason).
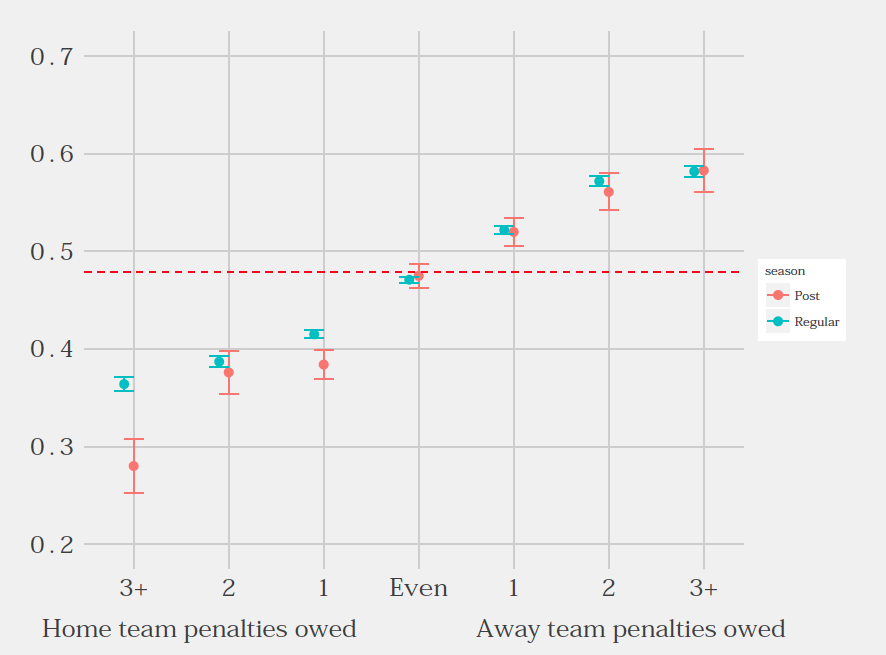
Home teams are unlikely to get penalties when they are owed penalties. They are even less likely to get those penalties in postseason play.
Also, Sam and Micah suggested that it would be worth looking at the type of penalty called given each scenario. While some of the penalties are of unknown types (strange data entry), here’s a mosaic plot of the types that are known, using the first four letters in the columns as the penalty type, along with the penalty differential.
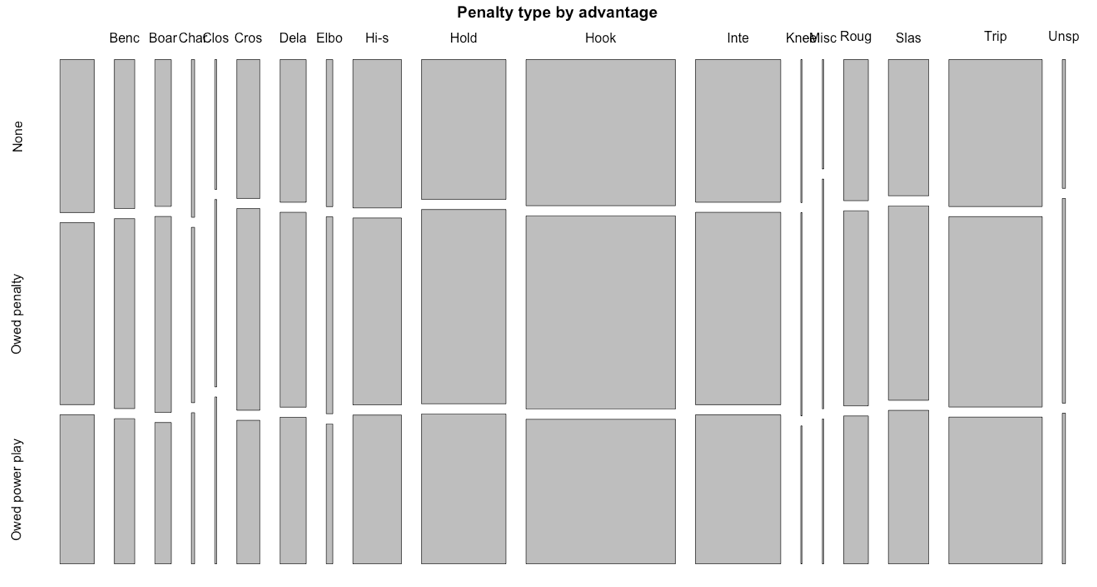
I might be missing something, but there doesn’t…
View original post 29 more words
A dissatisfied reader
I received this comment on my recent article:
Considering you misspelled Berkeley twice in your article, despite the fact it was spelled correctly (by someone else) in a subsequent quote, and say preposterous things like “the answer to that question is no. It might be yes”, it might behoove you to be a little more civil in your tone throughout – you make stupid and careless mistakes too, like anyone else. I came to this article excited for a strong statistical argument and got mostly adolescent snark and vitriol beneath a “real statistician”. The fact that you get “pissed off” is human, but that you have to keep telling us about it, while ranting belligerently, is puerile and self-absorbed.
Cheers.
No, actually Warren Sharp wasn’t redeemed by the Wells report. He’s still wrong.
TL;DR
- I’m really annoyed with Eric Adelson’s recent article.
- Warren Sharp’s analysis was wrong then.
- The Patriots are probably cheaters, but Warren Sharp’s analysis is still wrong now.
- People like simple narratives.
- Comparing aggregated rates without controlling for other factors can be problematic.
- I’m still really annoyed with Eric Adelson’s recent article.
Summary
Last year during the AFC Championship game, the New England Patriots were accused of deflating their own footballs below the pressure allowed by the NFL. The Patriots won the game by what felt like 100-7. Following their win, the media, always needing something to talk about, created a kerfuffle of epicly idiotic proportions. In the two weeks leading up to the Super Bowl, the media was interviewing physics professors about PSI and how it is affected by temperature, Bill Nye made an appearance, and Tom Brady had to talk about his balls (teehee). It was quite a low point for sports writing.
One highlight of the lowlights was an article written by a tout named Warren Sharp. He basically claimed that the Patriots were a huge outlier in terms of their fumble rate and it was impossible to explain how this could happen. This story was picked up by Slate, Huffington Post, and even RealClearPolitics among others. However, his “analysis” was riddled with problematic logic, details of which can be found here and here. Case closed right?
Well apparently this led to a “stat spat“. Eric Adelson, who was nice enough to take the time to interview me, wrote about the “controversy”. I told him that I thought almost all of Sharp’s work was garbage (he quoted me as describing it as “98% bunk”, which I’m pretty sure I never actually said because I don’t think I would ever use the word “bunk”). I was generally unhappy with the way that original article was written as it lent credibility to someone whose argument was so easily dismantled. However, Adelson presented Sharp’s opinion versus my opinion as if they were equally legitimate in spite of the numerous flaws that myself and Mike Lopez pointed out in our Deadspin piece.
The argument “raged on” and then the Super Bowl happened and deflategate went into hibernation. Until it was revived recently by the release of the Wells Report. The Wells Report is a 243-page document detailing the findings of the NFL’s deflategate investigation. (As a fun side note, the firm hired to perform the investigation is the same firm that once denied second hand smoke causes cancer.) Deadspin sums up that report like this:
As a result of this Tom Brady was suspended for 4 games, the Patriots were fined $1,000,000, and New England lost some draft picks.
So it seems the Patriots cheated. (Not the first time they’ve been caught either.) This caused a shit storm (two words? hyphen?) on Twitter and in the media. But after reading so many articles about the deflategate “scandal”, one stood out above the rest to me on the WTF scale. I’m talking about Eric Adelson’s follow-up piece entitled “Deflate-gate report re-energizes stat geek’s controversial fumbling analysis of Patriots“. Here are the first lines of the article:
It began as an intriguing statistical correlation. It blew up into a national debate. Now it’s a civil engineer’s redemption song.
The civil engineer that Adeslon is referring to is none other than Warren Sharp who has been redeemed by the Well’s report. Wait. What?!?!?!
Adelson goes on to say:
Sharp never leapt to the conclusion that the Pats’ alleged deflation of footballs brought about their fumbling advantage – correlation doesn’t mean causation – but many people took it that way. And several statisticians scoffed. After all, this guy runs a gambling site and suddenly he is some sort of stats wizard? One statistician called Sharp’s work “98 percent bunk.”
Some notes:
- Sharp’s “analysis” regarding the Patriots extremely low fumbling rate is incredibly sloppy. I’ll point, once again, to my article (with Mike Lopez) that explains some of the many, many flaws in Sharp’s analysis. No one has really suitably shown that the Patriots ever had a fumbling advantage at all, but Adelson seems to keep stating it as fact for some reason. In fact, the best work I have seen on quantifying the Patriots fumbling rates was done recently by Mike Lopez, and he finds that “once you account for play and game characteristics, it is really difficult to distinguish between the fumble rates of NFL teams.”
- I feel like “correlation doesn’t mean causation”, when stated by a member of the media, is code for “I don’t really know what I’m talking about, but I say this to sound smart.” Of course, he’s right, correlation doesn’t imply causation. But I don’t know who these “statisticians who scoffed” are that he is referring to. I don’t believe Mike nor I ever said anything about causation because we couldn’t even really find a strong correlation to begin with.
- Adelson says, “One statistician called Sharp’s work “98 percent bunk.” The statistician he is referring to is a guy name Gregory J. Matthews at Loyola University Chicago (I hear he’s pretty good, but that he would never use the word bunk cause he’s not a 75 year old grandmother.) Here is a new quote for you: Warren Sharp’s analysis of the Patriots fumble rates was amateurish garbage.
- Finally, a question for Adelson: Why bother calling me to ask for my opinion if you are just going to ignore it anyway and give Sharp’s opinion more weight no matter what I say? That really pisses me off.
Then there is this:
“Now that it seems likely that the Patriots were violating the rules to gain an advantage,” he [Sharp] wrote, “the fact that they also had an extremely low fumble rate makes it more likely that the relationship between inflation levels and fumbling is real – and more likely that the Patriots have materially benefited from their cheating.”
Disclaimer: “cheating” is not suggested by Sharp. But the proximity between the fumble rate and the possible deflation is gathering more credibility. Sharp’s gun is suddenly smoking again.
- But the Patriots DIDN’T have extremely low fumbling rates!!!
- Cheating isn’t suggested by Sharp, it’s just being strongly hinted at by writers in the media who want to create sensationalist stories for the front page of Yahoo Sports.
- Since members of the media seem to be ignoring all of my rational arguments, here is one that maybe will work: NO NO NO NO NO. YOU ARE WRONG! Does yelling work?
The whole article really is a gem of media narrative framing and sensationalism, but I’ll leave you with this one last quote:
“Now I actually have some validation in the field,” Sharp said. “‘Hey, this guy was right all along.'”
No, you weren’t validated.
Recap: Sharp, using terribly flawed statistical analysis, found that the Patriots had outrageously low fumbling rates, then the media picked it up and ran with the story, without asking any questions, because it was convenient and interesting. And now the Wells report some how redeems Sharp.
That is like saying something like 3+3=7 therefore the sky is filled with water. The media reports this as brilliant. Then a mathematician comes along and points out that 3+3 does not in fact equal 7 and therefore the logic is flawed. Then when it is discovered that the sky is blue (more likely than not), which is like the color of water, the media claims that the original argument is vindicated. This is insane.
Why don’t people understand that Sharp is wrong??
So, this got me thinking about why this story has so many legs. I refuse to believe that it’s simply that people are stupid (though some may argue that this is the reason). Rather, I choose to believe that people simply like simple narratives and interesting anecdotes and so that’s what the media gives them.
A good example of this comes from an article by biological economist Terry Burnham entitled, “A trick for higher SAT scores? Unfortunately, no.” The article describes an interesting idea (“that people score higher on a test if the questions are hard to read”) backed by statistical evidence. This got picked up by Malcolm Gladwell, the king of the anecdotes (also a very good and entertaining writer), in his book David and Goliath. Unfortunately, it’s probably not true. Burnham states:
The original paper reached its conclusions based on the test scores of 40 people. In our paper, we analyze a total of over 7,000 people by looking at the original study and 16 additional studies. Our summary:Easy-to-read average score: 1.43/3 (17 studies, 3,657 people)Hard-to-read average score: 1.42/3 (17 studies, 3,710 people)
Burnham also mentions three lessons that he takes away from this:
-
Beware simple stories.
- Ideas have considerable “Meme-mentum”
- We can measure the rate of learning.
These first two lessons are directly applicable to Deflategate and the Warren Sharp “analysis”. The Patriots have a nearly impossible fumble rate (a simple story!). Story gets picked up by major media outlets (considerable “Meme-mentum”!). Unfortunately, the story probably isn’t true.
Finally, Burnham sums up the story as follows.
The story told by Professor Kahneman and by Malcolm Gladwell is very good. In most cases, however, reality is messier than the summary story.
Another thought about aggregated rates
Speaking of the Patriots fumble rates, using rates without controlling for any other factors can often lead to erroneous conclusions. One famous example of this can be found in Bickell, Hammel, and O’Connell (1975) which looked at the rates of admissions of men and women to graduate school at Berkeley in 1973. 44% of men were being admitted while only 35% of women were given the same opportunity. So a sensationalist media outlet might have posted the headline “Berkeley found to be discriminating against women!” Imagine the outrage! Imagine the click through rate! Fortunately, it wasn’t true (Simpson’s paradox!). Here is the abstract from that article:
Examination of aggregate data on graduate admissions to the University of California, Berkeley, for fall 1973 shows a clear but misleading pattern of bias against female applicants. Examination of the disaggregated data reveals few decision-making units that show statistically significant departures from expected frequencies of female admissions, and about as many units appear to favor women as to favor men. If the data are properly pooled, taking into account the autonomy of departmental decision making, thus correcting for the tendency of women to apply to graduate departments that are more difficult for applicants of either sex to enter, there is a small but statistically significant bias in favor of women. The graduate departments that are easier to enter tend to be those that require more mathematics in the undergraduate preparatory curriculum. The bias in the aggregated data stems not from any pattern of discrimination on the part of admissions committees, which seem quite fair on the whole, but apparently from prior screening at earlier levels of the educational system. Women are shunted by their socialization and education toward fields of graduate study that are generally more crowded, less productive of completed degrees, and less well funded, and that frequently offer poorer professional employment prospects.
Sharp is guilty of exactly this (among many other things) when he is comparing fumble rates between teams in the NFL and not controlling for any other factors.
Other fun example of this include the US Navy, in the process of recruiting, claiming that it was safer to be in the US Navy than to live in NYC. They cited the statistics that the death rate in the US Navy during the Spanish American war was only 9 out of 1000 whereas the death rate in NYC was 16 out of 1000. I use this example in every statistics class I teach, because it’s so easy to figure out the flawed logic (people in the Navy are older than people in NYC on average; the groups aren’t comparable).
A more recent example of this exact same phenomenon, not controlling for age, was seen in Bill Barnwell’s article called Mere Mortals where Barnwell asks the provocative question:
Why is it that baseball players from the ’60s, ’70s, and ’80s are dying more frequently than football players from the same era?
It’s because those baseball players are older on average. And old people die more often than not old people. You can’t just compare rates without controlling for external factors. (Not to mention that you should be using survival analysis rather than comparing death rates in studies like this!) Details of the problems with that article can be found here.
Anyway, my point in this section is that the direct comparison of simple rates between groups often leads to incorrect conclusions. Including the conclusions of Mr. Sharp.
There are really two separate issues here.
A quick note that there are really two separate issues in the Warren Sharp / Deflategate “stat spat”
- One issue is did the Patriots cheat. The answer to that question is probably yes. The Patriots have been caught cheating in the past. And I just assume everyone is trying to get away with as much as possible without getting caught.
- The second issue is do the Patriots have an impossibly low fumble rate. The answer to that question is no. (It might be yes, but no one has shown that yes with a legitimate analysis.)
- These two issues are likely largely unrelated. Also, the Patriots fumble rate is just simply not a huge outlier. (I don’t know how many times I can possible say this.)
Final thought
What really bothers me about this whole situation is that it doesn’t seem to be a series of honest mistakes. Adelson knows what real statisticians think about this. I know because I am one and he called me and I told him. Mike Lopez and I also laid out the details of flaws in Sharp’s original arguments and other criticism’s or Sharp’s “analysis” can be found here, here, here, and here. In spite of all of these very legitimate criticisms, it seems that many members of the media ran with this story anyway. But what sets Adelson apart from the rest of the media, is that he is now claiming that Sharp has been redeemed by the Well’s report and still lending credence to Sharp’s fumble rate analysis. The only rational explanation for this, in my mind, is willful ignorance of the facts in favor of an interesting narrative. And that really pisses me off.
A generalized linear mixed model approach to estimating fumble frequencies in the National Football League
The Patriots aren’t that much better at not fumbling than other NFL teams. The Patriots also probably cheated. Totally different things.
I told myself I was done with with Deflategate – and really, I was – that is, until I read this.
“Now I actually have some validation in the field,” Sharp said. “‘Hey, this guy was right all along.'”
Wait, what?
Forget the data twisting and statistical errors of the original analysis. The author claims to be vindicated by the fact that the Wells report found Patriots quarterback Tom Brady to be ‘more likely than not’ to have been involved with the deflation of footballs.
Okay then.*
*******
But despite my skepticism regarding Sharp’s analysis, two of the brightest minds in football analytics also taken the time to look at Patriots fumble rates, eventually concluding that the Patriots were indeed outliers.
First, after comparing Sharp’s critics to Nabisco running a study on snack cookies**, Brian Burke used multiple linear regression to model the number of fumbles in each NFL game since 2000, finding that the Pats…
View original post 1,642 more words
I hated my teacher, but I learned a lot….
I like the below quote form this article:
Michele Pellizzari, an economics professor at the University of Geneva in Switzerland, has a more serious claim: that course evaluations may in fact measure, and thus motivate, the opposite of good teaching.
His experiment took place with students at the Bocconi University Department of Economics in Milan, Italy. There, students are given a cognitive test on entry, which establishes their basic aptitude, and they are randomly assigned to professors.
The paper compared the student evaluations of a particular professor to another measure of teacher quality: how those students performed in a subsequent course. In other words, if I have Dr. Muccio in Microeconomics I, what’s my grade next year in Macroeconomics II?
Here’s what he found. The better the professors were, as measured by their students’ grades in later classes, the lower their ratings from students.
Cheers.
“It’s in the literature”
Until we acknowledge that the most common reason a method is chosen is because, “I saw it in a widely-cited paper in journal XX from my field” it is likely that little progress will be made on resolving the statistical problems in science.
From article by Jeff Leek.
Dear Media, Please stop citing this guys numbers. Cheers, Greg
On April 17th, the NY Times published an article entitled: “At a Long Island Beach, Human Tempers Flare Over Claws and Feathers”. In this article, they state:
The fight comes amid growing concern nationwide about the impact of feral or stray cats on wildlife in general and birds in particular. Federal researchers have estimated that cats, including outdoor house cats and tens of millions of strays, kill 2.4 billion birds annually in the contiguous United States.
Where did that 2.4 billion number come from? The article sites another article. In that article they state:
In a report that scaled up local surveys and pilot studies to national dimensions, scientists from the Smithsonian Conservation Biology Institute and the Fish and Wildlife Service estimated that domestic cats in the United States — both the pet Fluffies that spend part of the day outdoors and the unnamed strays and ferals that never leave it — kill a median of 2.4 billion birds and 12.3 billion mammals a year, most of them native mammals like shrews, chipmunks and voles rather than introduced pests like the Norway rat.
The “report” that they cite can be found here. It is an article in the journal Nature Communications called “The impact of free-ranging domestic cats on wildlife of the United States”. You might remember this from articles such as this, this, this, this and, more recently, this.
I got involved in this when I was asked to review the paper for Alley Cat Allies. (Full disclosure, I was paid by them to review the Nature Communications paper and my full review can be found here.) In general, I found the entire paper unsuitable for publication in an academic journal as a result of the numerous major statistical flaws. I’m not alone in this belief. You can find others who question the validity of the studies here and here, for instance.
But if you’re looking for more massive bird death “estimates”, don’t worry. It appears that Loss didn’t stop at just estimating cat predation mortality. He has gone on to publish a whole series of papers (and landed a job at Oklahoma State) “estimating” bird mortality of different sorts:
- Refining estimates of bird collision and electrocution mortality at power lines in the United States: 12 – 64 million
- Estimation of Bird-Vehicle Collision Mortality on U.S. Roads: 89 – 340 million
- Estimates of bird collision mortality at wind facilities in the contiguous United States: 140,000 – 328,000
- Bird–building collisions in the United States: Estimates of annual mortality and species vulnerability: 100 million – 1 billion
- The impact of free-ranging domestic cats on wildlife of the United States: 1.3 – 4 billion
Those numbers are huge! And I don’t trust a single one of them.
Cheers.
I can’t reproduce these p-values from a PloS Medicine article (Am I missing something obvious?)
So I was trying to find an article with statistics in it that I could have my intro stats students reproduce as an assignment. So I went to PloS Medicine and randomly chose a recent paper. I can across this one: http://journals.plos.org/plosmedicine/article?id=10.1371/journal.pmed.1001807#pmed-1001807-t001
I was going to have my student reproduce the numbers in this paragraph in the results section:
As described above, GII VLPs were distinct from the GI VLPs at 7 d post-vaccination. Interestingly, the GII.4C VLP (representing the vaccine component) associated much more closely with the early GII.4 VLPs than with either the late GII.4 VLPs or the GII VLPs from other genotypes (ANOVA: F2,4 = 14.74, p = 0.0143), showing that the IgG response to GII.4C vaccination is highly cross-reactive with the early GII.4 VLPs but not the antigenically distinct contemporary GII.4 VLPs or other GII VLPs. Even as late as 180 d post-vaccination (Fig. 9G–I), clustering by genogroup (or by subclades within genogroups) remained (t-test: t53 = 23.96, p < 0.001), although overall distances (dissimilarities) in IgG responses differentiating between VLPs had decreased compared to day 7. Specifically, the GI viruses clustered relative to the other virus strains (t25 = 11.32, p = 0.0024), GII.4C continued to cluster with GII.4.1997 and GII.4.2002 (t25 = 8.973, p = 0.0061), and the contemporary GII.4 VLPs remained tightly clustered with the other GII genotypes (t38 = 19.24, p < 0.001). Interestingly, and echoing our findings above, GII.4.1997 remained somewhat distinct from GII.4C and GII.4.2002 (Fig. 9G–I) because of the elevated levels of IgG against GII.4.1997 VLP still found in several of the vaccine recipients 6 mo post-vaccination.
…but I can’t reproduce the numbers myself. I can reproduce the p-value for the ANOVA (0.0143), but I can’t reproduce any of the p-values for the t-tests. For instance, with a t-test statistic of 8.973 with 25 degrees of freedom, I get a two-sided p-value of 0.00000000272 as opposed to the stated p-value of 0.0061. Am I missing something obvious? Or are these p-values all wrong?
Follow-up question: If (IF!) the p-values are all wrong, as I suspect, should I still assign it to my students and ask them to reproduce the numbers as a lesson that they shouldn’t trust every statistics they see?
Cheers!
