
The 2016 Dallas Cowboys are the 2015 Carolina Panthers
I was looking at some Dallas Cowboys (13-3) stats the other day, and I thought to myself that I had seen this before. By “this” I mean a team with a really good record, but you just aren’t convinced by the team somehow. Where have I seen it before? 2015 Carolina Panthers. The Panthers were really good last year, but you just never got the feeling they were a great team. They finished the season 15-1, then squeaked past Seattle in the Divisional Round as Russell Wilson had arguably the worst game of his career and still almost won. They then crushed the Cardinals on there way to the Super Bowl where they got man handled by the Denver Broncos.
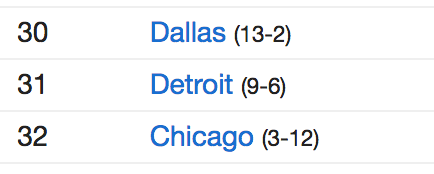
So let’s take a look at how similar these teams are. First, I think it’s interesting to look at strength of schedule. According to TeamRankings.com, the 2015 Carolina Panthers had the 29th most difficult schedule and the 2016 Dallas Cowboys schedule is ranked 30th in terms of difficulty. So while both of their records were very good, there schedules weren’t exactly the most difficult.
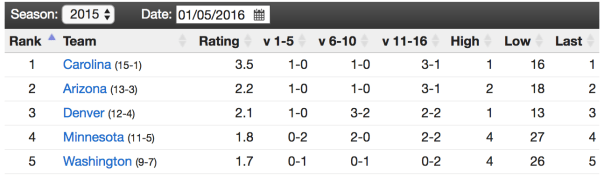
2015:

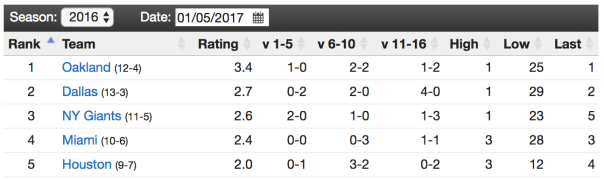
2016:
Dallas is 13-3 overall, but only 3-2 against teams that made the playoffs this year. (Fun Note: Atlanta is 2-2 against playoff teams and the Patriots are 4-1.) The Panthers were 4-0 against playoff teams in 2015. Compare this to Denver who played 7 games against playoff teams last year and went 5-2.
Next I looked at “Luck” as defined by TeamRankings.com. In 2015, Carolina was ranked number 1 luckiest team and Dallas in 2016 is ranked number 2.
And just look at these team stat lines next to each other. The 2015 Carolina Panthers scored 500 points and allowed 308. The 2016 Cowboys scored 421 and allowed 306. And look at the average points per drive. The Cowboys this year scored 2.45 pts/drive and last year the Panthers put up 2.4 pts/drive.
Cowboys 2016:

Panthers 2015: 
So, no doubt the 2016 Dallas Cowboys are pretty good. I just don’t think they are great. I think they have a decent chance to make the Super Bowl, but I have a hard time seeing them winning it. I don’t think they can beat any of the teams that have a chance to come out of the AFC (realistically, New England, Kansas City, or Pittsburgh). And I’m not sure they can beat the Packers who are playing great right now. So this is where I might say something like: “If the Cowboys win the Super Bowl, I’ll get the Cowboys logo tattooed on my forehead”. But that wouldn’t be a smart thing to do because, if there is one thing that I learned from 2016, it’s that even events that have a 0% chance of happening (You know what I’m talking about) can actually happen. And the Cowboys have a much better than 0% chance to win the Super Bowl. But I’d bet a tattoo on my forehead that they won’t win the Super Bowl this year……….
Cheers.
The Santa Claus of NFL Wildcard berths is the AFC South (it used to be the NFC North)
With the NFL playoffs coming up this weekend, I got to thinking about the NFL schedule and how that could help or hurt a team trying to make the playoffs. A full half of an NFL team’s schedule is essentially random based on a rotating formula. So, I wanted to look to see if there were any patterns in how these random scheduling assignments affected numbers of wins and a team’s chances of making the playoffs. First an explanation of the NFL schedule.
The NFL schedule is completely determined by a formula. Each team plays:
- 6 games against the teams in their division.
- 4 games against a different division in their conference.
- 4 games against a division in the other conference.
- 2 games against teams in their conference, not in division they are assigned that finished with the same rank in their division.
As an example, the 2016 New England Patriots played the the teams in their division (Bills, Dolphins, Jets) two times each for a total of 6 games. They were assigned the AFC North (Browns, Bengals, Ravens, Steelers) and the NFC West (49ers, Seahawks, Rams, Cardinals). Their two remaining games were against the team that won the AFC South in 2015 (Houston) and the team that won the AFC West in 2015 (Broncos). (The assignment of the divisions within a conference and between conferences are on a 3 and 4 year rotation, respectively, and repeats fully every twelve years.)
I collected data going back to 2002 (when realignment occurred) on all four aspects that make up a team’s schedule: The division they play in, the random division in their conference, the random division in the other conference, and their rank in their division from the previous season.
Some (maybe) interesting things I found:
- Of the 180 teams that made the playoffs in the last 15 years, 51 of the them played the AFC South. This is the most of any division.
- Of the 180 teams that made the playoffs in the last 15 years, 41 of the them played the NFC East and another 41 played the AFC West. This was the least of any division.
- If we look only at wildcard teams in the past 15 years, 21 of the 60 played the AFC South and only 11 were assigned to play the AFC West.
- 20 of the 60 wildcard teams played the NFC North and only 11 of those 60 played the NFC East.
- If we look only at AFC Wildcard teams, 13 of the 30 in the past 15 years played the AFC South, 9 played the AFC North, 5 played the AFC West, and only 3 (!) played the AFC East.

- If we look at AFC Wildcard teams since 2011, 7 out of 12 played the AFC South.
- Of the 30 NFC wildcards teams in the last 15 years, 6 each played the NFC East, South, and West, respectively. However, 12 wildcard teams played the NFC North.

- If we look at NFC Wildcard teams from 2003-2009, 8 out of 14 played the NFC North.

So it looks like the teams that have drawn the NFC North and the AFC South are the divisions that historically have produced the most wildcard teams. In fact in the last six seasons (2011-2016), almost HALF (11/24) of the NFL’s total wildcard teams had the AFC South on their schedule. Not so much recently, but in the late 2000s, the best division to draw was the NFC North. From 2003-2009, 13/28 wildcard teams played the NFC North. In contrast, over that same period, only THREE wildcard teams played the NFC East.
So who played the AFC South this year? The NFC North and the AFC West. Interestingly, both divisions produced a wild card this year (Detroit Lions and Oakland Raiders). And the NFC North? Who played them this year? The AFC South and the NFC East, the latter of which produced a wild card team (New York Giants).
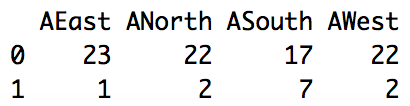
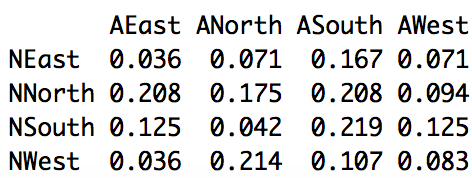
What about AFC and NFC combinations? Below are two tables showing how often each schedule combination has produced a wildcard team. You can see that the combination of AFC and NFC South has produced the highest percentage of playoff teams with 21.9% (7/32) followed by the combination of AFC North and NFC West with 21.4% (6/28). This level of granularity is a little bit interesting, but we are cutting the data up so much I’m not sure there is anything actually significant in the formal sense to be found here. But I still think it’s interesting.

Cheers.
NFL Playoff teams: 2002-2016
Inspired by this, I thought I would do my own take on this idea. The plot below shows each of the 8 NFL divisions with the AFC on the left and the NFC on the right. The height of the bar in each square is the number of wins for that team in that season. If the team made the playoffs, the color is saturated; if the team missed the playoffs, the colors in the square are faded.

Cheers.
Matching to estimate the causal effects of firing an NFL coach
I want to be Mike Lopez when I grow up.
Note: This post is a bit longer than usual. It’s part tutorial and part analysis. Feel free to jump to the conclusions, which are (I think) quite interesting. Additionally, the data and code are posted on Github.
The 2016 NFL regular season has ended, and with it has come the usual coaching carousel in which many franchises have opted to fire their head coach.
As of January 2nd, six of the league’s 32 teams have openings, with five of those coming by way of a fired predecessor (Denver’s retiring Gary Kubiak being the lone exception). But it’s not like 2016 is any type of outlier; roughly 4 coaches per year have been canned since the early 1980’s.
What’s interesting, though, is that despite the frequent, franchise-altering decisions made across the league, it’s mostly unknown whether or not this choice benefits longterm franchise prospects. (Postscript: Today, Brian Burke looks at the…
View original post 2,114 more words
NFL Picks – Week 17
New Orleans at Atlanta
Prediction: Falcons 32-29 (59.4%)
Pick: Saints +7
Total: Over 56
Baltimore at Cincinnati
Prediction: Bengals 22-20 (53.9%)
Pick: Ravens +2.5
Total: Over 41.5
Oakland at Denver
Prediction: Broncos 22-20 (54.1%)
Pick: Raiders +2.5
Total: Over 40.5
Green Bay at Detroit
Prediction: Packers 24-22 (55.5%)
Pick: Lions +3
Total: Under 47
Jacksonville at Indianapolis
Prediction: Colts 26-21 (62.1%)
Pick: Colts -4.5
Total: Under 47
New England at Miami
Prediction: Patriots 26-21 (63.4%)
Pick: Dolphins +9.5
Total: Over 44.5
Chicago at Minnesota
Prediction: Vikings 22-17 (65.1%)
Pick: Bears +5.5
Total: Under 41
Buffalo at NY Jets
Prediction: Bills 23-21 (57.0%)
Pick: Jets +6
Total: Under 44
Dallas at Philadelphia
Prediction: Cowboys 23-22 (51.4%)
Pick: Cowboys +6.5
Total: Over 42.5
Cleveland at Pittsburgh
Prediction: Steelers 27-17 (77.6%)
Pick: Steelers -7
Total: Over 44
Kansas City at San Diego
Prediction: Chiefs 23-22 (52.7%)
Pick: Chargers +4.5
Total: Over 45
Seattle at San Francisco
Prediction: Seahawks 24-18 (67.3%)
Pick: 49ers +9.5
Total: Under 43
Arizona at Los Angeles (nee St. Louis)
Prediction: Cardinals 21-16 (63.3%)
Pick: Rams +6
Total: Under 41.5
Carolina at Tampa Bay
Prediction: Panthers 23-22 (53.2%)
Pick: Panthers +6.5
Total: Under 46.5
Houston at Tennessee
Prediction: Titans 20-19 (52.8%)
Pick: Texans +3
Total: Under 40
NY Giants at Washington
Prediction: Washington Football Team 26-23 (57.9%)
Pick: Giants +8
Total: Over 44
NFL Picks – Week 16
Miami at Buffalo
Prediction: Bills 24-20 (60.1%)
Pick: Bills -3.5
Total: Over 42
Atlanta at Carolina
Prediction: Panthers 26-25 (52.0%)
Pick: Panthers +3.5
Total: Under 52.5
Washington at Chicago
Prediction: Bears 25-24 (50.5%)
Pick: Bears +3.5
Total: Over 47
San Diego at Cleveland
Prediction: Chargers 24-21 (58.3%)
Pick: Browns +6
Total: Over 44
Minnesota at Green Bay
Prediction: Packers 23-18 (63.8%)
Pick: Vikings +6.5
Total: Under 43
Cincinnati at Houston
Prediction: Bengals 21-20 (51.6%)
Pick: Bengals +2 PUSH
Total: Under 41
Tennessee at Jacksonville
Prediction: Titans 22-21 (52.4%)
Pick: Jaguars +4.5
Total: Under 44
Denver at Kansas City
Prediction: Chiefs 19-18 (51.4%)
Pick: Broncos +4
Total: Under 37.5
NY Jets at New England
Prediction: Patriots 28-18 (74.8%)
Pick: Jets +16.5
Total: Over 44 PUSH
Tampa Bay at New Orleans
Prediction: Saints 30-25 (64.1%)
Pick: Saints -3
Total: Over 52.5
Indianapolis at Oakland
Prediction: Raiders 27-25 (58.0%)
Pick: Colts +3.5
Total: Under 53
NY Giants at Philadelphia
Prediction: Eagles 22-18 (59.5%)
Pick: Eagles +2.5
Total: Under 41.5
Baltimore at Pittsburgh
Prediction: Steelers 22-18 (59.2%)
Pick: Ravens +5
Total: Under 44
Arizona at Seattle
Prediction: Seahawks 22-19 (59.0%)
Pick: Cardinals +8
Total: Under 43.5
San Francisco at Los Angeles (nee St. Louis)
Prediction: Rams 20-18 (56.2%)
Pick: 49ers +3.5
Total: Under 43.5
Detroit at Dallas
Prediction: Cowboys 26-21 (62.5%)
Pick: Lions +7
Total: Over 43
RIPPEN 2016
So a few years ago, I proposed a measure of quarterback performance called RIPPEN, but I haven’t kept up with the updating of it. Today, I had some time so I updated it for the past few years (with some new modifications). Below are the the results ordered from best to worst in 2016.
So right now I have Ryan, Brady, and Prescott as the top three passers in the league. I’d say that makes reasonable sense. One of my favorite parts of this table is Eli Manning, who has dropped in all four years presented here. Poor Eli. Alternatively, you’ll notice that Brady has gotten better in all 4 years listed here. Really amazing. Considering he’s 39 years old. (Side note: I’m 34 and I feel old. This guy is 5 years older than I am and is one of the best athletes on the planet. Dammit.)
|
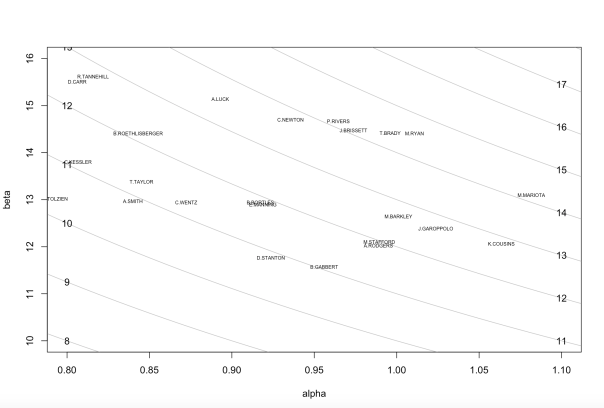
One other interesting aspect of RIPPEN is that you get parameters estimates for the gamma distribution of lengths of completed passed. Below is a plot of the alpha and beta parameters estimated for each player. You may recall from your mathematical statistics course, that the mean of the gamma distribution is alpha times beta. So I’ve plotted lines corresponding to combinations of the parameters that result in the same mean. So for instance, Kaepernick and Luck have about the same expected value for the yardage of a completed pass, but they do it in different ways. There are a bunch of quarterbacks in the middle, so let’s zoom in for a closer look at that part of the graph.

From here, we can see that there seems to be a pretty elite group of quarterbacks with means over 14 including Rivers, Brady, Ryan, and Mariota.
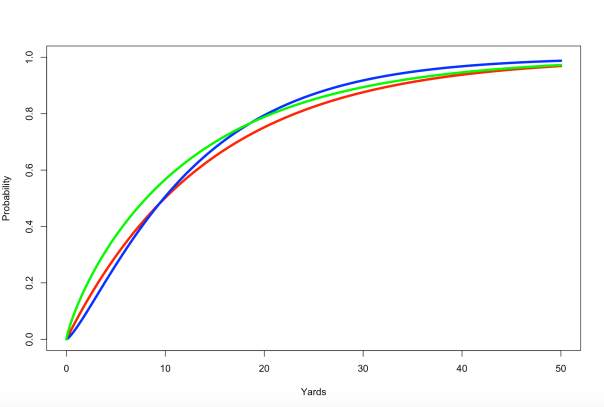
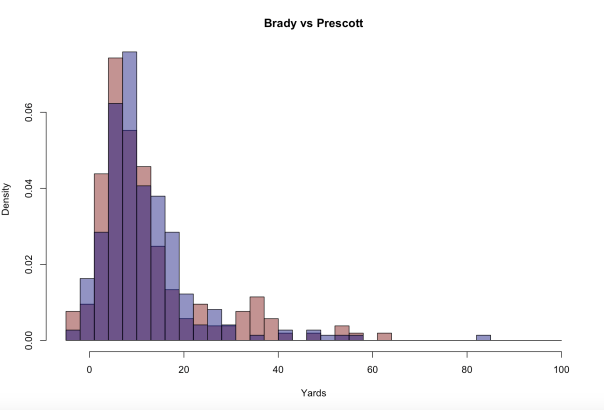
To get an idea of how these parameters change the gamma distribution, let’s look at Prescott, Brady, and Tannehill. The plot below is the cdf function for Prescott (blue), Brady (red), and Tannehill (green). The way this plot is read is for a specific value of yardage, the height of the curve is the probability that a pass is LESS than that specific yardage. So, for instance, Tannehill has the highest probability of a completed pass being less than 5 yards (recall we are only looking at completed passes here). And Brady’s probability is just slightly higher than Prescott’s at 5. However, somewhere around 10 yards Prescott and Brady switch. So Prescott is more likely to have a pass that is less than 20 yards than Brady is (i.e. Brady is more likely to have a completed pass go for long yardage). We can check to see how these estimated curves line up with reality by looking at the histograms of the actual data.
Here Brady is red and Prescott is again blue, we can see that Brady is more likely to have passes in the 0-5 yard range, whereas prescott is more likely than Brady to have passes in the 10-20 range, but then Brady is more likely to have passes in the 30-40 range whereas Prescott has very few completed passes over 30 yards.
Kinds neat stuff. I’m going to do something else now.
Cheers.

Continuous Line Artwork For Purchase
I love this.
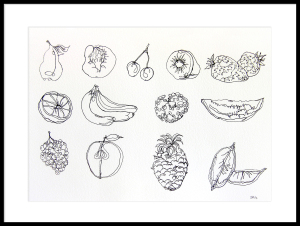 “Fruit”, Medium – Ink, Framed Dimensions – 19″ x 23″, Price – $600
 “Expression”, Medium – Ink, Watercolor, Marker, Dimensions – 37.5″ x 122″, Price – $1,600
 “People”, Medium – Watercolor & Ink, Framed Dimensions – 19″ x 23″, Price – SOLD
 “Sunrise”, Medium – Watercolor & Ink, Framed Dimensions – 30″ x 37.5″, Price – $900
 “Stilt Houses”, Medium – Watercolor & Ink, Framed Dimensions – 19″ x 23″, Price – SOLD
 “Sketches”, Medium – Ink, Framed Dimensions – 30″ x 38″, Price – SOLD
 “Laundry”, Medium – Watercolor & Ink, Framed Dimensions – 30″ x 37.5″, Price – SOLD
 “Faces”, Medium – Ink, Framed Dimensions – 25″ x 36.5″, Price – $800
 “Faces & Houses”, Medium – Ink, Framed Dimensions – 21.5″ x 41.5″, Price – $900
 “Country Life”, Medium – Ink, Framed Dimensions – 21.5″ x 41.5″, Price – $900
 “Spring”, Medium – Watercolor & Ink, Framed Dimensions…
View original post 37 more words
NFL Picks – Week 15
Los Angeles (nee St. Louis) at Seattle
Prediction: Seahawks 24-16 (71.3%)
Pick: Rams +15
Total: Over 38.5
New Orleans at Arizona
Prediction: Cardinals 26-24 (58.1%)
Pick: Saints +2.5
Total: Over 50
San Francisco at Atlanta
Prediction: Falcons 26-21 (64.7%)
Pick: 49ers +13.5
Total: Under 51.5
Philadelphia at Baltimore
Prediction: Ravens 23-22 (54.9%)
Pick: Eagles +6
Total: Over 41.5
Cleveland at Buffalo
Prediction: Bills 24-18 (65.9%)
Pick: Browns +10
Total: Under 42.5
Green Bay at Chicago
Prediction: Packers 24-21 (57.0%)
Pick: Bears +6.5
Total: Over 42.5
Pittsburgh at Cincinnati
Prediction: Bengals 24-22 (53.1%)
Pick: Bengals +3.5
Total: Over 44 PUSH
Tampa Bay at Dallas
Prediction: Cowboys 24-20 (61.5%)
Pick: Buccaneers +7
Total: Under 46 PUSH
New England at Denver
Prediction: Broncos 23-22 (50.9%)
Pick: Broncos +3
Total: Over 44
Jacksonville at Houston
Prediction: Texans 23-18 (63.4%)
Pick: Jaguars +6
Total: Over 39
Tennessee at Kansas City
Prediction: Chiefs 24-19 (63.5%)
Pick: Titans +5.5
Total: Under 43
Indianapolis at Minnesota
Prediction: Vikings 23-21 (56.4%)
Pick: Colts +4
Total: Under 44.5
Detroit at NY Giants
Prediction: Giants 23-22 (55.0%)
Pick: Lions +4.5
Total: Over 41.5
Miami at NY Jets
Prediction: Jets 22-20 (55.8%)
Pick: Jets +2.5
Total: Over 38
Oakland at San Diego
Prediction: Chargers 24-22 (56.1%)
Pick: Chargers +3 PUSH
Total: Under 50
Carolina at Washington
Prediction: Panthers 23-22 (52.2%)
Pick: Panthers +6.5
Total: Under 51
