March 24 Kaggle Probabilities
Currently in 170th. Better than yesterday.

My Kaggle probabilities for the men’s games today:
(Remember, these aren’t probabilities that these teams will win this particular game, it’s the pre-tournament probability that they would make it to a particular round.)
Colorado: 18.3%
Marquette: 60.27%
Purdue: 84.1%
Utah St: 7.62%
James Madison: 11.67%
Duke: 50.77%
Clemson: 17.55%
Baylor: 53.01%
Grand Canyon: 13.95%
Alabama: 49.01%
Northwestern: 4.51% (0% in my aggressive bracket)
UConn: 88.83% (100% in aggressive bracket)
Texas A&M: 6.36%
Houston: 83.74%
Yale: 3.25%
San Diego St: 31.47%
My Kaggle probabilities for the women’s games today:
(Remember, these aren’t probabilities that these teams will win this particular game, it’s the pre-tournament probability that they would make it to a particular round.)
Colorado: 42.38%
Kansas St: 53.03%
South Carolina: 97.7% (100% in aggressive bracket)
North Carolina: 0.79% (0% in my aggressive bracket)
Ohio St: 77.5%
Duke: 19.72%
MTSU: 2.73%
LSU: 78.24%
Nebraska: 10.95%
Oregon St: 83.56%
Alabama: 10.63%
Texas: 82.88%
Iowa St: 6.96%
Stanford: 89.52%
Baylor: 36.57%
Virginia Tech: 57.18%
Go UConn.
Cheers.
NCAA Tournament Stuff – March 23,2024
The real stories everyone should be talking about are how David Carr beat Keegan O’Toole in the semi-finals of the NCAA wrestling tournament at 165, Carter Starocci had to wrestle former national champions back to back in the quarter- (Mekhi Lewis) and semi-finals (Shane Griffith) and he beat them both, and Drake Ayala of Iowa made the finals keep Iowa’s streak of THIRTY THREE years in a row with a national finalist alive.
But you probably want to read about basketball, huh?
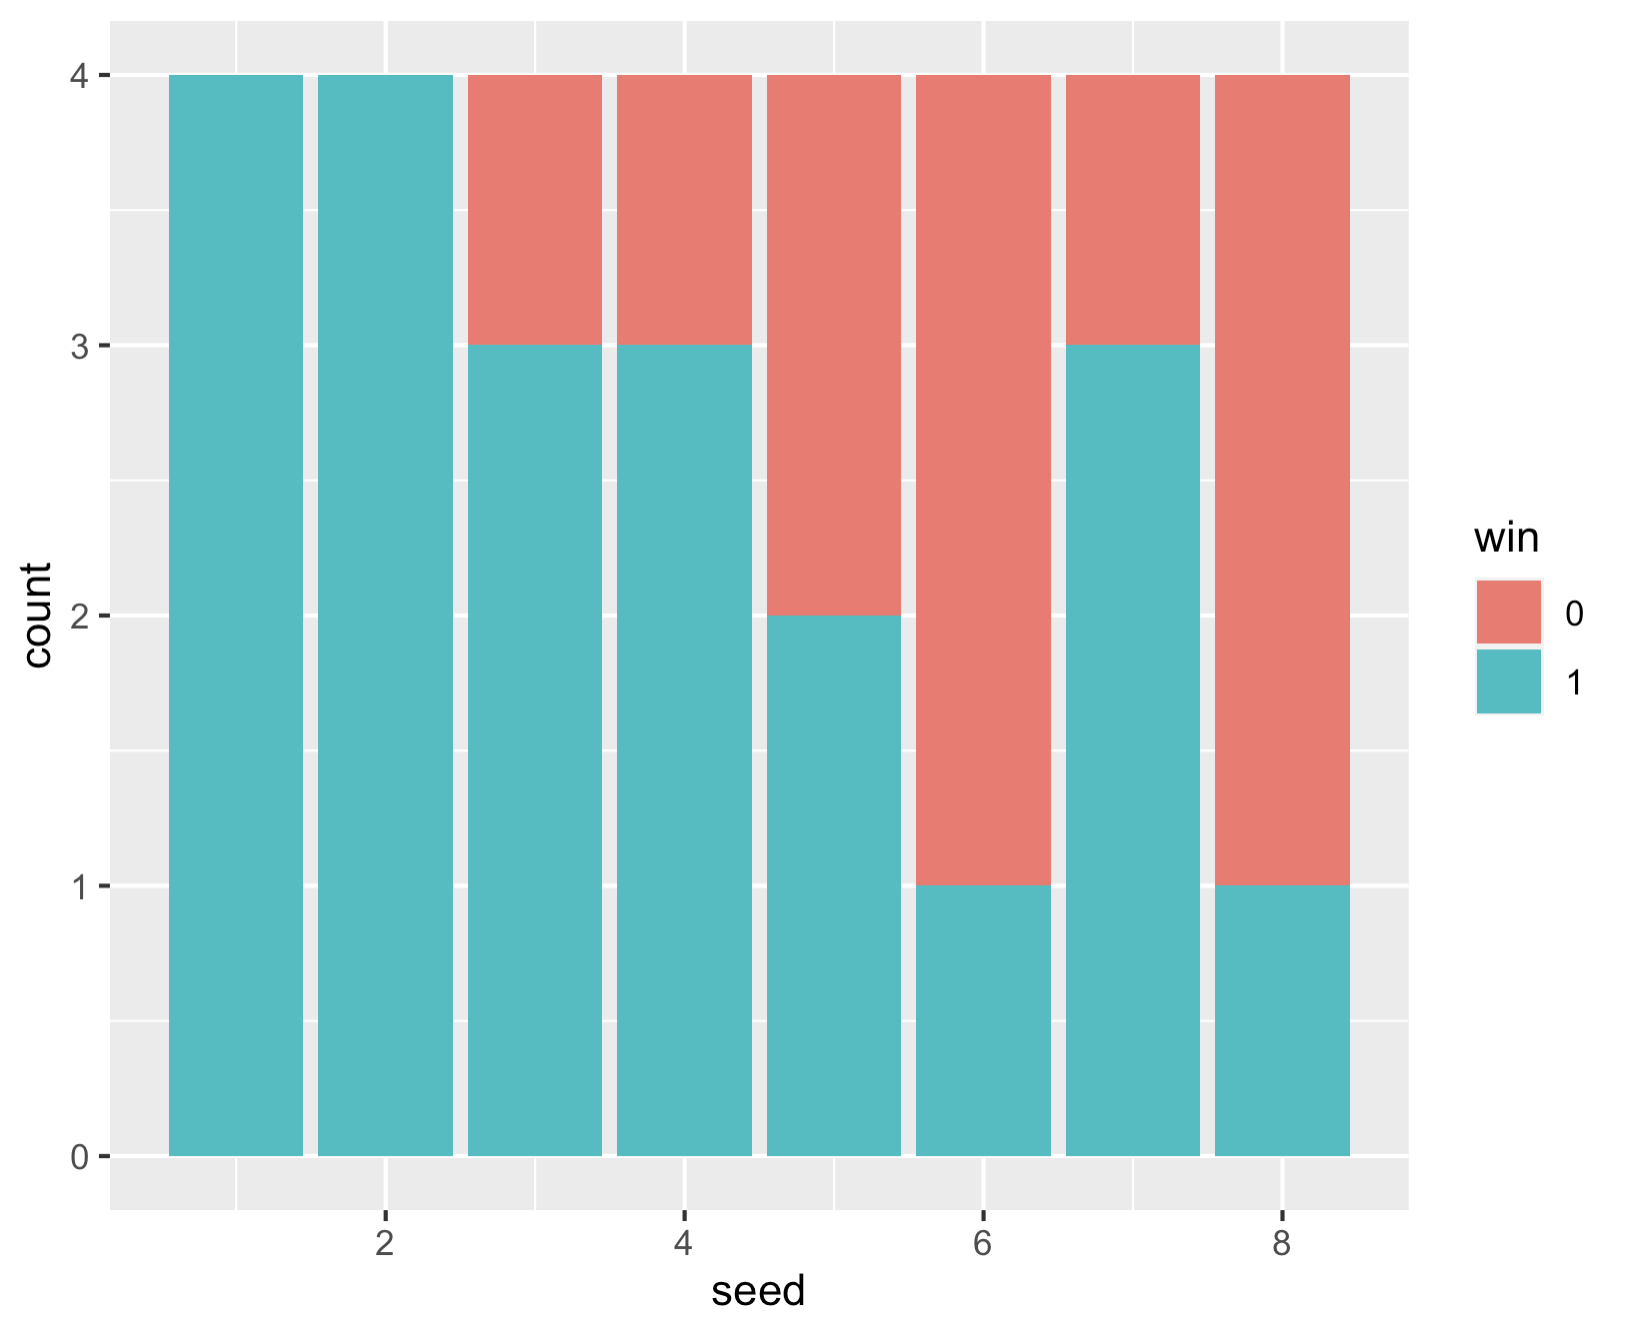
So here’s a fun, simple data viz of wins by seed:
Below is a plot of wins by seed in the first round of the men’s NCAA tournament. The 6 and 8 seeds combined for only two total wins ((6)Clemson and (8)Utah State). At least one of every seed 1 through 14 advanced and seed 9 through 12 went went a combined 9-7. In total the lower seed won 11 of the first 32 games.
As for the Kaggle contest, I’m currently in 233 out of 820 (top 30%). Not great, but also not terrible either. There should be a lot more shuffling of the leaderboards in these later rounds with the changes in scoring, so it’s going to be way more exciting than past contests, I think. At least in terms of chaos.

Here are my probabilities for the women’s games today:
Tennessee: 78.2%
UConn: 100%
Kansas: 55.6%
Indiana: 98.0%
Notre Dame: 99.1%
NC State: 98.4%
Iowa: 100%
Syracuse: 72.0%
Oklahoma: 76.0%
USC: 99.3%
Ole Miss: 72.7%
West Virginia: 63.0%
Creighton: 56.2%
Gonzaga: 96.9%
UCLA: 99.0%
Utah: 76.0%
And here are my Kaggle probabilities for the men’s games today:
(Remember, these aren’t probabilities that these teams will win this particular game, it’s the pre-tournament probability that they would make it to a particular round.)
Arizona: 51.6%
Dayton: 19.5%
Kansas: 47.4%
Gonzaga: 35.1%
UNC: 73.9%
Michigan St: 13.3%
NC State: 14.0%
Oakland: 1.78%
Iowa St: 71.6%
Washington St: 11.9%
Tennessee: 69.5%
Texas: 17.7%
Illinois: 55.5%
Duquesne: 5.83%
Creighton: 47.5%
Oregon: 16.8%
Finally, and most importantly, my numbers (8 and 2) hit in the Utah State-TCU game in NCAA sqaures. So worst case scenario, I only lose half my square buy-in. Lettttttt’s gooooooooooooo.
Cheers.
My completely uninformed guide to March Madness and some thoughts on my kaggle entry
I submitted my March Madness Machine Learning Mania today. My two entries consist of picks made using the actual spread for first round games and then a simple Bradley-Terry model for the games past that. In my second bracket, which I called the “aggressive” one, I picks UConn in the men’s bracket and South Carolina in the women’s bracket to win each round (and thus the tournament) with probability 1. So is UConn and South Carolina win, maybe I have a shot at winning. I also manually adjusted two teams on the women’s side (South Carolina and USC). The problem with South Carolina is that they haven’t lost any games and Bradley-Terry basically can’t handle that. I adjusted their regression coefficients to match the market price that they win the tournament. I also adjusted USC on the women’s side because they were way off their market price too. I didn’t make any adjustments to the men’s side because the futures prices were generally in the ball park with what I was estimating (i.e. there are three truly top teams in the men’s bracket (Purdue, UConn, Houston), then a sizable gap down to the next team (which I think is Iowa State. North Carolina got a gift of a 1 seed.)
I’m really excited about the new scoring system for Kaggle this year. And I think they got the scoring system right. A few weeks ago I believe I read that the scoring system was going to be average bracket score with traditional bracket scoring (1-2-4-8-16-32). My first thought when I saw this was that the best strategy is to just enter one bracket and hope. I think other people figured this out and they change it to a Brier score metric. But what they really got right this year is that that don’t take the average over all the GAMES, they take the average over the 6 ROUNDS. This weights the game in the finals much more heavily than a game in the first round, much closer to traditional bracket games.
Anyway, here are some probabilities below are based on my 10000 brackets that I submitted:
To win the championship:
UConn – 29.3%
Houston – 20.9%
Purdue – 19.4%
Iowa St – 5.19%
North Carolina – 4.96%
Tennessee – 3.39%
Marquette – 2.49%
Auburn – 1.94%
Illinois – 1.51%
Baylor – 1.43%
Everyone else < 1%
To make the finals:
UConn – 45.5%
Houston – 34.8%
Purdue – 32.4%
North Carolina – 12.6%
Iowa St – 11.4%
Tennessee – 7..92%
Marquette – 6.51%
Auburn – 5.8%
Illinois – 4.54%
Baylor – 4.34%
Arizona – 3.16%
Alabama – 2.68%
South Carolina – 2.46%
Kansas – 2.31%
Kentucky – 2.13%
Creighton 2.03%
Everyone else < 2%
And finally, here are my pre-tournament rankings 1 through UMass:
| Rank | TeamName |
| 1 | Connecticut |
| 2 | Houston |
| 3 | Purdue |
| 4 | Iowa St |
| 5 | North Carolina |
| 6 | Tennessee |
| 7 | Auburn |
| 8 | Marquette |
| 9 | Illinois |
| 10 | South Carolina |
| 11 | Baylor |
| 12 | Kansas |
| 13 | Utah St |
| 14 | Creighton |
| 15 | Arizona |
| 16 | Duke |
| 17 | Nevada |
| 18 | Kentucky |
| 19 | Alabama |
| 20 | San Diego St |
| 21 | BYU |
| 22 | Florida |
| 23 | Texas Tech |
| 24 | New Mexico |
| 25 | Wisconsin |
| 26 | Gonzaga |
| 27 | Nebraska |
| 28 | Colorado St |
| 29 | Dayton |
| 30 | Clemson |
| 31 | Virginia |
| 32 | Mississippi St |
| 33 | Boise St |
| 34 | Texas |
| 35 | St Mary’s CA |
| 36 | TCU |
| 37 | Drake |
| 38 | Oklahoma |
| 39 | Grand Canyon |
| 40 | Northwestern |
| 41 | Colorado |
| 42 | Texas A&M |
| 43 | Washington St |
| 44 | Indiana St |
| 45 | Pittsburgh |
| 46 | NC State |
| 47 | FL Atlantic |
| 48 | Syracuse |
| 49 | Providence |
| 50 | Michigan St |
| 51 | Oregon |
| 52 | St John’s |
| 53 | James Madison |
| 54 | Seton Hall |
| 55 | Mississippi |
| 56 | Kansas St |
| 57 | Ohio St |
| 58 | Indiana |
| 59 | Princeton |
| 60 | Wake Forest |
| 61 | Cincinnati |
| 62 | Iowa |
| 63 | Butler |
| 64 | Virginia Tech |
| 65 | Villanova |
| 66 | Samford |
| 67 | Richmond |
| 68 | Duquesne |
| 69 | McNeese St |
| 70 | Utah |
| 71 | Memphis |
| 72 | Loyola-Chicago |
| 73 | South Florida |
| 74 | UNLV |
| 75 | Florida St |
| 76 | Boston College |
| 77 | Xavier |
| 78 | UCF |
| 79 | LSU |
| 80 | Georgia |
| 81 | VCU |
| 82 | Minnesota |
| 83 | UAB |
| 84 | Washington |
| 85 | Bradley |
| 86 | San Francisco |
| 87 | Appalachian St |
| 88 | Arkansas |
| 89 | Rutgers |
| 90 | Cornell |
| 91 | Vermont |
| 92 | Miami FL |
| 93 | Col Charleston |
| 94 | Maryland |
| 95 | Penn St |
| 96 | Georgia Tech |
| 97 | St Joseph’s PA |
| 98 | Yale |
| 99 | USC |
| 100 | UC Irvine |
| 101 | St Bonaventure |
| 102 | Santa Clara |
| 103 | George Mason |
| 104 | Massachusetts |
NCAA basketball squares
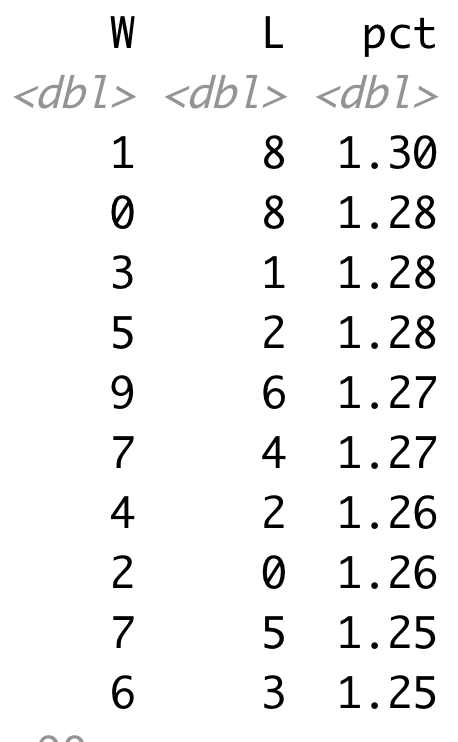
We all know about Super Bowl squares. But last night my friend asked me to be in an NCAA squares pool. I asked him how it worked and he explained to me that it’s the same as a Super Bowl pool, but you have the same numbers for all 63 games (not the stupid F-ing play-in games). So naturally, I wanted to know what the best numbers were. Here are the results based n data from 1985 – 2021, which is just the data that I happened find on my computer first.
The worst set of numbers are the ones that are the same. Since it’s based on only final score, the only way these numbers will hit if a team wins by exactly 10, 20, 30, etc. Also, note that in the pct column, if all squares were equally likely, the pct should be exactly 1% for every square. So even in the worst case (i.e. 1-1), the percentage isn’t that far off from what you would expect if each square was equally likely.
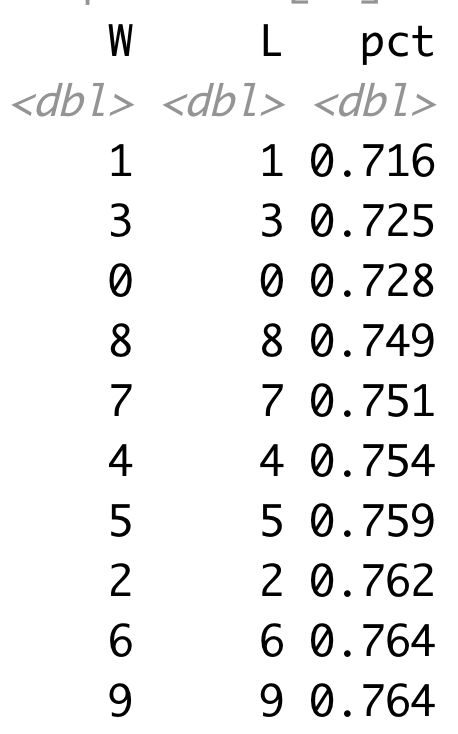
The best numbers are combinations that are all 2 or 3 digits away with 1-8, 0-8, 3-1, 5-2 and 9-6 being the top five all with probabilities that are essentially the same.
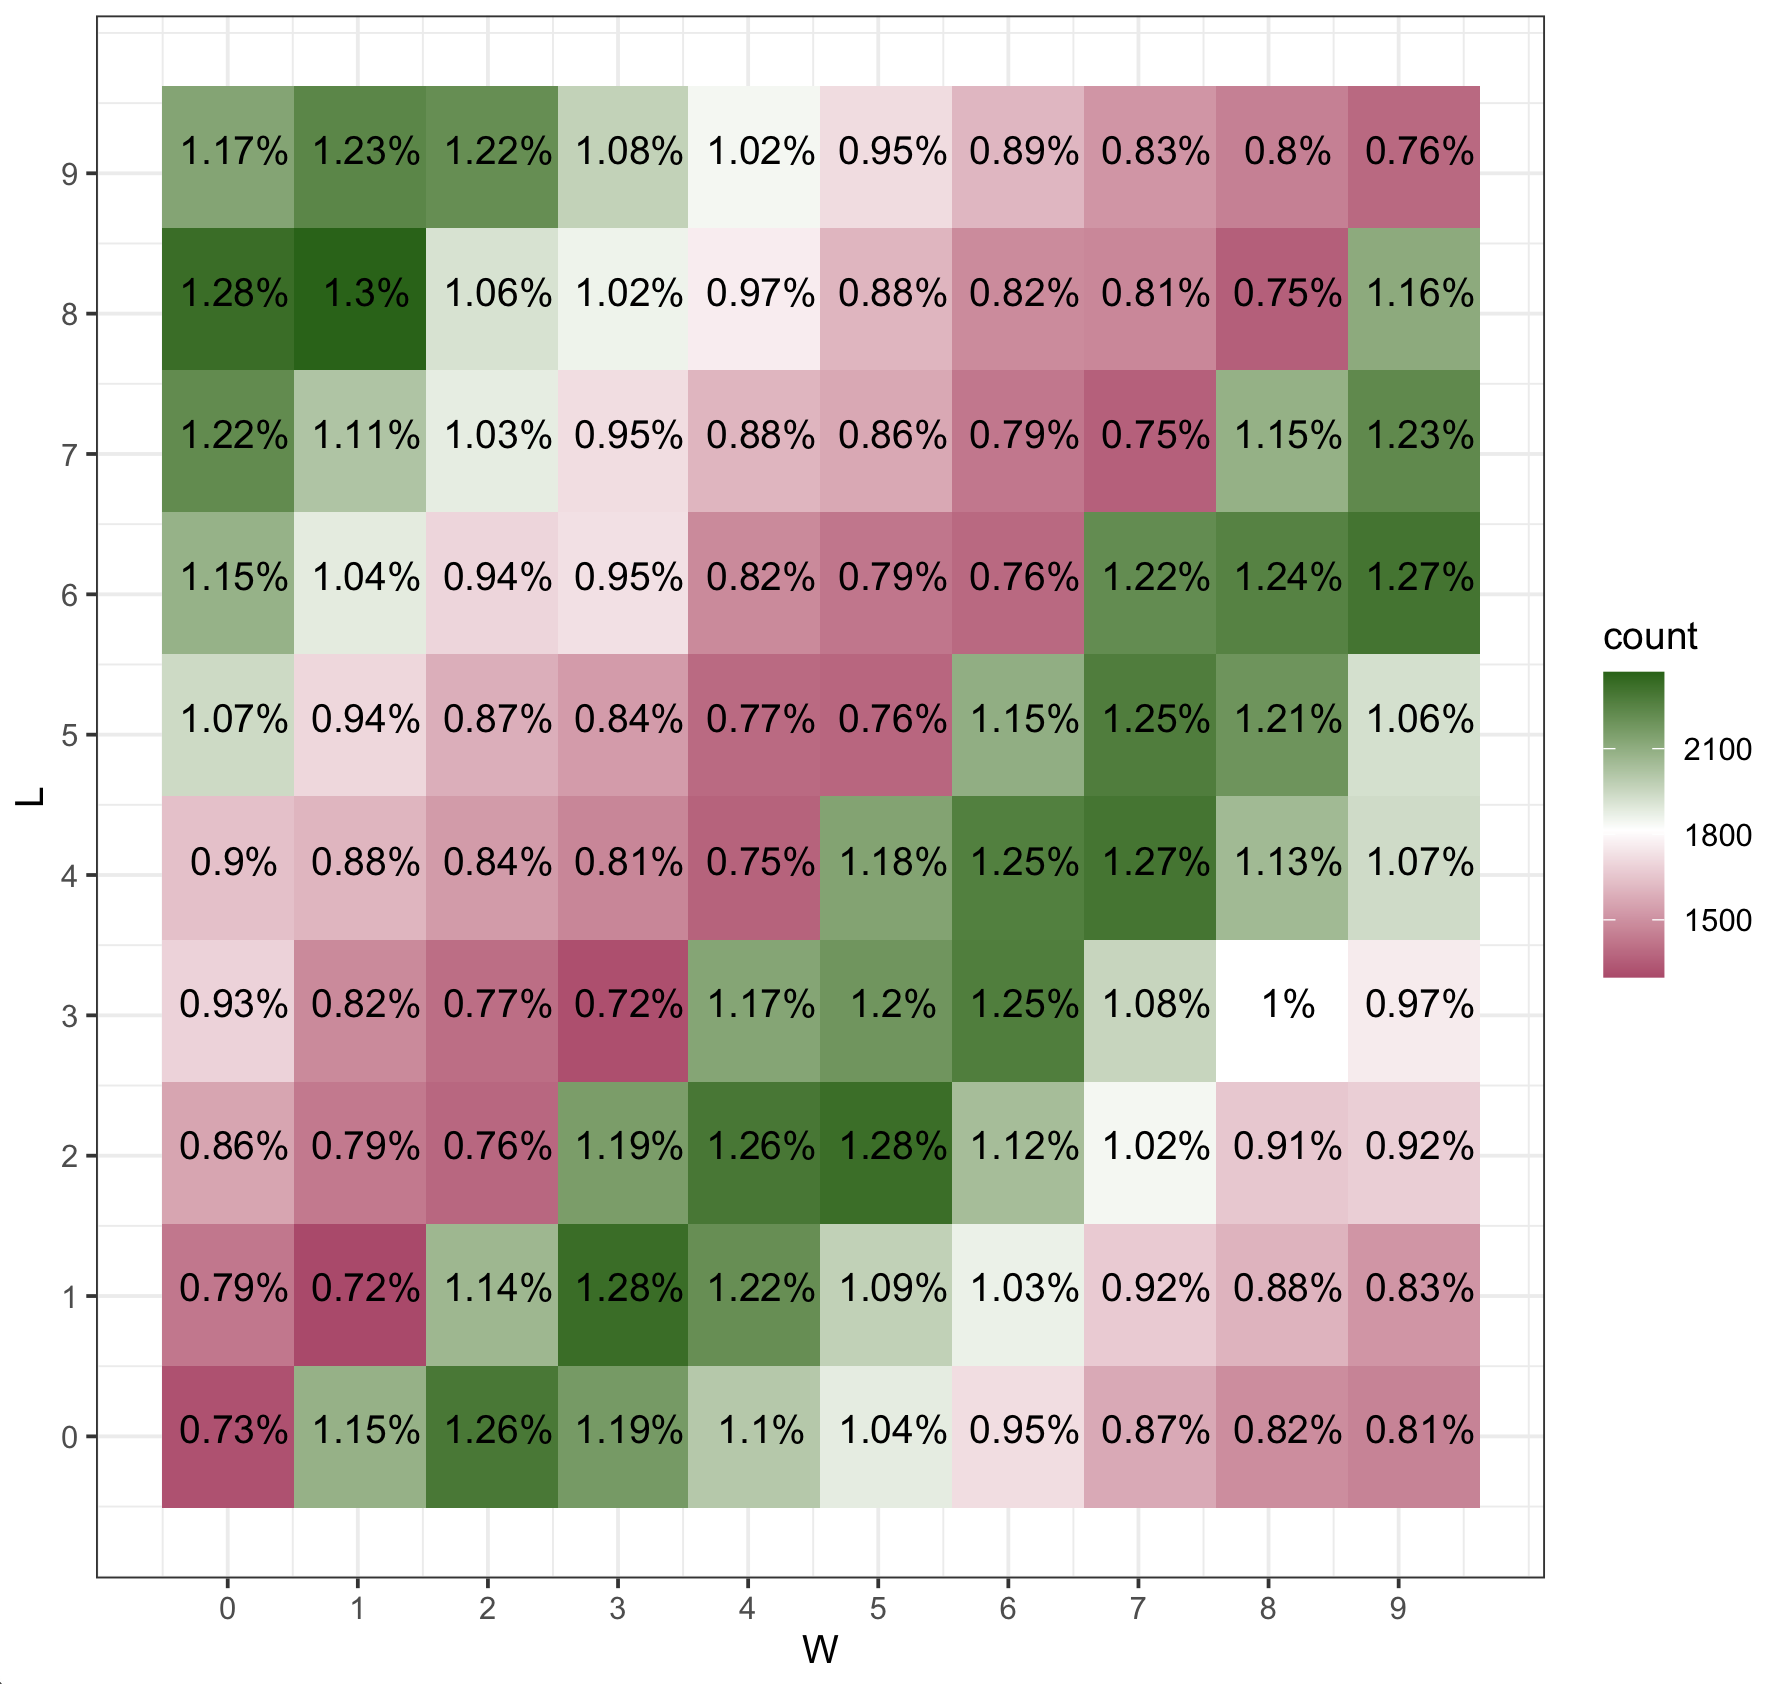
To better see the pattern, I made a 2d histogram for all the scores. Here, red, white, and green indicate combinations that are worse, about the same, and better than 1%. You can see the dark green band running up the diagonal of combinations that are 2 and 3 apart.
And just for comparison sake, here is the same plot with NFL scores:
Happy gambling in March!
Cheers.
STRAIN and Editors Choice Collection
My article “Here Comes the STRAIN: Analyzing Defensive Pass Rush in American Football with Player Tracking Data” with Quang Nguyen and Ron Yurko was selected for inclusion in the AMSTAT News Editor’s Choice Collection. This means you can read the full article for free (Note: You can always read any of my articles for free. If you just contact me, I’ll send you a free copy. Never ever ever pay the publisher fort access to my work, please).
While glancing through the list there were a few articles that I am particulars interested in reading:
- “The Twentieth-Century Reversal: How Did the Republican States Switch to the Democrats and Vice Versa?” by Andrew Gelman. I’m SO SICK of hearing people talk about how the GOP is the “Party of Lincoln”. Yeah, that’s technically true, but that entirely ignores history. I can’t wait to read this article.
- “Integrating Data Science Ethics into an Undergraduate Major: A Case Study” by Benjamin S. Baumer, Randi L. Garcia, Albert Y. Kim, Katherine M. Kinnaird, and Miles Q. Ott. This author list is a who’s who of people I turn to when I am developing my courses. Baumer’s book (with Kaplan and Horton) is the foundation for our undergraduate Introduction to Data Science with R (DSCI101) course and our graduate version Introduction to Data Science (with R and Python) (DSCI401) course.
- “Changes in Crime Rates During the COVID-19 Pandemic” by Mikaela Meyer, Ahmed Hassafy, Gina Lewis, Prasun Shrestha, Amelia M. Haviland.
Cheers.
Covid-19 and myocarditis
“People on the internet” (i’m talking about the anti-vax morons) scream about how myocarditis is a side effect of the vaccine, but big pharma doesn’t want you to know about. Chief, it’s literally listed on the CDC website.

And if you are that worried about myocarditis, you know what causes myocarditis at much higher rates: Actual Covid-19!
Cheers.
The thing about multiple hypothesis testing that has always bothered me
Here is what’s always bothered me about multiple hypothesis testing.
Let’s say there are 10 hypothesis tests and they come back and 3 of them are significant at the 0.05 level. However, after correcting for multiple test using, for simplicity, a Bonferroni correction, none of these tests are significant. (Assume that it doesn’t matter what method you use to correct, but after correction you find nothing significant). So when an individual researcher does these tests together, they have to report that they found nothing significant.
Now let’s say that 10 different researchers do one of these ten tests each, and they get the exact same p-values. Now 3 of these researchers will get “significant” results because they are only doing one test. So three of these researchers publish their results.
It’s the same exact set of tests with the same exact p-values. But if a single researcher does it, there is nothing significant. And if they did report something significant they would be accused of p-hacking (and rightly so). But if 10 different independent researchers each do one of the tests, they will come up with 3 out of the 10 tests as significant. Same data. Same results. Same p-values. Different conclusions based on who performed the test. Weird, right?
Cheers.
Brotherly Shove for the other 31 teams
The “Tush Push” in Philadelphia is called the “Brotherly Shove”. Here are the names I’ve come up with for the other 31 teams. I have no idea for a bunch of these. Please offer suggestions.
- Patriots: The Revolutionary Score
- Jets: The Jet Pack
- Bills: The Queen Careen (SNF just called this the “Buffalo Bobsled”. Mine is better.)
- Dolphins: The Flipper Ripper
- Steelers: Rust Thrust
- Bengals: Tiger Pile
- Ravens: Charm Offensive
- Browns: The Dog Pound
- Texans:
- Jaguars:
- Titans:
- Colts: The Colt Jolt
- Chiefs:
- Broncos: The Pile High
- Chargers: The Hectic Electric
- Raiders: The Silver and Black Stack
- Cowboys: The Plow Ploy
- Commanders:
- Eagles: Brotherly Shove
- Giants: The Big Grapple
- Bears:
- Packers: Cheese Squeeze
- Vikings: The Skol Stroll
- Lions: The Roar for One More
- Saints: The Big Easy First Down
- Falcons: Peach Reach
- Panthers: The Carolina Creeper
- Buccaneers: The Buc Tuck
- Rams: Ram Cram
- Seahawks:
- 49ers: The Gold Rush
- Cardinals: The Card Yard
As a math professor, I dislike the NFL tie breaker rules
Let’s say there are three generic teams A, B, and C, and I ask you which team is better: A or B. And let’s say you rank them:
- A
- B
Great.
Now let’s say I ask you to rank A, B, and C. The only three reasonable rankings are:
- C
- A
- B
OR
- A
- C
- B
OR
- A
- B
- C
Why? Because you already told me that A was better than B head to head, so why would the addition of team C in the rankings switch the order of A and B. This condition is called Independence of Irrelevant Actors (I’ve written about violations of this in Olympic Sport Climbing).
So how is this related to the NFL tiebreakers? Consider this case:
Going into week 18 this year (2023-24 season), if the Jaguars and Steelers both lost their week 18 games (The Steelers have already won, so this is moot) they would both be 9-8. So which of these two teams gets into the playoffs? The answer is that it depends on the result of the Broncos vs Raiders gamefeaturing two teams that are both eliminated from the playoffs! This meant that there was the possibility that the Broncos vs Raiders was a de facto playoff game…….for the Jaguars vs Steelers with the Broncos representing the Steelers and the Raiders representing the Jaguars!
How is this possible? In two way ties, the NFL tie breaker is based on head to head results, and the Jaguars beat the Steelers on October 29 so the Jaguars are better than the Steelers head to head. And if the Raiders beat the Broncos, both those teams would finish 8-9 and the Jaguars and Steelers would be in a two way tie. If the Broncos won, that would put the Broncos at 8-9 and in a three way tie with the Steelers and Jaguars. In a three (or more) way tie, you apply the tie breakers and eliminate the bottom teams repeating the procedures starting at step 1 after each elimination. And in the three way tie, the Jaguars are eliminated first based on on strength of victory (all three teams would have been 6-6 in conference play). With the Jaguars eliminated, the Steelers best Denver based on head to head tie breakers.
What this means is that we have the following rankings of teams with 8-9 records:
- Jaguars
- Steelers
AND
- Steelers
- Broncos
- Jaguars
(This actually COULD make sense if the Broncos win affected some tie breaking metric with the Jaguars, but that is not what is happening here).
I don’t like this. What I’d like to see (and no one cares what I think, but I’ll tell you anyway) is a tie breaking metric that doesn’t change based on how many teams are tied; the ordering should be consistent whether it’s two teams or ten teams. So, without thinking very much about it, here are some tie breaking procedures that I think would be better:
- Go straight to conference record. All teams will have the same number of conference games and the number of wins here will give the same ranking when comparing head to head or 3+ way ties.
- Give ties to the team with more road wins. This would have worked better in the 16 game schedule as all teams played 8 games each at home and away. Now with a 17 game schedule, you would have to do winning percentage in road games, but this isn’t that big of a deal. Again, this would give the same ranking in head to head ties or 3+ way ties. And this is similar to one way that chess breaks ties: if two or more players are tied, the player with the better record as black in the winner.
- You could just use strength of victory as a first step tie breaker. The only possible issue with this is that there could be situations where your strength of victory is affected by two teams already eliminated from the playoffs in such a way that you end up in the exact same situation that I describe here that I don’t like. So this wouldn’t be my first choice.
My major point here is this: There shouldn’t be separate head to head tie breaking procedures and 3+ way tie breaking procedures. This can lead to very strange situations like the one I describe here. This would also greatly simplify understanding of tie breakers for fans. Right now, the tie breaking procedure can get really complicated. So what I’m advocating for is that the NFL pick a few metrics and use those as the tie breaking procedure for everything. I should be able to write the NFL tie breaking procedure by using arrange and just specifying an ordered list of variables (like the EPL (though EPL now has head-to-head tie breaks but further down the list of tie breakers).
Cheers.
NFL Playoff Scenarios and fun with tree diagrams!
Five AFC teams have already clinched playoff spots: Ravens, Dolphins, Chiefs, Texans, and Browns. This means there are two playoff spots left in the AFC. With the Steelers and Texans winning yesterday, the AFC is now pretty simple and there are only two games today that matter in terms of playoff qualification: Dolphins vs Bill and Jaguars vs Titans. Below you can see a tree diagram of all the possible outcomes for the two remaining teams.
The NFC is….more complicated:

Five teams have already clinched playoff sports in the NFC: 49ers, Cowboys, Lions, Eagles, and Rams. This leaves two spots available for six teams. This means that five of the eight NFC games today have playoff qualification implication. The three games that don’t matter are the two NFC East games and the Rams vs 49ers. My particular favorite part of the NFC tree diagram is the Vikings playoff scenarios. All they need to do to make the playoffs is to beat the Lions and one of the following:
- Bears, Cardinals, and Falcons all win
- Bears, Cardinals, and Panthers win
This means that the Vikings are relying on four teams, all with losing records (7-9 Bears, the 4-12 Cardinals, the 2-14 Panthers, and the 7-9 Falcons), to all win today to make the playoffs. And also the Vikings have to beat the Lions. Skol!
Cheers.
