2020 Presidential Election as Field Goals
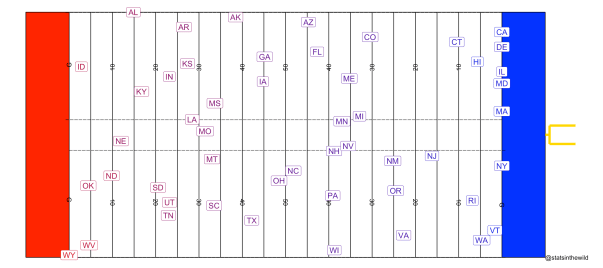
Yesterday I posted the probabilities of Biden winning each state in terms of a field goal distance. But I only did it for a few swing states, and I think this idea deserves more. So with the help of Mike Lopez’s post from last May, I put the field goal distances for each state on a football field. The distance in the plot is in terms of Biden winning the state and he is kicking towards the bottom of the plot into Trump’s end zone. The horizontal location of the state name is roughly alphabetical order with a few manual tweaks to make it look pretty. And the color of the state abbreviation is the projected vote share for that state.
So let’s look at an example of how to interpret this. Let’s take Ohio. According to fivethirtyeight, Biden has a 37.9% chance to win Ohio. The probability that an NFL kicker makes a 61.5 yard field goal is about 37.9% so Ohio is plotted just beyond the 50 yard line (51.5 yards + 10 for the end zone).

Here is the table of win probabilities and the corresponding field goal distances for each state.

Let’s hope Biden doesn’t double doink this election.
Code is available here.
UPDATE: Based on some suggestions that I have received from Ron Yurko.

Also, you can only post stuff related to politics on Thursdays?!?! That’s the strangest rule I have ever hear. 
UPDATE: Based on suggestions from @alargewop.

UPDATE: Based on final suggestion by Ron Yurko.
Posted on September 2, 2020, in Uncategorized. Bookmark the permalink. Leave a comment.

Leave a comment
Comments 0