Category Archives: Uncategorized
Silver wins Gold: Ranking the poll aggregators in the 2016 presidential election
It’s taken me a few days to write this because I’ve been basically unconscious for the last 3 days. To recap, Hillary Clinton, certainly a weak candidate, but also clearly the most qualified candidate to ever run for president, got hundred of thousands (and when it’s all said and done likely millions) more votes than Donald J. Trump, a racist, sexist, xenophobe, who doesn’t understand the Constitution, but the latter will be the president because we choose presidents based on a system that was created in a time when England had a king, some people owned other people, and before scientific evidence of germs.
The silent majority isn’t a majority, it’s just an arbitrarily, geographically well located minority. I know this makes you want to scream into a pillow or punch a wall, but if you want to do something productive instead, here are some suggestions.
Anyway, the point of this post is to review the six poll aggregators that made numeric predictions for each state and were compiled on the New York Times The Upshot: New York Times (NYT), FiveThirtyEight (538), Huffington Post (HuffPost), PredictWise (PW), Princeton Election Consortium (PEC), and Daily Kos (DK) (The raw data can be found on my GitHub Page in the repo Statsinthewild).
Below is a sweet plot that I made comparing the predictions of these six aggregators. I’ve ordered the states from most red to most blue based on the average of the six predictions from November 5 three days before the election. Then for each state I plotted a boxplot for the distribution of the 6 predictions and overlaid the individual predictions on top. The colors of the boxplots are blue if the state (or district) went to Clinton and red if they went to Trump.
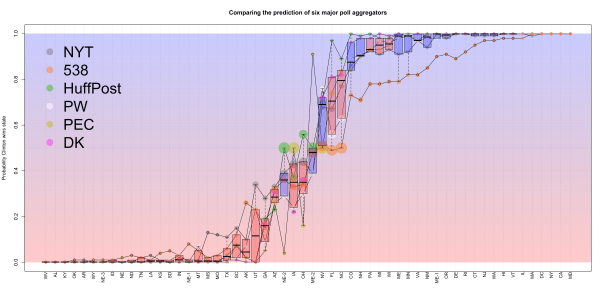
What immediately stands out for me on this plot is how much lower the Clinton win probabilities were for 538 compared to the other five sets of predictions for states starting and Nevada and moving right on the plot towards bluer states. Other notable outlying predictions include Huffington Post’s predictions for Florida and North Carolina, which were 97% and 89%, respectively. The New York Times had some outlying probabilities that were high for Clinton in states like Mississippi and Missouri as well as Utah and Georgia. FiveThirtyEight had many outlying probabilities for the “blue” states, but their most notable outlier for the red states was Alaska, which they gave Clinton a 26% chance of winning. The next highest probability for Clinton in Alaska was 10%.
So now let’s analyze who was the best. I’m going to do this in two ways: Brier Score and Logarithmic Loss. I computed results based only on the 50 states and Washington, D.C. ignoring the weird districts in Maine and Nebraska. Results are below:
| Average Rank | Poll Aggregator | Brier Score | Log Loss |
| 1 | FiveThirtyEight | 0.066 | 0.216 |
| 2 | PredictWise | 0.074 | 0.259 |
| 3.5 | New York Times | 0.088 | 0.281 |
| 3.5 | Princeton Election Consortium | 0.089 | 0.272 |
| 5 | Daily Kos | 0.091 | 0.402 |
| 6 | Huffington Post | 0.104 | 0.446 |
The worst of the poll aggregators was the Huffington Post. This looks to be because of their overconfidence in Clinton in several states that Trump won. For example they had Pennsylvania and Wisconsin at >99% and 98% for Clinton, both of which she lost. Daily Kos comes in 5th with a similar Brier score as Princeton Election Consortium and New York Times, but a much worse Log Loss. Log loss punishes you heavily for being over confident and wrong, and with predictions like Michigan and Wisconsin at >99% and 99%, respectively, the Daily Kos got crushed by Log Loss. New up we have Princeton Election Consortium and the New York Times who finished 3rd and 4th, respectively, using Brier score. However, they flip flop rankings when using Log Loss. Next up, and claiming the Silver medal is the market site PredictWise with a Brier score of 0.074 and a Log Loss of 0.259.
So who was the big “winner” of this Election? Nate Silver. A few days before the election I said that for him to look good in this election he needed it to be close or have Trump actually win. Well Trump won and he was the only person who really gave Trump any chance of winning. On top of that, his state by state predictions outperformed all of the other poll aggregators, and I’m crowning Nate Silver the champion of poll aggregators for the 2016 presidential election. What Silver did better than any of the other models was when a state was truly a toss up, his model reflected it. He had North Carolina, for instance, at 50% and Florida at 51% FOR the Republicans on November 5. The only other set of predictions to get close to those numbers was PredictWise, which had North Carolina at 63% and Florida at 53% for Democrats.
Finally, here is a plot of the six poll aggregators with their Log Loss score on the x-axis and their Brier score on the y-axis. Scores that are on the lower left are best and scores on the upper right are the worst. 
P.S. Here is a list of articles critical of Nate Silver before the election from the Huffington Post, Fortune, Vox, the Washington Post, Huffington Post again, Mashable and Wired. Whoops.
Cheers.
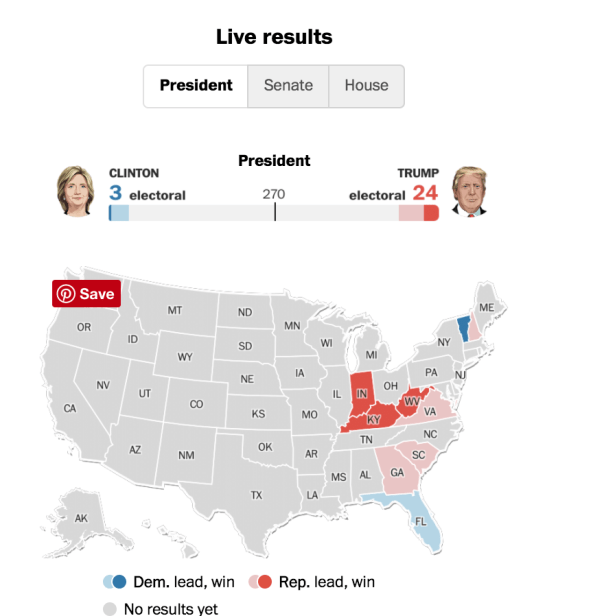
Election Live Blog
1:36AM CST: WOW. HOLY. SHIT.
9:34PM CST: We might not be able to call the winner of this election right now. But we can say for sure that Nate Silver is the winner.
9:33PM CST: I’m so scared right now I am physically shaking.
9PM CST: This is nauseating:
8:58PM CST: They’ve flattened out a bit now.

8:44PM CST: Everyone is panicking!
8:15PM CST: Pay No Attention to Who’s “In the Lead,” According to TV News. It’s Meaningless.
8:15PM CST: The market’s are collapsing on Hillary. Apparently people this all this early stuff coming in is meaningful. 
8:03PM CST: Trump is going to be “in the lead” for a while tonight. It’s just the nature of how this works. Basically nothing surprising has happened yet.
7:58PM CST: Oh boy. It’s gonna be a crazy night…..
7:55PM CST: Just arrived at my “Election Night Headquarters”. I’m here the rest of the night.
7:11PM CST: Ohio is getting interesting: 
7:08PM CST: Clinton now has MA, CT, DC, NJ, DE, MD, and VT good for 44 EV. Trump has WV, KY, IN, OK good for 33 EV.
7:06PM CST:

6:38PM CST: How important is Florida? If Clinton loses Nevada, New Hampshire, Ohio, North Carolina, AND Pennsylvania, she still wins. 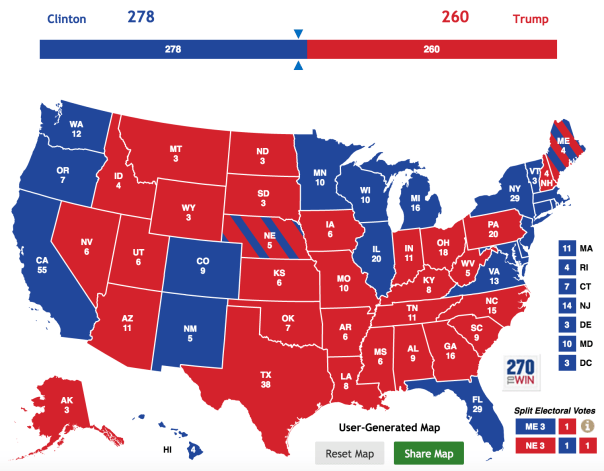
6:34PM CST: Even though nothing unexpected is happening here, it’s still terrifying to look at. No matter how close Trump gets to winning tonight, it was too close.
6:30PM CST: Trump still way ahead in New Hampshire…….with 61 votes counted……….
6:30PM CST: I’ll be tracking the @predictit markets over the course of the evening. 
6:15PM CST: State by state probabilities from The UpShot that I will be using to rate forecasters: http://bit.ly/2fQYYrc
6:13PM CST: Clinton wins Vermont; Trump wins Indiana and Kentucky. Nothing interesting has happened yet.
We should expect the NY Times and 538 to incorrectly predict 4.25 and 6.02 states, respectively.
In 2008, Nate Silver got 49 out of 50 states correct and in 2012 he got 50 out of 50 states correct and it basically cemented his status as the go to authority for election forecasting. However, I thought Silver was too conservative in his probabilities in 2012. In that post, I used FiveThirtyEight’s state by state predicted probabilities to simulate how many states Silver was expected to get wrong. There I showed a very simple simulation showing that we should have expected Silver to get 2 or 3 states wrong, but we actually observed him getting 0 wrong.
This is essentially a hypothesis test where our null hypothesis is that the vector of state win probabilities is 100% true. We can then simulate the election based on those probabilities and count how many state a forecast got incorrect in each simulation. For example, say some forecast projected Clinton to win Pennsylvania with probability 0.75. We could them simulate from a binomial distribution win n=1 and p=0.75; if we draw a 1 that forecast got it correct and if we draw a 0 the forecast missed (This forecast is predicting Clinton to win Pennsylvania since 0.75 > 0.5). We then simulate all of the other states in this same way and count how many state were incorrectly forecast. This number is stored and then the whole process is repeated a large number of times. This gives us a distribution of the number of states that we expect each forecast to miss ASSUMING that their state win probabilities are perfectly true. Once the election happens we can see how many states each forecast predicted incorrectly and compare it to the distribution assuming their probabilities were perfectly true. If the actual, observed number of misses is right in the middle of their distribution of misses, there is no evidence that their probabilities were wrong. However, if we expected a forecast to get 5 or 6 states wrong and they actually get 0 or we expect a forecast to get 0 wrong but they actually get 5 or 6, then we can say that there is strong evidence that their state win probabilities were probably not correct.
So, this year I’m going to repeat my experiment from 2012 with the six different election forecasts: NY Times (NYT), FiveThirtyEight (538) , Huffington Post (HuffPost), PredictWise (PQ), Princeton Election Consortium (PEC), and Daily Kos (DK). (State by state probabilities are collected from the New York Times The Upshot.)
The data that I collected is available in .csv format on my github page here and the code I used for the simulation is here (that code also contains my evaluation code using log loss and Brier score for tomorrow night). Note: That code is kind of a mess because I’m rushing to get everything done before the election.
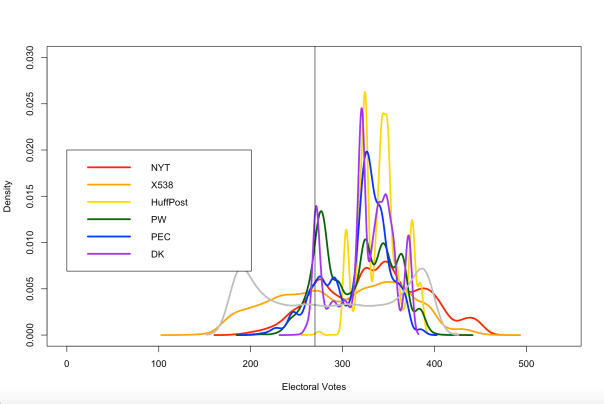
So anyway, I simulated each of the six election forecasts 5000 times each and their distributions are below. The big note I need to make here is that I simulated all of these assuming independence between state outcomes, which is definitely not true, but I’m going to make that assumption for now. By making this assumption I am underestimating the variance of these distributions, but the expected value of the distributions are not affect. The six simulated distributions are below.
 You can see that most of these are similar to each other but the NYT and 538 stand out as being different. HuffPost, PW, PEC, and DK all have an expected number of states missed below 3 with 1.88, 2.91, 2.56, and 1.89, respectively. The expected number of misses for NYT is 4.25 and for 538 it is 6.02. What this means for 538, for instance, is that based on the state win probabilities they are putting forth, if those probabilities were 100% correct and we ran this election in a parallel universes thousands of times, on average, the 538 model would miss over 6 states and the NYT would miss more than 4 states. Also, the farther away what we actually observe (the true number of states missed) is from this expectation, the more evidence it is against the probabilities being true. So 538 and the NYT should be expected to miss a few states. In fact, if they don’t miss any states, that is evidence that they did a bad job with their probabilities.
Assuming the independence assumption is reasonable (it’s definitely not, but it’s makes things simpler), the probability that the NYT or 538 gets every state correct happened 30 and 5 times out of my 5000 simulations. HuffPost and DK are both at around an 11% chance and PW and PEC are at 3.42% and 4.52%, respectively.
I again think this puts Nate Silver in a tough position to look good. He’s basically predicting that he will miss, on average, about 6 states. If he actually gets everything correct, his state probabilities were likely off by a bit. Further, if he does get all of the states correct, that will be around 320 electoral votes for Clinton, which is right in the range where everyone else is predicting, but they are doing so with much less uncertainty. So what Nate Silver needs to look good now is a close Hillary victory where he gets at least a few states wrong, from a mathematically perspective, of course. The public isn’t going to be as enthralled by the headline “Nate Silver gets 44 states correct, but was probabilistically more accurate than everyone else”. All the public will read is “Nate Silver missed 6 states”.
From a public perception standpoint, I think it’s basically impossible for Silver to come away from this looking good, which I think is unfortunate because he has done so many good things for data journalism and he almost single handedly made statistics cool (Thanks for that, by the way!). This is such a tough spot for Silver, who is far and away the most high profile forecaster out there, because the media (and he himself by doing good work) has set the bar so high for him that missing 6 states, which is what is implied by his state win probabilities, would be disastrous to the perception of nearly perfect prediction. On the other hand, if he does miss 6 states, I’ll be writing a blog post tomorrow about how Silver really nailed it from a probability standpoint and the other forecasters were way over confident. And no one will really care because all they will see is that he missed 6 states.
Finally, as I finished writing this I came across this article: Who Will Be America’s Next Top Modeler? I have a plan to figure out which poll aggregator is the most accurate. Will Nate Silver and his cohort play along? It’s an article for Slate by Jordan Ellenberg where he lays out how he’s going to crown America’s top modeler. I can’t wait.
Cheers.
Nate Silver needs this election to be close. (Or have Trump win).
So yesterday I tweeted out that Nate Silver was going to look pretty bad (whether that is fair or not is a different question) if this election is a blow out because that basically means that he got two-thirds of the big predictions (Dem Primary, Rep Primary (which he botched badly), and General Election) of this election. And this would go along with badly missing the British election in 2015 (the final result wasn’t even in their prediction intervals). So if he misses this election badly, it’s just one more high profile miss after basically getting everything right in 2008 and 2012.

And then someone responded to my tweet asking what’s with all the “Silver hate”? First off, I wasn’t hating on Silver in that tweet. I was merely trying to point out that his public image has a lot riding on this election. What I mean is most people only think about Nate Silver every four years (he’s like and Olympian; he’s doing stuff all the time, but most people only care every 4 years) during the general election, and if he get’s that right the general public believe that he is a genius because that is the story that the media will tell about him. Now, the average American is probably not following Silver’s other predictions very closely, but they look to him only during the general election. And if he get’s this wrong, the media will start looking back at his other predictions more closely and see that he has a pretty bad recent track record. In summary, no matter how bad Silver has been of late, if he get’s the general election correct the public will largely ignore the recent poor forecasts.
But there is apparently a bunch of Silver hate out there. Some pundits and politicians have always disliked Silver. This year’s the most high profile hate is coming from Ryan Grim, the Washington Bureau Chief for the Huffington Post. In his article, Grim contends that Silver in “unskewing the polls — all of them — in Trump’s direction”. Silver responded in a series of tweets. He did not seem happy about this criticism.
So why is there so much hate for Silver? My theory is that it’s in part jealousy. It’s objectively true that Silver is incredibly successful. When he was with the NY Times he was single handedly drawing huge amounts of traffic to the site. Most journalists aren’t doing this. So I think there are a lot of people out there who are rooting for Silver to fail and recently they’ve had a lot of stuff to work with in terms of not so great forecasts. But this General Election is really all that most people care about and Silver’s numbers are so much different than everyone else. So it’s easy for reporters who already aren’t huge Silver fans to start to pile on. I also think that journalists may dislike him (he didn’t fit in at the NY Times) because he essentially invaded their territory and almost immediately became more popular and drove more traffic than they did. So I think a lot of this kind of hate is jealousy.
And just as I think some journalist are annoyed that Silver came into their territory and took it over with ease, I think there is some annoyance (I wouldn’t say hate) among statisticians. My claim here among other statisticians in anecdotal, though I will admit that I myself have been annoyed by Silver. But in reflecting on that position, I now think that is stupid. I’m not really annoyed with Nate Silver; I’m annoyed with the general public’s REACTION to Nate Silver. Look Silver did a great job in 2008 getting 49 of 50 states correct and then in 2012 he got 50 out of 50. This was labeled a “Triumph of the Nerds” and he’s been called a “Math Wizard” and “Polling Data Guru“. What annoys me about this is that these elections weren’t that difficult to predict. Plenty of people got this election correct and while Silver was very good in 2012, he wasn’t the best (Note: I will be scoring the 6 prediction methods listed on the Upshot live on election night using log-loss and Brier score). But no one seemed to be talking about Drew Linzer and Wang and Ferguson. So I guess what really annoys me is that Silver is treated in the media like some singular talent that sees and predicts things that no one else on earth can predict, when in fact that’s just not true. I don’t blame Silver for this. In fact, I don’t know who to blame, but it annoys me. And some other people seem to feel similarly:
- Obama’s big win does not mean Nate Silver is a towering electoral genius.
- Nate Silver’s genius isn’t math. It’s journalism.
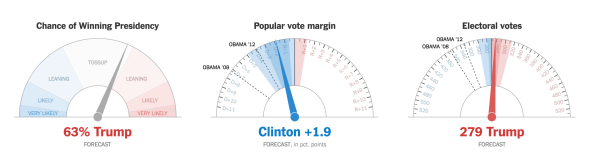
So all of this brings us to today: November 7, 2016. The day before election day. The general consensus is that Hillary Clinton is a big favorite to win this election tomorrow. Over at The Upshot, the New York Times, Silver’s former employer, is tracking a whole bunch of different prediction sources including their own predictions, FiveThirtyEight, Huffington Post, PredictWise, Princeton Election Consortium, Daily Kos, and a few others. Of the six sites that give a fully quantitative probability of a Clinton win, 5 of the 6 are over 80% and 2 of the 6 are over 90%. The only exception to this is FiveThirtyEight which currently has a Clinton win probability of 64%.

Some people think that Silver’s prediction is way off:
Nate Silver is unskewing polls — all of them. And he’s panicking the world. https://t.co/Ig471ixSK6
— Ryan Grim (@ryangrim) November 5, 2016
Silver was not happy (#understatement) about this article :
This article is so fucking idiotic and irresponsible. https://t.co/VNp02CvxlI
— Nate Silver (@NateSilver538) November 5, 2016
The article by Grim is short on technical details of WHY he thinks what Silver is doing is wrong. I’m sure there are technical criticisms that could be made about Silver’s methods (or anyone’s method), but Grim’s argument is simply that Silver is adjusting the polling results. I don’t have a problem with that in principle as long as it’s done well, and I have no real basis to judge whether it is being done well or poorly.
But it does seem that Silver is hedging his bets here. As Drew Magary says (emphasis added):
I tweeted about this yesterday, but I’m gonna put the take here because maybe you’re already freaking out about Tuesday and starting to drink heavily. Here’s the deal: Donald Trump is going to get his ass kicked. Anyone who says otherwise is either a) afraid of jinxing it and/or making Hillary Clinton voters complacent (understandable); b) afraid of being wrong (Nate Silver); c) supporting Trump; or d) interested in making this a “horse race” for the sake of maintaining public interest (most of the television media, along with grotesque shitbags like Mark Halperin).
I do think this is true. I think Silver is TERRIFIED of getting this election wrong. Otherwise we’ll be seeing more articles like this and this.
So what would be good for Silver? Let’s take a look.
I ran a simulation based on the state by state predictions posted on The Upshot using my correlation estimates where I simulated the election 50,000 times. Based on these simulations with my correlation estimate gives mostly similar overall win percentages as the Upshot has posted. I have:
- NY Times: 86.07%
- 538: 63.16%
- Huffington Post: 99.98%
- Predictwise: 88.5%
- Princeton Election Consortium (PEC): 88.54%
- Daily Kos: 99.01%
A few of these are notably different from what is posted. For instance, PEC is basically predicting that Clinton has a >99% chance of winning the election. My simulation only has them at 88.54%. This would be consistent with PEC either not accounting for state by state correlation or estimating less correlation between state than I am. Daily Kos is also notable in that they only have the probability of a Clinton win at 87%, but based on their state by state probabilities, the implied win probability is over 99%. I can’t explain this. The other four overall predictions essentially match with their implied state by state predicted win probabilities.
Next let’s take a look at the distributions of outcomes that are being implied by these state by state probabilities. Below are the density estimates of these 6 prediction. I’ve also added a rather naive projection for reference. The gray line is a model where I gave 15 states/districts to Clinton with certainty and 21 to Trump. The remaining 20 states/districts I made a coinflip.
The notable aspect of this plot that jumps out is the left tail of the 538 prediction. It’s way above the other 5 forecasts. Also, the New York times is allowing for, more so than other forecasts, for a very large Clinton victory (well over 400 EV!!!!!). So what is good for Silver? The only outcome that makes him look really good to the public at large is if Trump actually wins this election. If Clinton wins in a close race he’s also probably ok in the court of public opinion. But, if Clinton beats Trump and gets more than say 320 electoral votes basically everyone got that except Silver.
I’ve also added boxplots of the 6 major forecasts. Look how tight Huffington Post is!!! The IQR is 324 to 351 (Is that reasonable?) At the other end of the spectrum you have 538 whose IQR is 244 to 351, which is a rather large range. Silver’s median prediction is also much lower than the other 5 at 308. The other five forecasts have median predictions of 323, 325, 326, 336, and 342. S0 basically anything in the 320+ range and people are going to start asking why everyone else got it and Silver, who wouldn’t have “missed” if the Clinton total is 320, was off. So the ideal outcome for Nate Silver, who’s a Democrat, is a very close Clinton victory. That way he gets the candidate he prefers, and he looks good. (And America will still exist…..)

So what do I think will happen? I really like this map that @bennyjet34 posted to me on Twitter a few hours ago. This is essentially the consensus map based on all 6 forecasts.

But what fun is the consensus? Here is my final prediction:
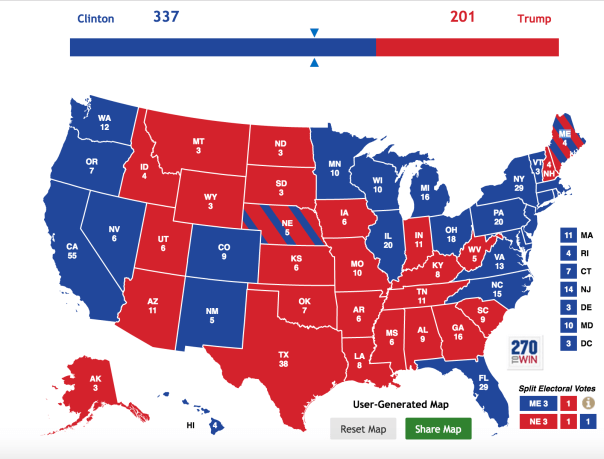
I think Clinton get’s Nevada based on the early turnout there and Trump gets New Hampshire (because NH is essentially the deep south….). I’m also going to predict that Clinton wins Ohio. I have no numeric argument for this, but I’ve got a feeling.
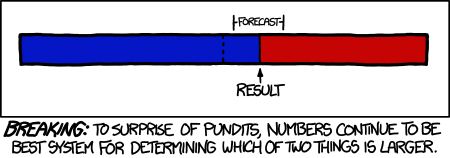
Finally, I leave you with this from xkcd:
Cheers.
NFL Picks – Week 9
Atlanta at Tampa Bay
Prediction: Falcons 24-23 (50.5%)
Pick: Buccaneers +3.5
Total: Under 51.5
Pittsburgh at Baltimore
Prediction: Ravens 22-21 (50.1%)
Pick: Steelers +2.5
Total: Under 43
Dallas at Cleveland
Prediction: Cowboys 24-22 (55.8%)
Pick: Browns +7.5
Total: Under 47
Indianapolis at Green Bay
Prediction: Packers 26-21 (64.3%)
Pick: Colts +7
Total: Under 54
Jacksonville at Kansas City
Prediction: Chiefs 25-18 (67.8%)
Pick: Jaguars +9
Total: Under 45.5
NY Jets at Miami
Prediction: Dolphins 21-20 (51.5%)
Pick: Jets +3.5
Total: Under 44
Detroit at Minnesota
Prediction: Vikings 22-20 (56.2%)
Pick: Lions +6.5
Total: Over 42
Philadelphia at NY Giants
Prediction: Giants 24-23 (53.0%)
Pick: Eagles +2.5
Total: Over 43.5
Denver at Oakland
Prediction: Broncos 23-20 (59.3%)
Pick: Denver EVEN
Total: Under 44
Tennessee at San Diego
Prediction: Chargers 24-20 (59.3%)
Pick: Titans +5.5
Total: Under 47
Buffalo at Seattle
Prediction: Seahawks 23-17 (65.5%)
Pick: Bills +7
Total: Under 44
New Orleans at San Francisco
Prediction: Saints 25-24 (52.2%)
Pick: 49ers +3.5
Total: Under 51.5
Carolina at Los Angeles
Prediction: Panthers 22-19 (58.5%)
Pick: Panthers -3 PUSH
Total: Under 45

What will the electoral map look like according to PredictIt markets?
Based on @predictit markets of each state right now (noon on November 5, 2016) Clinton has a 78.77% chance of winning assuming state vote outcomes are independent, which is not a reasonable assumption. Accounting for correlation between the states in their voting patterns and using the derived prices from the market, Clinton has a 66.98% chance to win the election. Below you can see how these probabilities have evolved over time since August and below that you can see a plot of the distribution of electoral votes for each candidate predicted by the markets based on different assumptions about the correlation between states.


Based on these distribution of electoral votes, let’s take a look at some electoral maps that this model is predicting are the most likely.
But first, let’s talk about correlation between states voting habits so that these maps will make a bit more sense when we look at them. As mentioned before, the assumption of independence between the states is not a reasonable assumption. Below is a corrplot of the percentages of Democratic vote for each state going back to the 1972 presidential election. You can see that states’ vote percentages are highly correlated with each other:

If we look only at swing states we get this: 
States like Arizona, Nevada, Colorado and New Hampshire are highly correlated with each other as are Florida and Ohio. Generally, as you get a higher percentage in Florida, you get a higher percentage in Ohio. Based on these correlation matrices, I thought it would be interesting to look at a principal component analysis of this correlation matrix. Below is the plot of the loadings for each of the 50 states. It appears that the first dimension is explained by blue vs red state where you have states like California, Vermont, and Connecticut to the far left and states like West Virginia, Kentucky, and Alaska on the far right. The second dimension is less clear to me, but I’m going to say that it has to do with regional differences. States that show up large on the second component are states like South Dakota, North Dakota, Montana, Utah, Idaho, Wyoming, Nebraska, and Alabama. Most of these states, with the exception of Alabama are sort of the northern red states. The other side of the second components contains states like Mississippi, South Carolina, Georgia, Florida, Virginia, Maryland, Tennessee, and Alaska. With the exception of Alaska, these are all southern mostly red states.

What all of this means is that the assumption of independence between states is very unreasonable and that winning one state like Florida makes it more likely to win a state like Ohio. So I’m going to look at the most likely maps based on my correlation model. (I should not that I’m not dealing with the nuances of Maine or Nebraska. I’m assuming whoever wins the states gets all the electoral votes, which isn’t the case.)
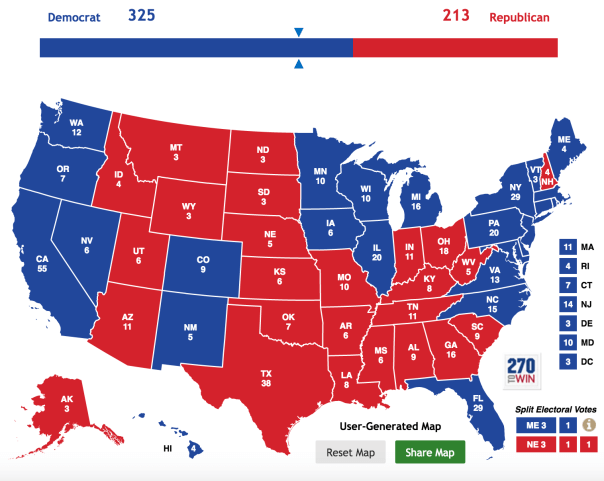
The most likely map according to the PredictIt markets and my model gives Clinton 358 electoral votes and has about a 7.13% chance of occurring. That map looks like this: 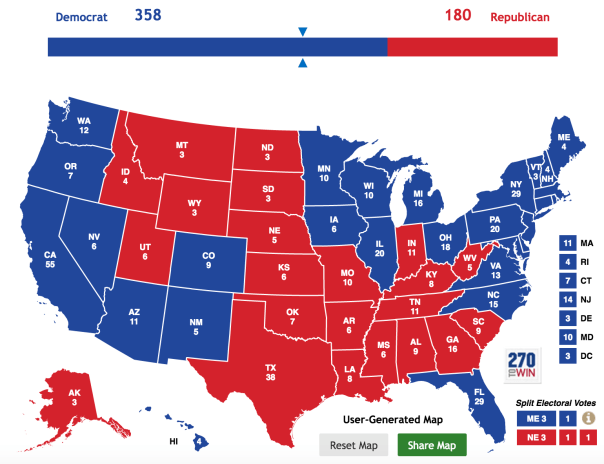
Now you might say, “Wait a second Greg, Trump is winning in Ohio.” And I would agree with that. However, Ohio is solidly in the category of swing state and is highly correlated with places like Pennsylvania and Florida which Clinton is winning and (probably) winning. Basically in a generic race (which this is not), a candidate who gets Pennsylvania and Florida will likely also get Ohio. Let’s keep going and look at a whole bunch of other plausible maps that my model predicts as the most likely.
This next map has about a 5.55% chance of happening. This map is the same as before, except that Clinton loses Arizona and Ohio and gets to 323 electoral votes.

The next most likely map gets Clinton to 352 electoral votes and has about a 3.16% chance of occurring. Here are two different ways for Clinton to get to 352 electoral votes with the second map being a bit more plausible:


After this you get a map with 279 electoral votes for Clinton which has about a 2.8% chance of occurring. In this scenario, Clinton loses Ohio, Florida, AND North Carolina and STILL WINS. This map is a really good illustration of how Trump can basically have a ton go right for him on election day and still lose this election.

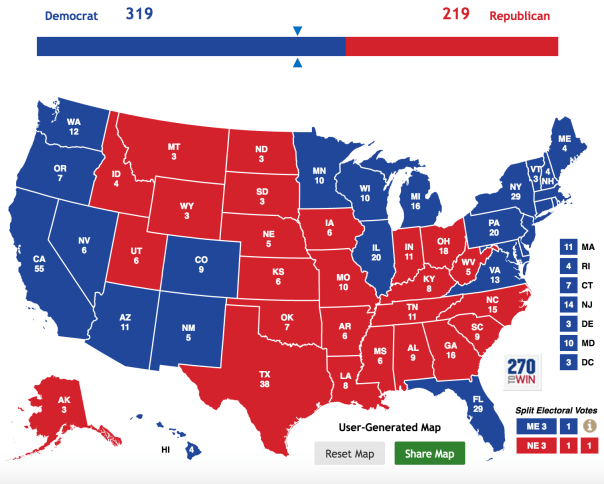
Next we have a map with 319 electoral votes for Clinton which has a 2.24% chance of occurring. That looks like this:
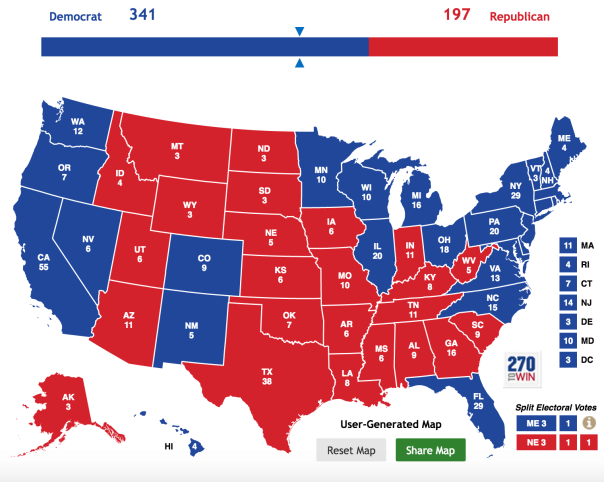
The next most plausible map at about 1.94% is with Clinton at 341 electoral votes. That would look like this:
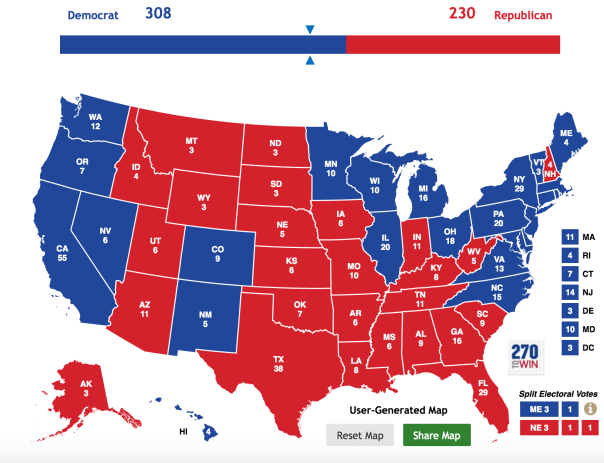
The next three most likely maps have Clinton at 308, 329, and 325 with a 1.86%, 1.56%, and 1.31% chance of occurring, respectively. Those maps look like this.

There is about a 27.6% chance that one of these vote totals hit according to my model and the PredictIt markets. The next most plausible map get’s Clinton to only 259 electoral votes and is the most likely path to a Trump victory. This map has about a 1.31% chance of occurring. In this scenario, Trump wins Ohio, Florida, North Carolina, AND Pennsylvania. This seems unlikely at this point, but it’s still a real possibility. That map looks like this:

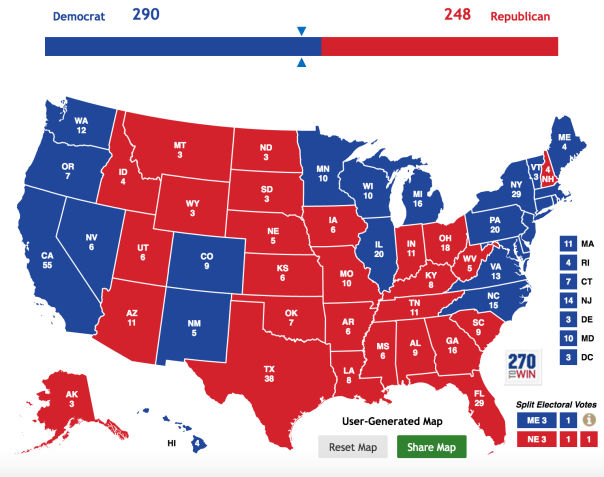
Let’s look at 3 more plausible maps. The next two most likely would look like this with Clinton getting 290 and 343 electoral votes, respectively.

The next most likely vote total has Clinton at 182, good for a Trump win, with about 1.19% chance of occurring. This map represents Trumps best chance at a blowout win where he wins Florida, North Carolina, Ohio, Virginia, Pennsylvania, New Hampshire, Wisconsin, Minnesota, Michigan, Nevada, Arizona, and, just for the sake of it, Maine, too. While this map does seem unlikely, if Trump does manage to win one of Michigan ,Wisconsin, or Minnesota, those states tend to vote similarly and he could end up winning or losing all of them together. That map would look like this:

So far we have looked at 14 of the most plausible electoral vote totals. If we add up these probabilities we see that there is about a 32.67% chance that one of these vote totals is correct.
To end this, I wanted to look at some totally implausible maps that still occurred in my simulations. I simulated the election 50,000 times and these maps occurred exactly once in the simulation:


Cheers.
NFL Rankings – Week 8
|
Playoff Probabilities – Week 8
|
NFL Picks – Week 8
Green Bay at Atlanta
Prediction: Packers 25-24 (54.3%)
Pick: Packers +3
Total: Under 52
New England at Buffalo
Prediction: Patriots 24-22 (55.0%)
Pick: Bills +6
Total: Under 47
Arizona at Carolina
Prediction: Panthers 23-21 (55.5%)
Pick: Cardinals +3
Total: Under 47.5
Minnesota at Chicago
Prediction: Vikings 21-20 (51.0%)
Pick: Bears +4.5
Total: Over 41
Washington at Cincinnati
Prediction: Bengals 25-20 (63.5%)
Pick: Bengals -3
Total: Under 49.5
NY Jets at Cleveland
Prediction: Jets 22-21 (54.1%)
Pick: Browns +3 PUSH
Total: Under 43.5
Philadelphia at Dallas
Prediction: Cowboys 24-22 (55.0%)
Pick: Eagles +5
Total: Over 43
San Diego at Denver
Prediction: Broncos 25-20 (64.6%)
Pick: Broncos -4.5
Total: Over 43.5
Detroit at Houston
Prediction: Texans 22-20 (56.0%)
Pick: Lions +2.5
Total: Under 46
Kansas City at Indianapolis
Prediction: Chiefs 23-22 (50.2%)
Pick: Colts +3
Total: Under 50
Seattle at New Orleans
Prediction: Seahawks 25-23 (56.5%)
Pick: Saints +2.5
Total: Over 48
Oakland at Tampa Bay
Prediction: Buccaneers 23-21 (55.2%)
Pick: Buccaneers EVEN
Total: Under 49
Jacksonville at Tennessee
Prediction: Titans 23-20 (57.8%)
Pick: Jaguars +3.5
Total: Under 44
Is it November 9 yet? Nope.
Below is a plot of the two major presidential candidates probability of winning over the course of time. Clinton has plummeted in the past few days thanks in part to, and you can’t make this up, the FBI investigating Mark Weiner. Clinton is still a heavy favorite to win the election, however. (In fact, I guarantee it). This plot is based on state electoral markets on predictit.org. 
Some of the state markets, however, I think are probably priced incorrectly. For instance, California isn’t at a dollar. We can all be sure that California is going Democrat. Likewise, Oklahoma isn’t going Democrat. There isn’t even a 3% chance of it. So I re-did the plot and left only toss up states with win probabilities that weren’t either 0 or 1. I gave Hawaii, Maryland, Vermont, California, Massachusetts, New York, Rhode Island, Delaware, Illinois, New Jersey, Connecticut, Oregon, Virginia, New Mexico, and Minnesota to Clinto with probability 1 and Nebraska, Wyoming, West Virginia, Oklahoma, Kentucky, Alabama, North Dakota, South Dakota, Arkansas, Kansas, Tennessee, Montana, Louisiana, Utah, Alaska, Mississippi, Texas, and South Carolina to Trump with probability 1 (though I think I’m being generous here). All other win probabilities were based on the state markets. That plot looks like this:

Clinton’s chances of winning are only improved by about half a percent by modeling the election this way. The plot based entirely on the state electoral markets looks like this: 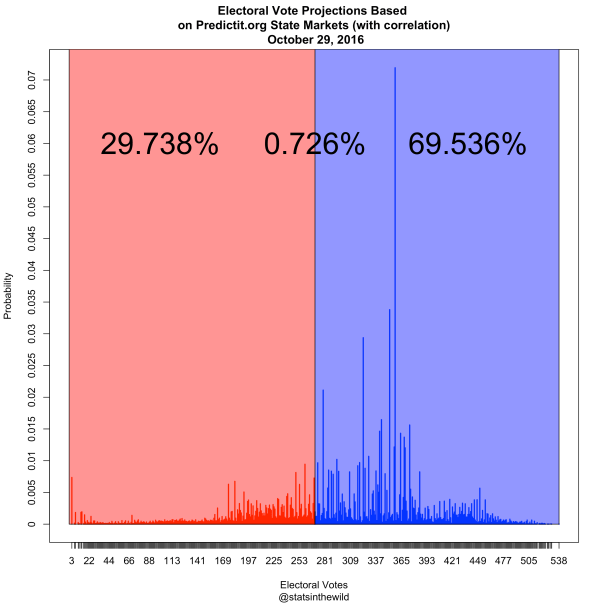
On a sort of unrelated note, it really is bizarre how we elect our president. There are like 3-5 states that actually matter and like 75% of people in those states have already made up their mind which party they will vote for before we even know who the candidates are. So the president is really elected by a small group of people from a small group of states to represent all Americans. Very bizarre.
Cheers.
