Category Archives: Uncategorized
An example of a statistically misleading MMR vaccine argument
I woke up this morning to a twitter comment about the “CDC Whistleblower Saga” from last year from one of my favorite twitter followers. This obviously led to a conversion explaining to me that: vaccines aren’t effective, the idea of herd immunity has been debunked, they are making kids sick, and they cause autism (Vaccines Don’t Cause Autism). I should note that none of these claims have any scientific backing to them. Other twitterers also told me that vaccines aren’t 100% effective (true; MMR is about 93% and 97% effective for 1 and 2 doses, respectively) and vaccines have side effects (also true, though side effects are rare). But also, not a logical argument against vaccination. I think we often forget (or in my case, never saw (thank you vaccines!)) how bad the measles really is (the measles are horrible).
And I know deep down, that no matter what I say, I’m not going to change someone’s mind on twitter. So why do I engage in “discussions” with people like this. I guess first, I can’t help myself. If someone engages me first, and they are wrong, I’m going to tell them that they are wrong. Though I’m not sure this is the best way to effectively deal with the anti-vaccine crowd (Here is how Jamelle Bouie of Slate suggests dealing with them), but I can’t help myself. I do try not to insult or attack people, but rather their arguments. But I find this difficult to do sometimes when I believe that these people are actively causing harm by trying to spread their anti-vaccines beliefs. (So if I insulted you today, I apologize to you. I should be better than that. But I still think your ideas are pseudo-scientific cray-ball wackadoo stuff).
But, secondly, I am absolutely fascinated that people think this way. It’s so foreign to how I think about the world. I know people who are espousing these beliefs actually believe them in spite of the mountains of evidence against their claims. To this end, The Atlantic wrote a really interesting article last fall about the psychology of anti-vaxers. It’s a fascinating read. And a bit sad with quotes like this:
Dr. Douglas Hulstedt, a pediatrician in Monetery, California, shares Smoot’s preference for personal stories over scientific evidence. Hulstedt accepts patients who are not vaccinated. He goes even further, and recommends refusing vaccinations if a patient has a family history of autism, lupus, Crohn’s disease, or Type 1 diabetes.
“Why do I need a medical study?” he says. “If 80 percent of the parents of children with regressive autism in my practice say their child reacted after the MMR [measles, mumps, and rubella] shot, why do I need a medical study?” Hulstedt says that studies showing no link between the MMR vaccine and autism or showing that vaccines are safe and effective might have “fraud in the reportage.”
This is a medical doctor posing the question: “Why do I need a medical study?”. That is absolutely appalling and evidence why I believe medical doctors need more statistical training before, during, and after medical school. Statistics is a complicated subject. Statistics is hard. I find it is constantly difficult, and I’m supposed to be the “expert”. But it’s just a difficult subject to tackle. Statistics is hard. But we need it as part of the scientific method to objectively answer medically important questions. Like do vaccine work (Yes).
But it’s so easy to make mistakes. As an illustration, let’s consider the plot below which shows measles deaths per 100,000 people over time. This was sent to me by my favorite twitter follower with the (sarcastic) text:
As you can see #MeaselsVaccine [sic] is instrumental in eradicating #Measels [sic]

They are arguing (I believe) that the death rate from measles was dropping for decades prior to the introduction of the measles vaccine, and the measles vaccine did little to lower the death rate of measles. So it follows that the measles vaccine isn’t as effective as science makes it out to be, therefore CONSPIRACY! #tinfoilhat #jadehelm
In all seriousness though, if you have no statistical knowledge, this might seem like a convincing argument. And I’m sure there are a lot of smart people (and not so smart people) who could be convinced by this plot. The problem with this is that this “analysis” is inherently trying to isolate the effect of vaccines on death rates without controlling for any other factors that are related to the death rate. Medicine advanced quite a bit from 1840 to 1940 and the probability of dying from measles dropped considerably. Even with no vaccines. But that’s all this plot is demonstrating. And it’s offering almost no evidence as to the effectiveness of the vaccine and is a case study in confounding.
I’d also argue the that graph is potentially misleading the viewer with scales. By the time the vaccine is introduced in that graph, the line is so close to 0/100,000 that it’s hard to see the relative effect of the vaccine. The death rate could have dropped 10% or 90% (It does drop some amount) and the viewer wouldn’t be able to tell . The graph would be much stronger if it was zoomed in on the years 1948 to 1978. But that doesn’t seem to be the narrative that is trying to be passed on with that graphic.

To really get a handle on the effectiveness of vaccines, we should be looking at cases of measles rather than the measles death rate. The graph below shows cases of measles in the US from 1954 through 2008. The first vaccine was introduced in 1963 and a second version was released in 1968. Notice the large and immediate drop from 1963 to 1969. It’s possible that there could be some huge confounding effect that explains this drop, but I think it would be difficult to present a reasonable confounding effect here that would dwarf the effect of the introduction of vaccines. The decline in measles cases was immediate and rapid. So are vaccines effective in reducing disease? Yes. Yes. Yes. Yes. Yes. and finally Yes.
Finally, I’ll close with this advice from the World Health Organization (WHO) an trying to persuade the anti-vaxxers:
How one addresses the anti-vaccine movement has been a problem since the time of Jenner. The best way in the long term is to refute wrong allegations at the earliest opportunity by providing scientifically valid data. This is easier said than done, because the adversary in this game plays according to rules that are not generally those of science. This issue will not be further addressed in this paper, which aims to show how vaccines are valuable to both individuals and societies, to present validated facts, and to help redress adverse perceptions. Without doubt, vaccines are among the most efficient tools for promoting individual and public health and deserve better press.8
You can (and should) read the whole paper here.
Cheers.
Will 2015 be the Beginning of the End for SAS and SPSS?
[Since this was originally published in 2013, I’ve collected new data that renders this article obsolete. You can always see the most recent data here. -Bob Muenchen]
Learning to use a data analysis tool well takes significant effort, so people tend to continue using the tool they learned in college for much of their careers. As a result, the software used by professors and their students is likely to predict what the next generation of analysts will use for years to come. I track this trend, and many others, in my article The Popularity of Data Analysis Software. In the latest update (4/13/2012) I forecast that, if current trends continued, the use of the R software would exceed that of SAS for scholarly applications in 2015. That was based on the data shown in Figure 7a, which I repeat here:
 Let’s take a more detailed look at what…
View original post 1,093 more words
Golfing with Dad
For the last nine years I’ve gone on a golfing trip to Vermont with my dad. After the first year we started a competition complete with plaque and names engraved for the champions. Here are the rules. We play 7 rounds over the course of 4 days and you take your lowest score on each hole from any of the rounds and fill out one score card. Whoever has the lowest “master card” wins. (Ties are broken by looking at who had the lower score on the highest handicapped hole, second highest handicapped hole, etc.)
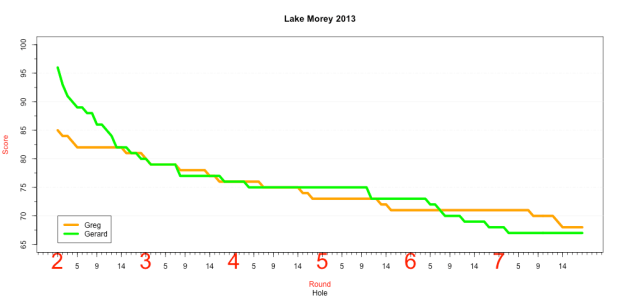
Currently, the series is 5-2 in favor of the dad. Here is a plot of what this competition looks like when I’m playing well. I’m the orange line and my dad is the green line. This is from 2013 when my father started off very, very slowly. Through 3 rounds we were tied, and then I took and held the lead at the end of the 4th round and held the lead through the middle of the 6th round when my dad went bonkers and made a bunch of birdies and picked up pars on holes he hadn’t gotten yet. So what does it look like when someone is getting crushed in this competition?
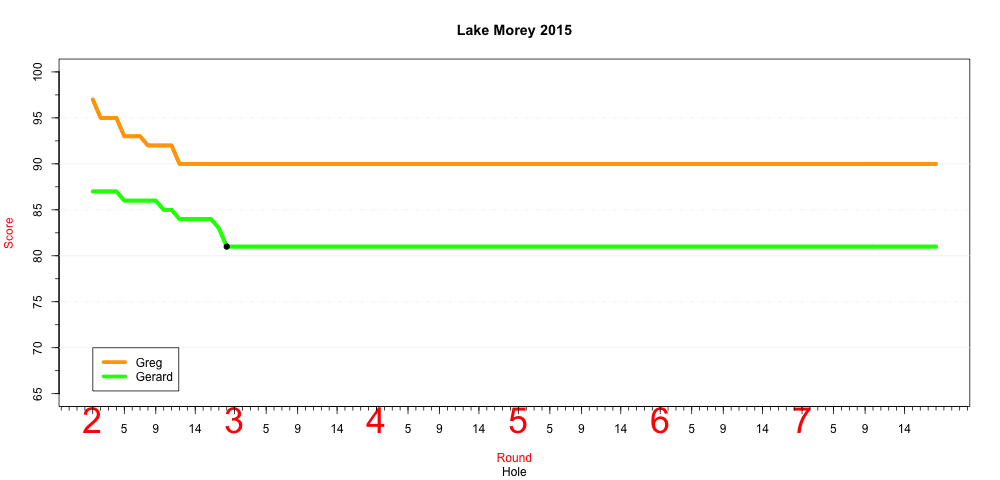
After two full rounds, my father is 10 full strokes ahead of me. It’s an absolute blow out through 2 rounds. That black dot is a birdie, which pops made on the 18th hole of the second round today. An early dagger. Though I have plenty of holes that are currently sitting at double bogey, so I should make up ground fairly quickly (hopefully, anyway). I’ll update this tomorrow after we’ve completed our rounds.
Cheers.
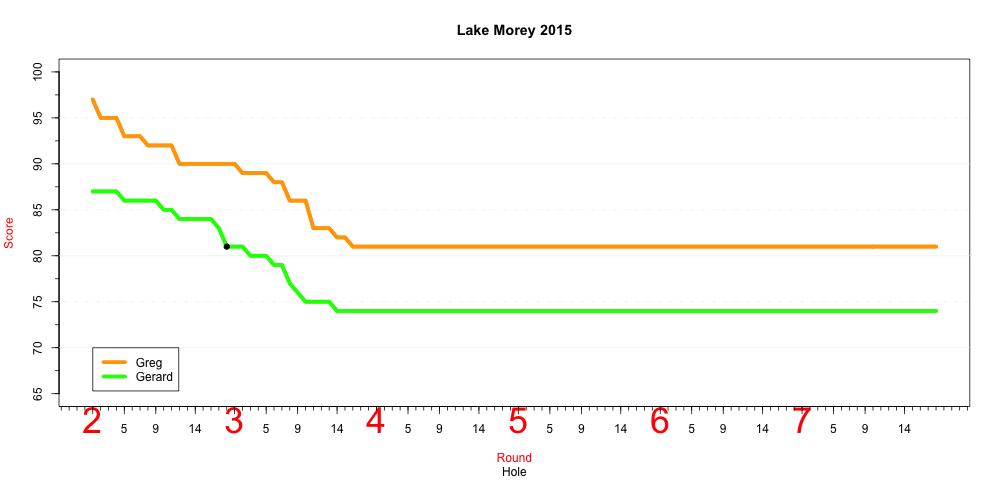
Update: Through three rounds: I’m down 75-81.
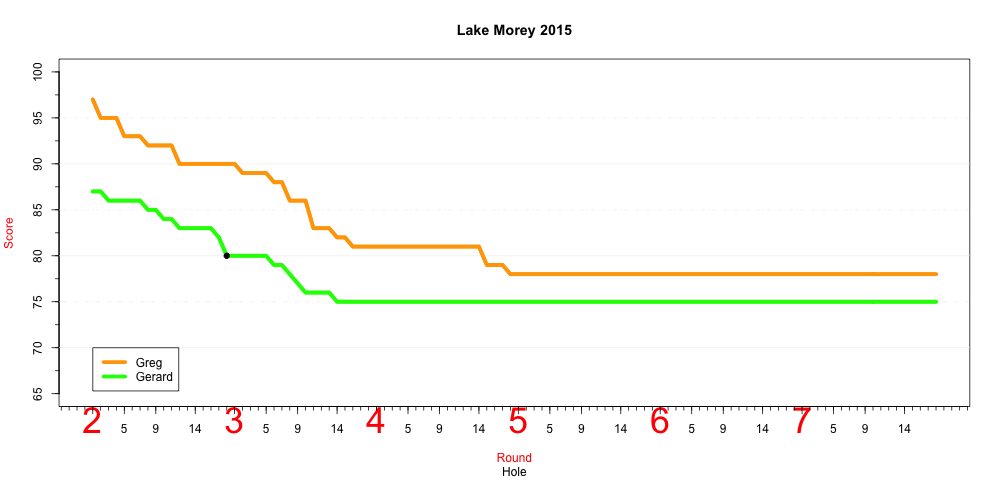
Update 2: Through 4 rounds I’m down 75-78 (and I do not have the tie breaker).
Pictures of my art show
Thanks to everyone who came to see the show! For those of you who missed it, I’ll be at Estate Ultra Bar at 1177 N Elston Ave on August 6th!


I play chicken with men on the street
Lately you’ve seen a string of articles about how women say sorry too much. We’ve got yesterday’s New York Times opinion piece entitled Why Women Apologize and Should Stop, we’ve got Amy Schumer’s amazing-as-always skit on accomplished women apologizing for everything including existing, and even academics are weighing in.
This is not my problem. I don’t apologize as an automatic response. I learned that early on, when I got my first teaching evaluation; I had apologized exactly once to my (all female) class about not being prepared, in a summer semester where I met with them daily for 10 weeks, and at the end of the summer they all mentioned that I came to class unprepared. I had never come unprepared a second time, nor had I ever mentioned being unprepared a second time. That experience cured me of apologies more generally.
But I remain curious about how men…
View original post 778 more words
Hannah and her sweets
Apparently students in the UK have been protesting against the following question on a GCSE math exam (see e. g. coverage at The Guardian):
There are n sweets in a bag. Six of the sweets are orange. The rest of the sweets are yellow. Hannah takes a random sweet from the bag. She eats the sweet. Hannah then takes at random another sweet from the bag. She eats the sweet. The probability that Hannah eats two orange sweets is 1/3. Show that n²-n-90=0.
The probability that the first sweet is orange is $latex 6/n$. Now there are five orange sweets left out of $latex n-1$, so the probability that the second sweet is orange, assuming that the first one is, is $latex 5/(n-1)$. Therefore we need to solve $latex (6/n) times (5/(n-1)) = 1/3$. Multiplying it out gives
$latex {30 over n(n-1)} = {1 over 3}$
and we can…
View original post 455 more words
The most mathematical flag: Nepal
Do you like geometrical constructions? Then you should like theflag of Nepal, which is the only non-rectangular flag of a nation, is actually defined bya Euclidean ruler and compass constructionin their constitution. See astep by step drawing of the constructionorthis video from Numberphile.
The flag of the state of Ohiois also non-rectangular, but sadly their laws only describe it as “burgee-shaped”. It might be possible to extract a construction fromthe picture in this brochure from the Ohio secretary of state, but it looks like many of the points are specified but their position in a larger rectangle. Ohio’s flag is analytic geometry; Nepal’s is synthetic.

An email from “Ted Wells, Esq.”
Here is an email I received from “Ted Wells, Esq.” (It’s not really from Ted Wells, and the only reason I want to make that clear is because I’m scared the all-powerful Roger Goodell will levy and arbitrarily harsh punishment.)
Dear Greg,
Please help me calculate a probability. I have been asked to investigate whether Tom Brady and the New England Patriots have conspired to break the rules by using under inflated footballs. This allegation was made by two different opponents in 2014 and has roots going back over 10 years according to AJ Feely, who allegedly played in the NFL. Some background data for the probability I need you to calculate: Based on data provided by Rotowire, Tom has handled 3399 snaps over the past 3 years, an average of almost 71 per game. If we extrapolate from this to his entire career of 238 games including playoffs, he has handled approximately 16,898 snaps during NFL games. And before every offensive snap the football is handled by a linesman, an NFL official, who places the ball on the line of scrimmage.
So here is what I need you to calculate: What is the probability that the Patriots have been using under inflated footballs for an extended period of time, perhaps over a decade, perhaps almost 17,000 offensive snaps, when there have been zero – ZERO – instances in which a game official who handles both team’s footballs over 140 times per game noticed that a Patriots ball might be too soft? I have also asked Warren Sharp to calculate this for me, but he currently is preoccupied trying to get a gob of peanut butter off the roof of his mouth.
Sincerely,
Ted Wells, Esq.
85% is a unicorn – on predictions in the National Hockey League postseason
Great unicorn picture

On February 20, the National Hockey League announced a partnership with software company SAP. The alliance’s primary purpose was to bring a new enhanced stats section to NHL.com, built in the shadows of popular analytics sites like war-on-ice and the now dormant extra-skater.
It was, it seemed, a partial admission from the league that it’s best metrics were hosted elsewhere.
“The stats landscape in the NHL is kind of all over the place,” suggested Chris Foster, Director of the NHL’s Digital Business Development, at the time. “One of the goals is to make sure that all of the tools that fans need are on NHL.com.”
One tool presented in February was SAP’s Matchup Analysis, designed to predict the league’s postseason play. The tool claimed 85% accuracy, which Yahoo’s Puck Daddy boasted was good enough to make “TV executives nervous and sports [bettors] rather happy.”
There’s just one problem.
85%…
View original post 779 more words
