Category Archives: Uncategorized
Great Spam Comment
My newest favorite spam comment:
But this other man, Jesus Christ, brought forgiveness to
a lot of through God’s bountiful gift. ‘ Whirlpool:
Poseidon summons a whirlpool at his ground target location that cripples targets, preventing movement abilities, and pulls
targets toward the center dealing magical damage every.
The contestant must choose the word that matches the definition.
Cheers.
Permutation tests in R
Permuation tests (also called randomization or re-randomization tests) have been around for a long time, but it took the advent of high-speed computers to make them practically available. They can be particularly useful when your data are sampled from unkown distributions, when sample sizes are small, or when outliers are present.
R has two powerful packages for permutation tests – the coin package and the lmPerm package. In this post, we will take a look at the later.
The lmPerm package provides permutation tests for linear models and is particularly easy to impliment. You can use it for all manner of ANOVA/ANCOVA designs, as well as simple, polynomial, and multiple regression. Simply use lmp() and aovp() where you would have used lm() and aov().
Example
Consider the following analysis of covariance senario. Seventy five pregnant mice are divided into four groups and each group receives a different drug dosage (0…
View original post 340 more words
Cleveland Odds to win Championship with Lebron James announcement
Check out this sweet graph from Todd W. Schneider.  Cheers.
Postscript: 538’s World Cup picks
While Nate Silver’s FiveThirtyEight website still has some work to do to meet its high expectations, the site gave the World Cup a pretty strong effort. This included in-depth features on important players, comparisons of numbers from this year’s tournament to past ones, and lots of work regarding the United States’ run into the knockout round.
Excluding the “Weekly round-up” posts, the site posted a pretty remarkable 88 World Cup articles in the past 35 days, or roughly 2.5 per day.
In any case, one of the most popular features of 538 over the past several weeks has been its game picks, in which Nate’s statistical model generates game outcome probabilities. For the group stage, this entailed three-way probabilities (allowing for the possibility of ties), and for the knockout stage, 538’s model gave a probability for each team advancing.
Given the model’s fascination with Brazil, and the home…
View original post 381 more words
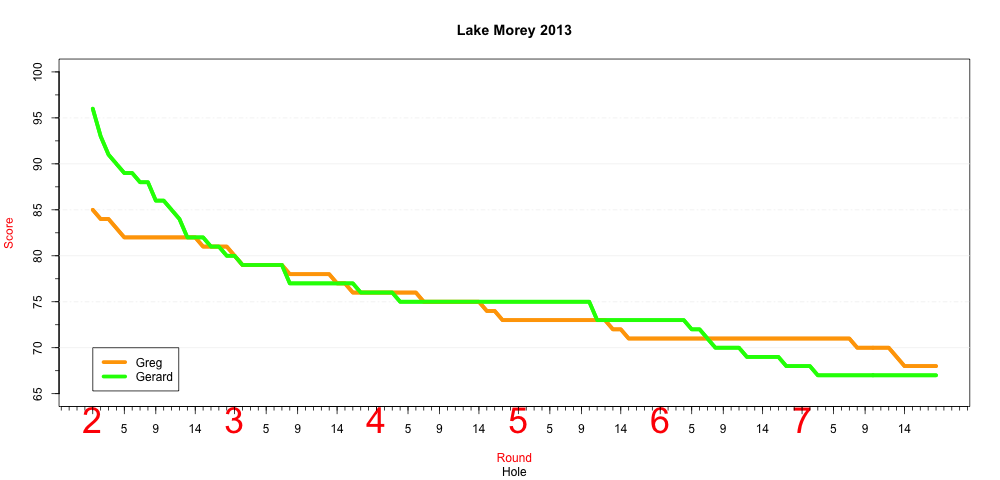
Golf with my old man
For the last 7 years I’ve been going to Vermont with my father to golf. For the last 5 we’ve had a contest where we take the lowest score on each hole from our 7 rounds to complete our “master card”. Below is a visualization of the contest last year. I made up a ton of ground in the last round, but to no avail.
 Cheers.
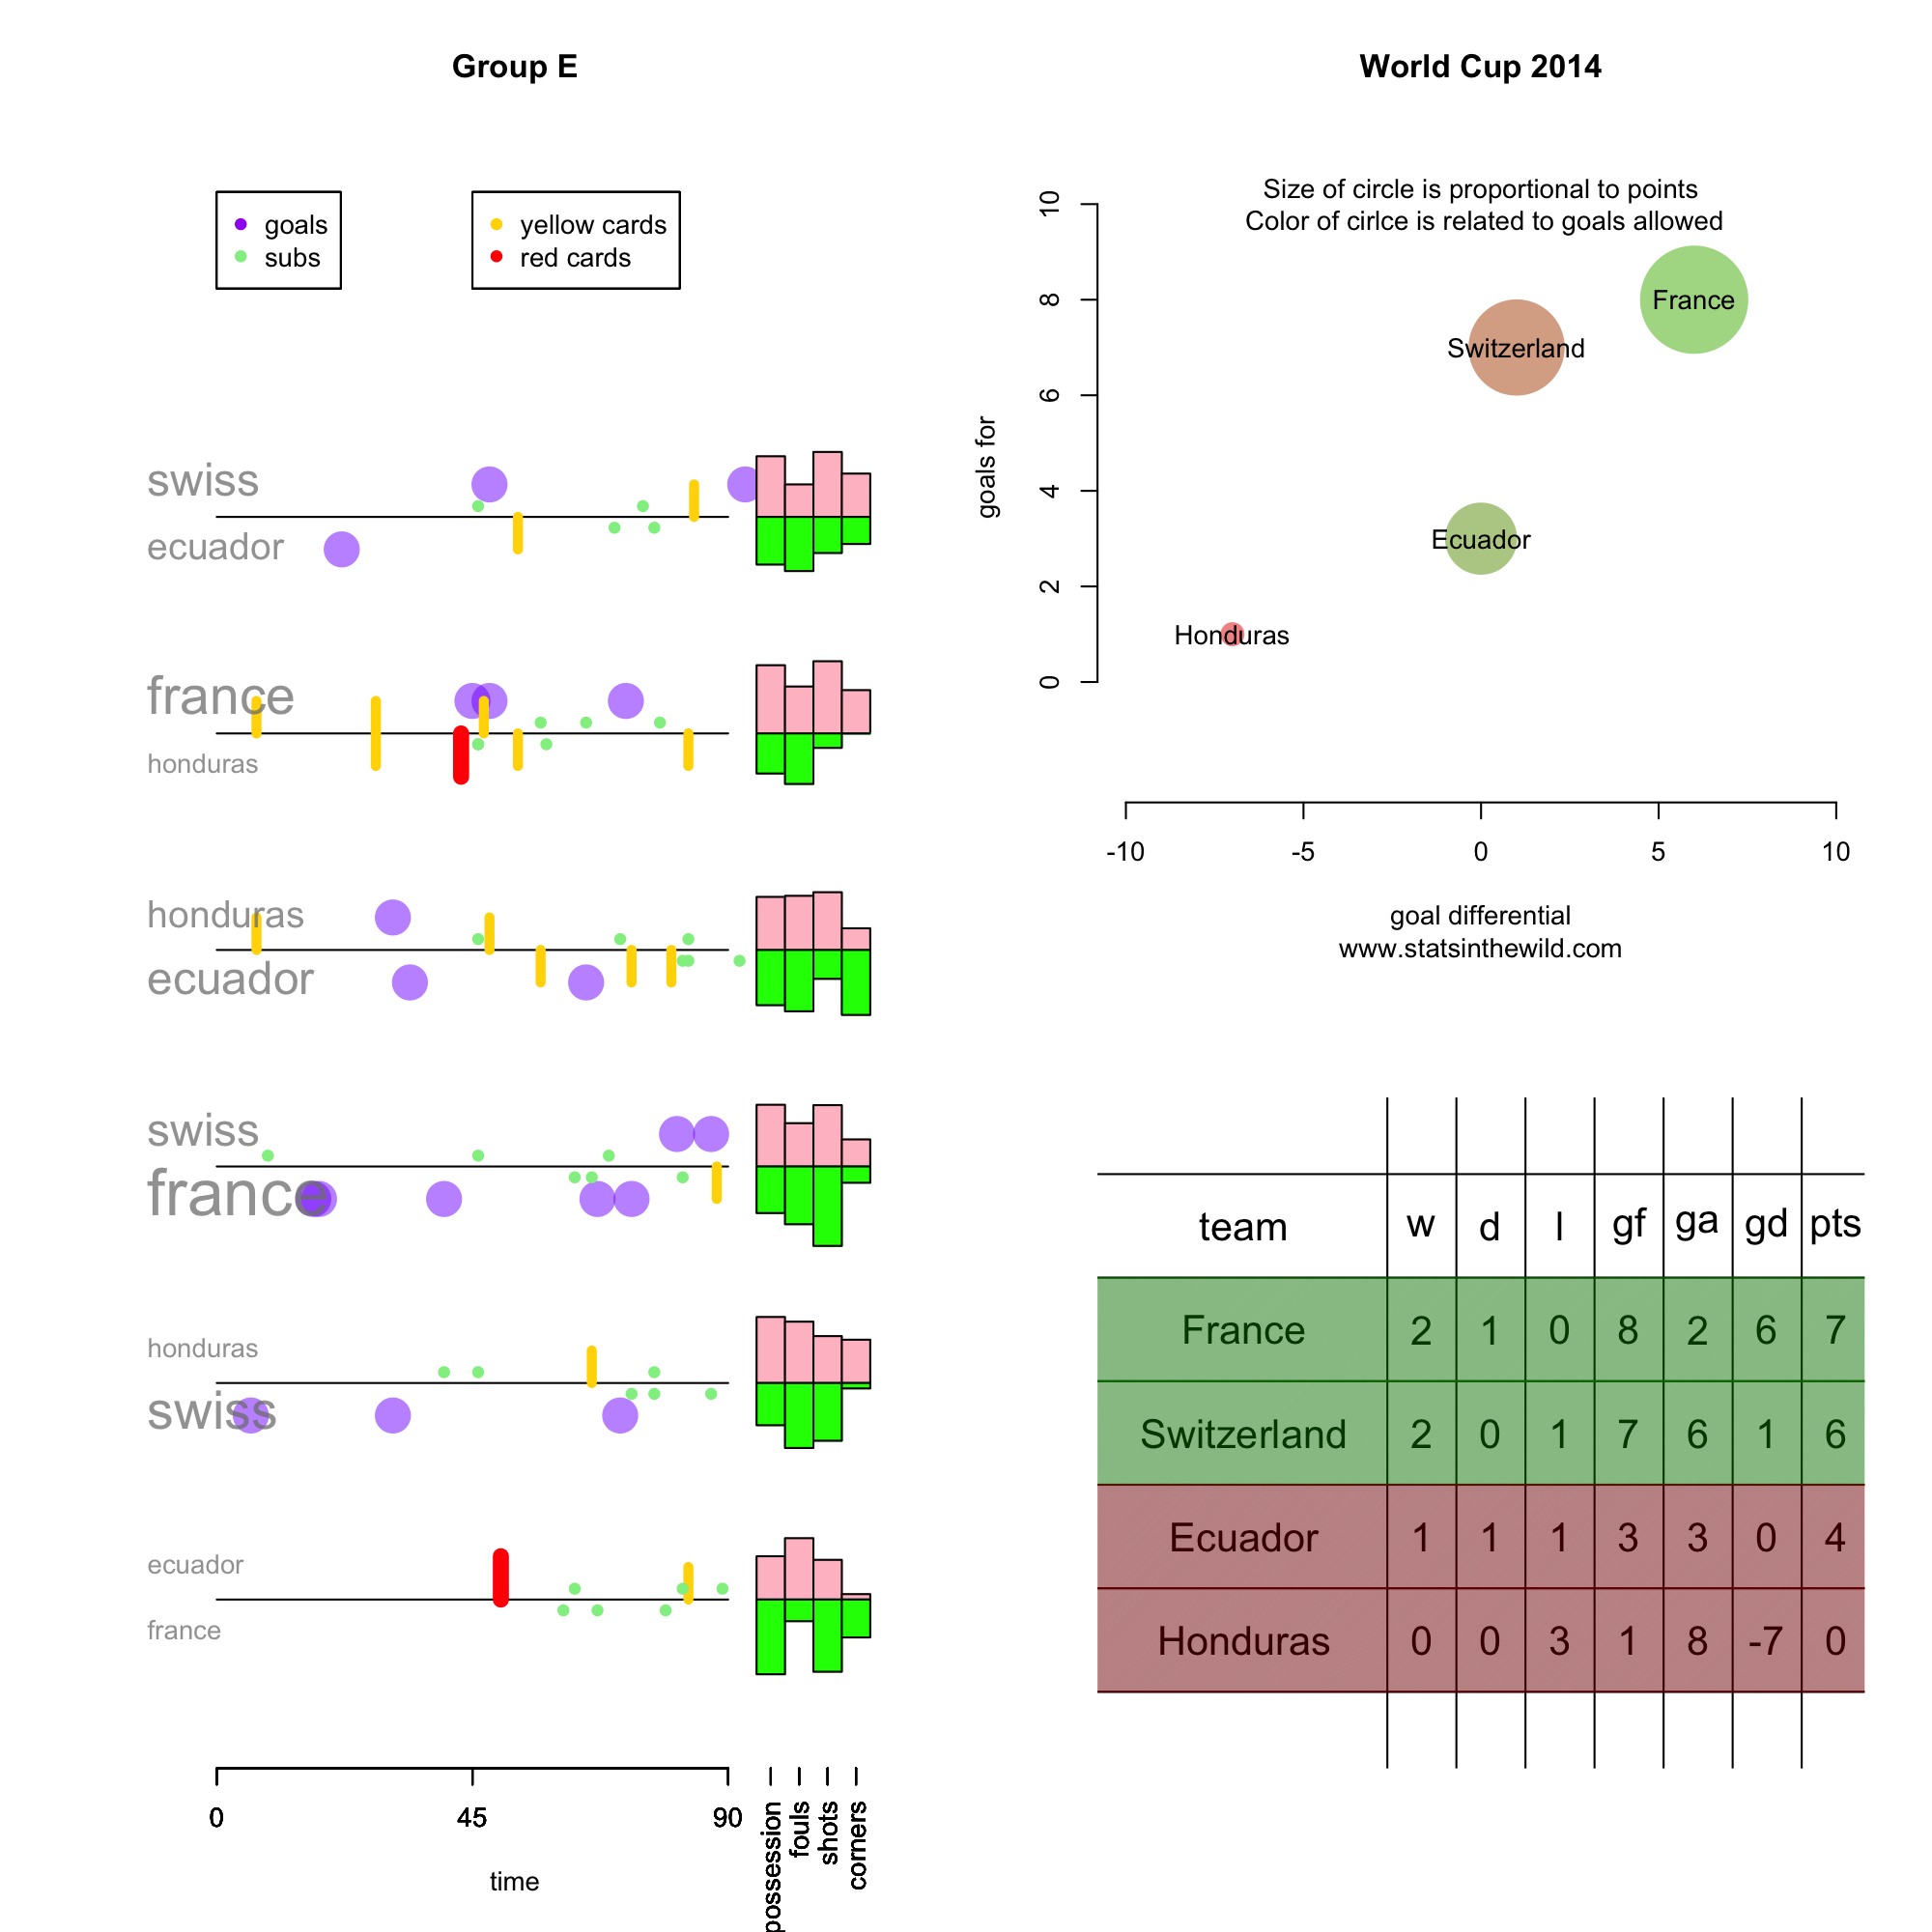
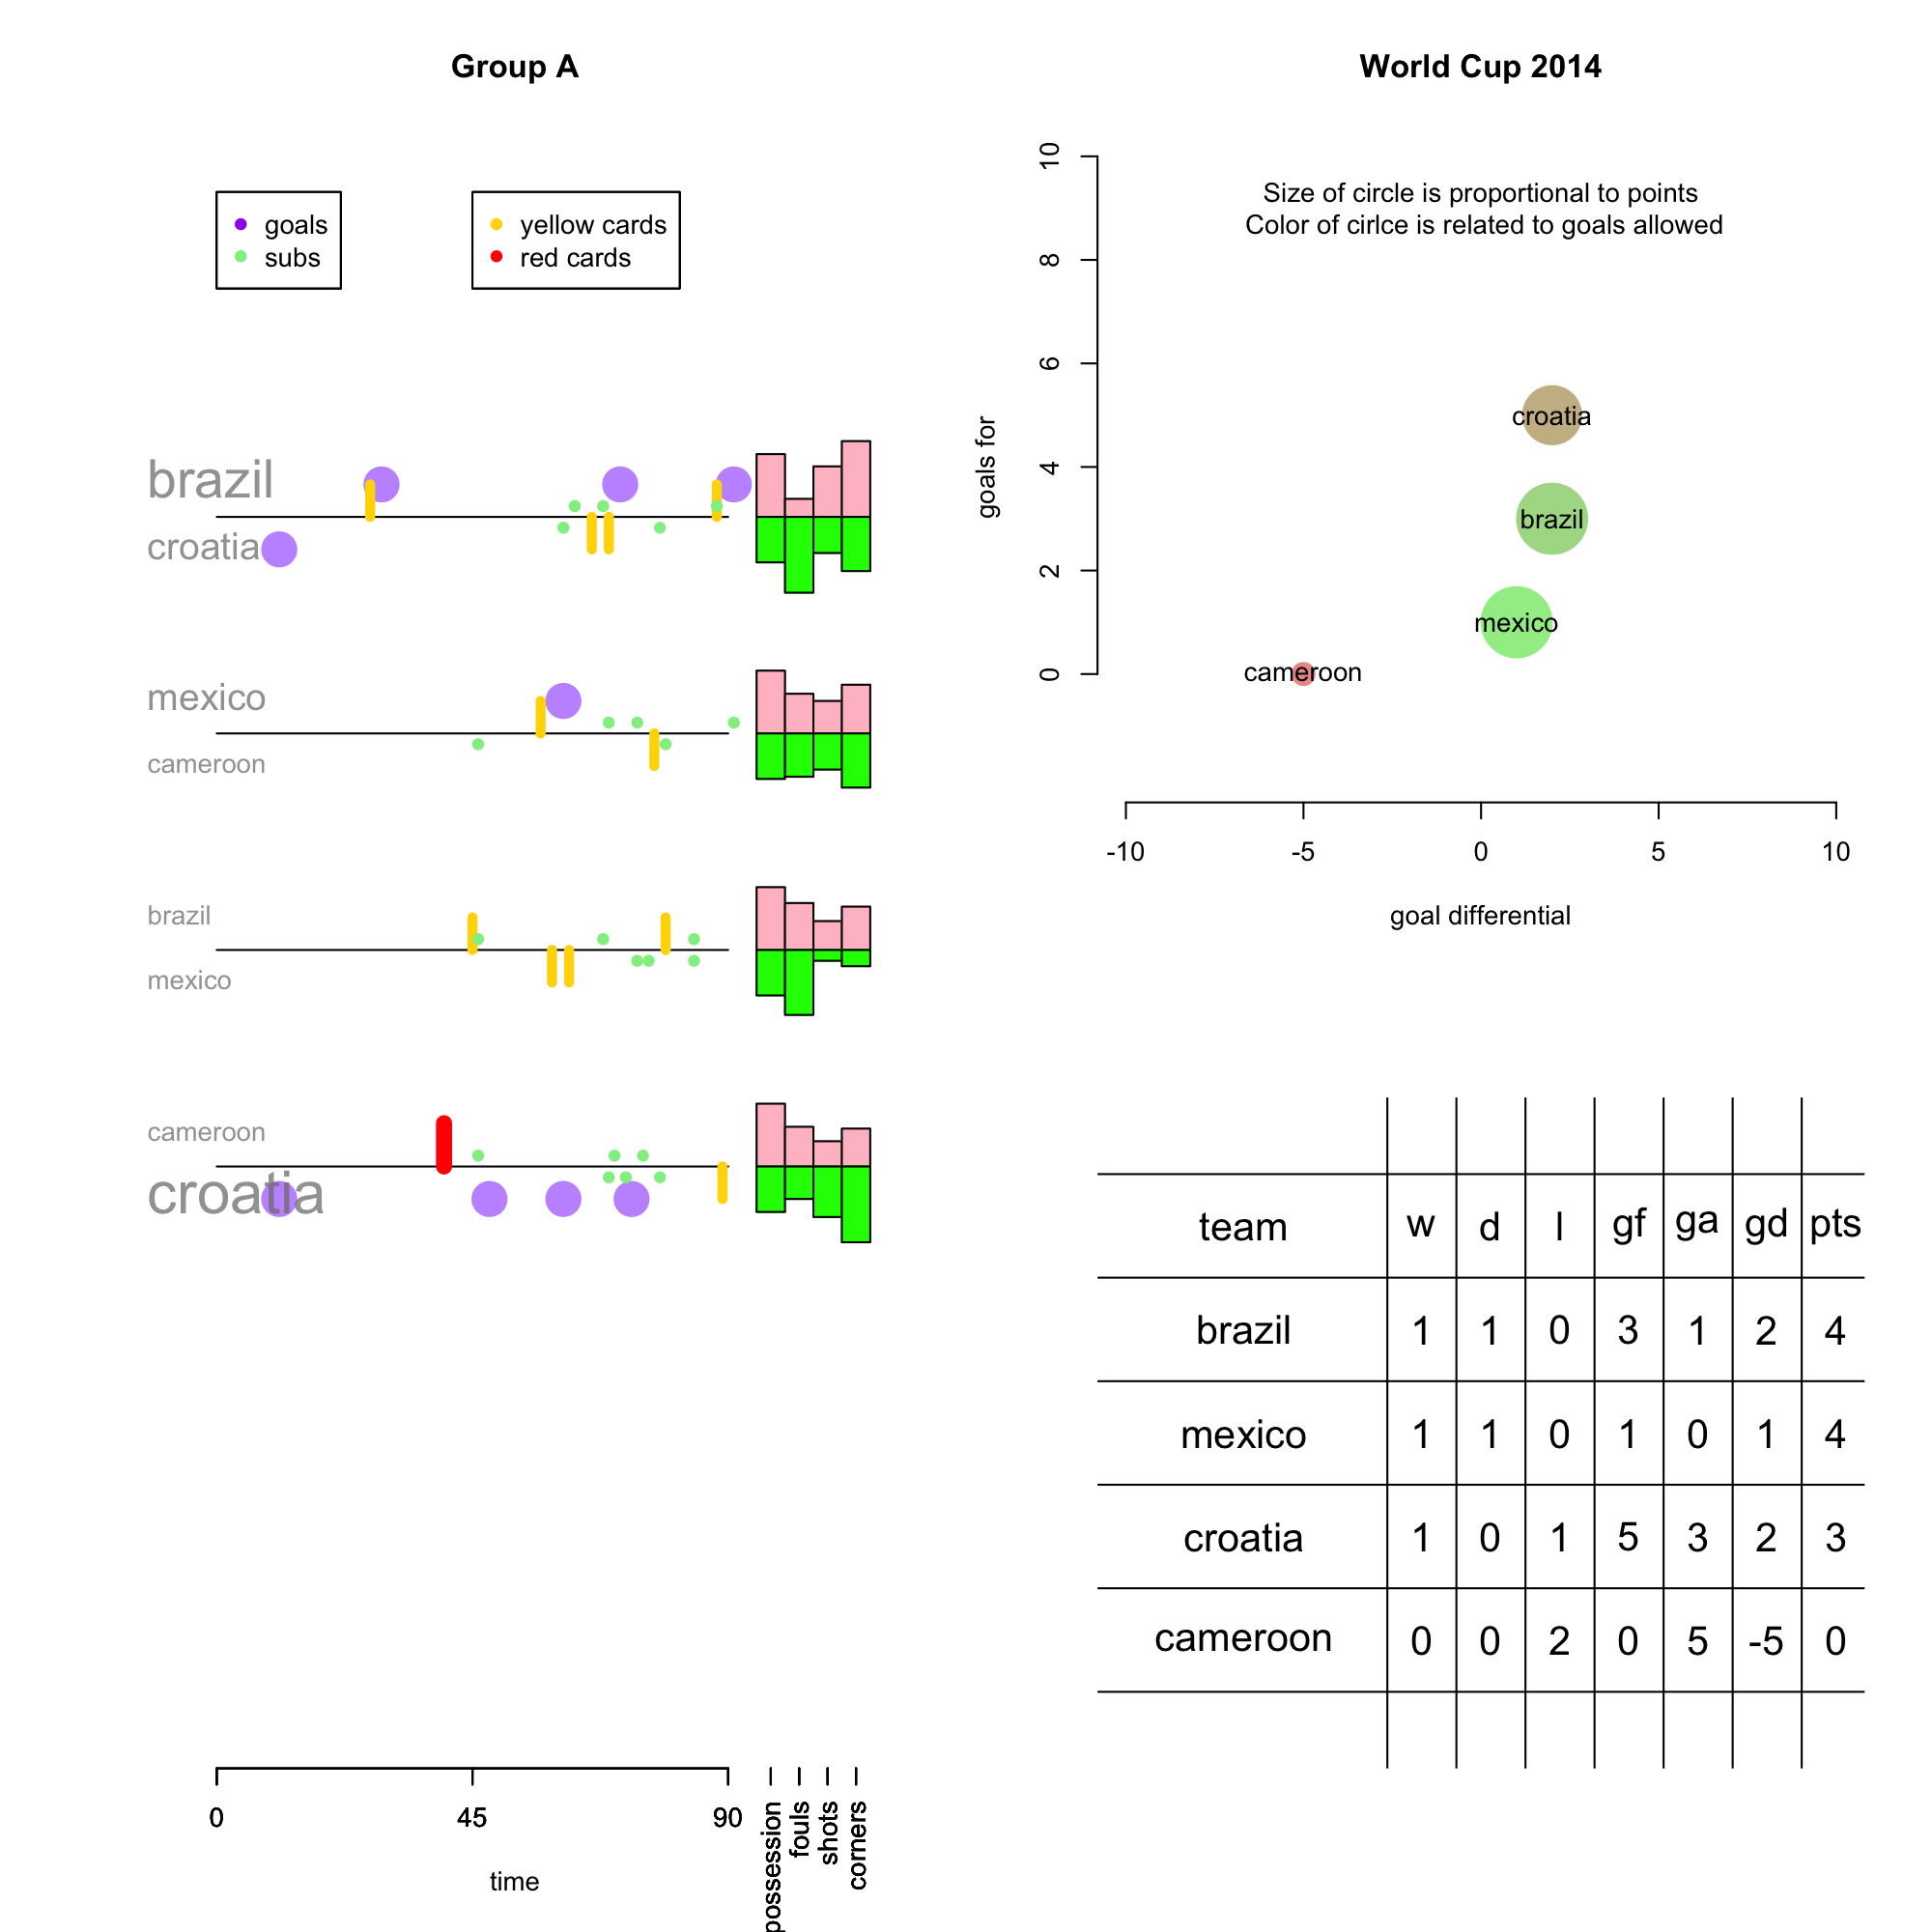
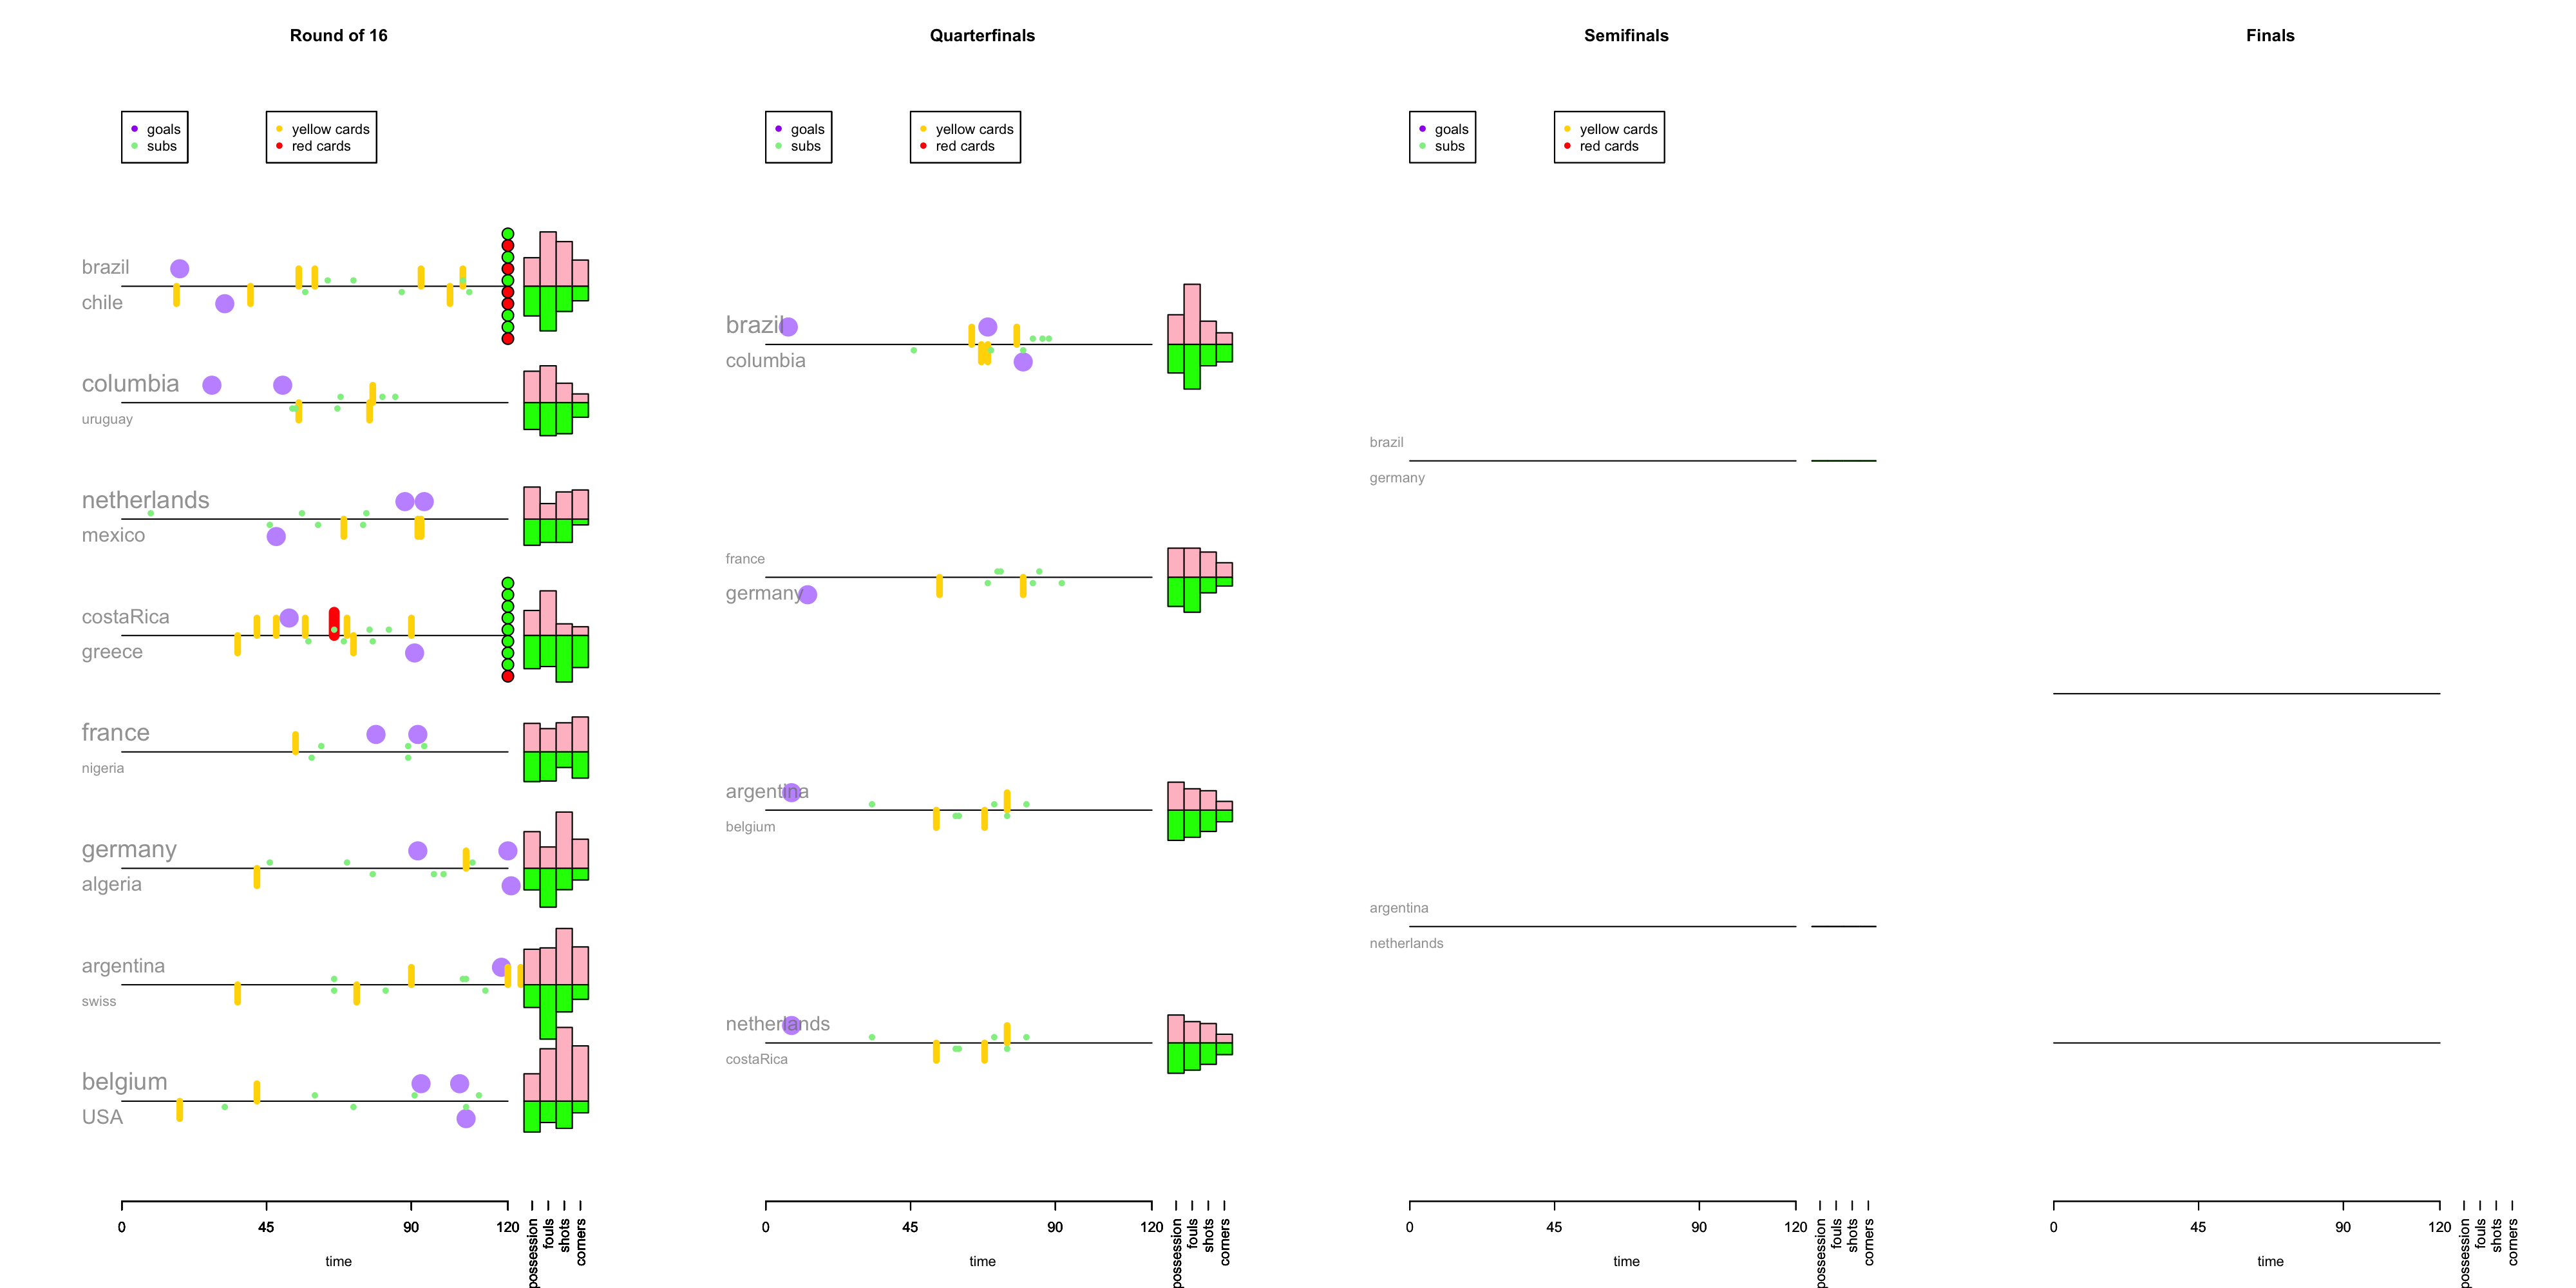
World Cup Data Viz Update
Some notes about the knockout stage:
- 3 of the 4 quarterfinal matches featured goals in the first fifteen minutes of the game.
- 20 of 28 penalty kick in the tie-breakers have been goals.
- Belgium had 38 (!) shots agains the USA. Tim Howard.
- So far teams have averaged 0.96 goals per game in the knock-out stage.
- 50% (6 of 12) of games in the knock-out stage were tied at the end of regulation. 3 of those games went to a shootout.


Some interesting notes:
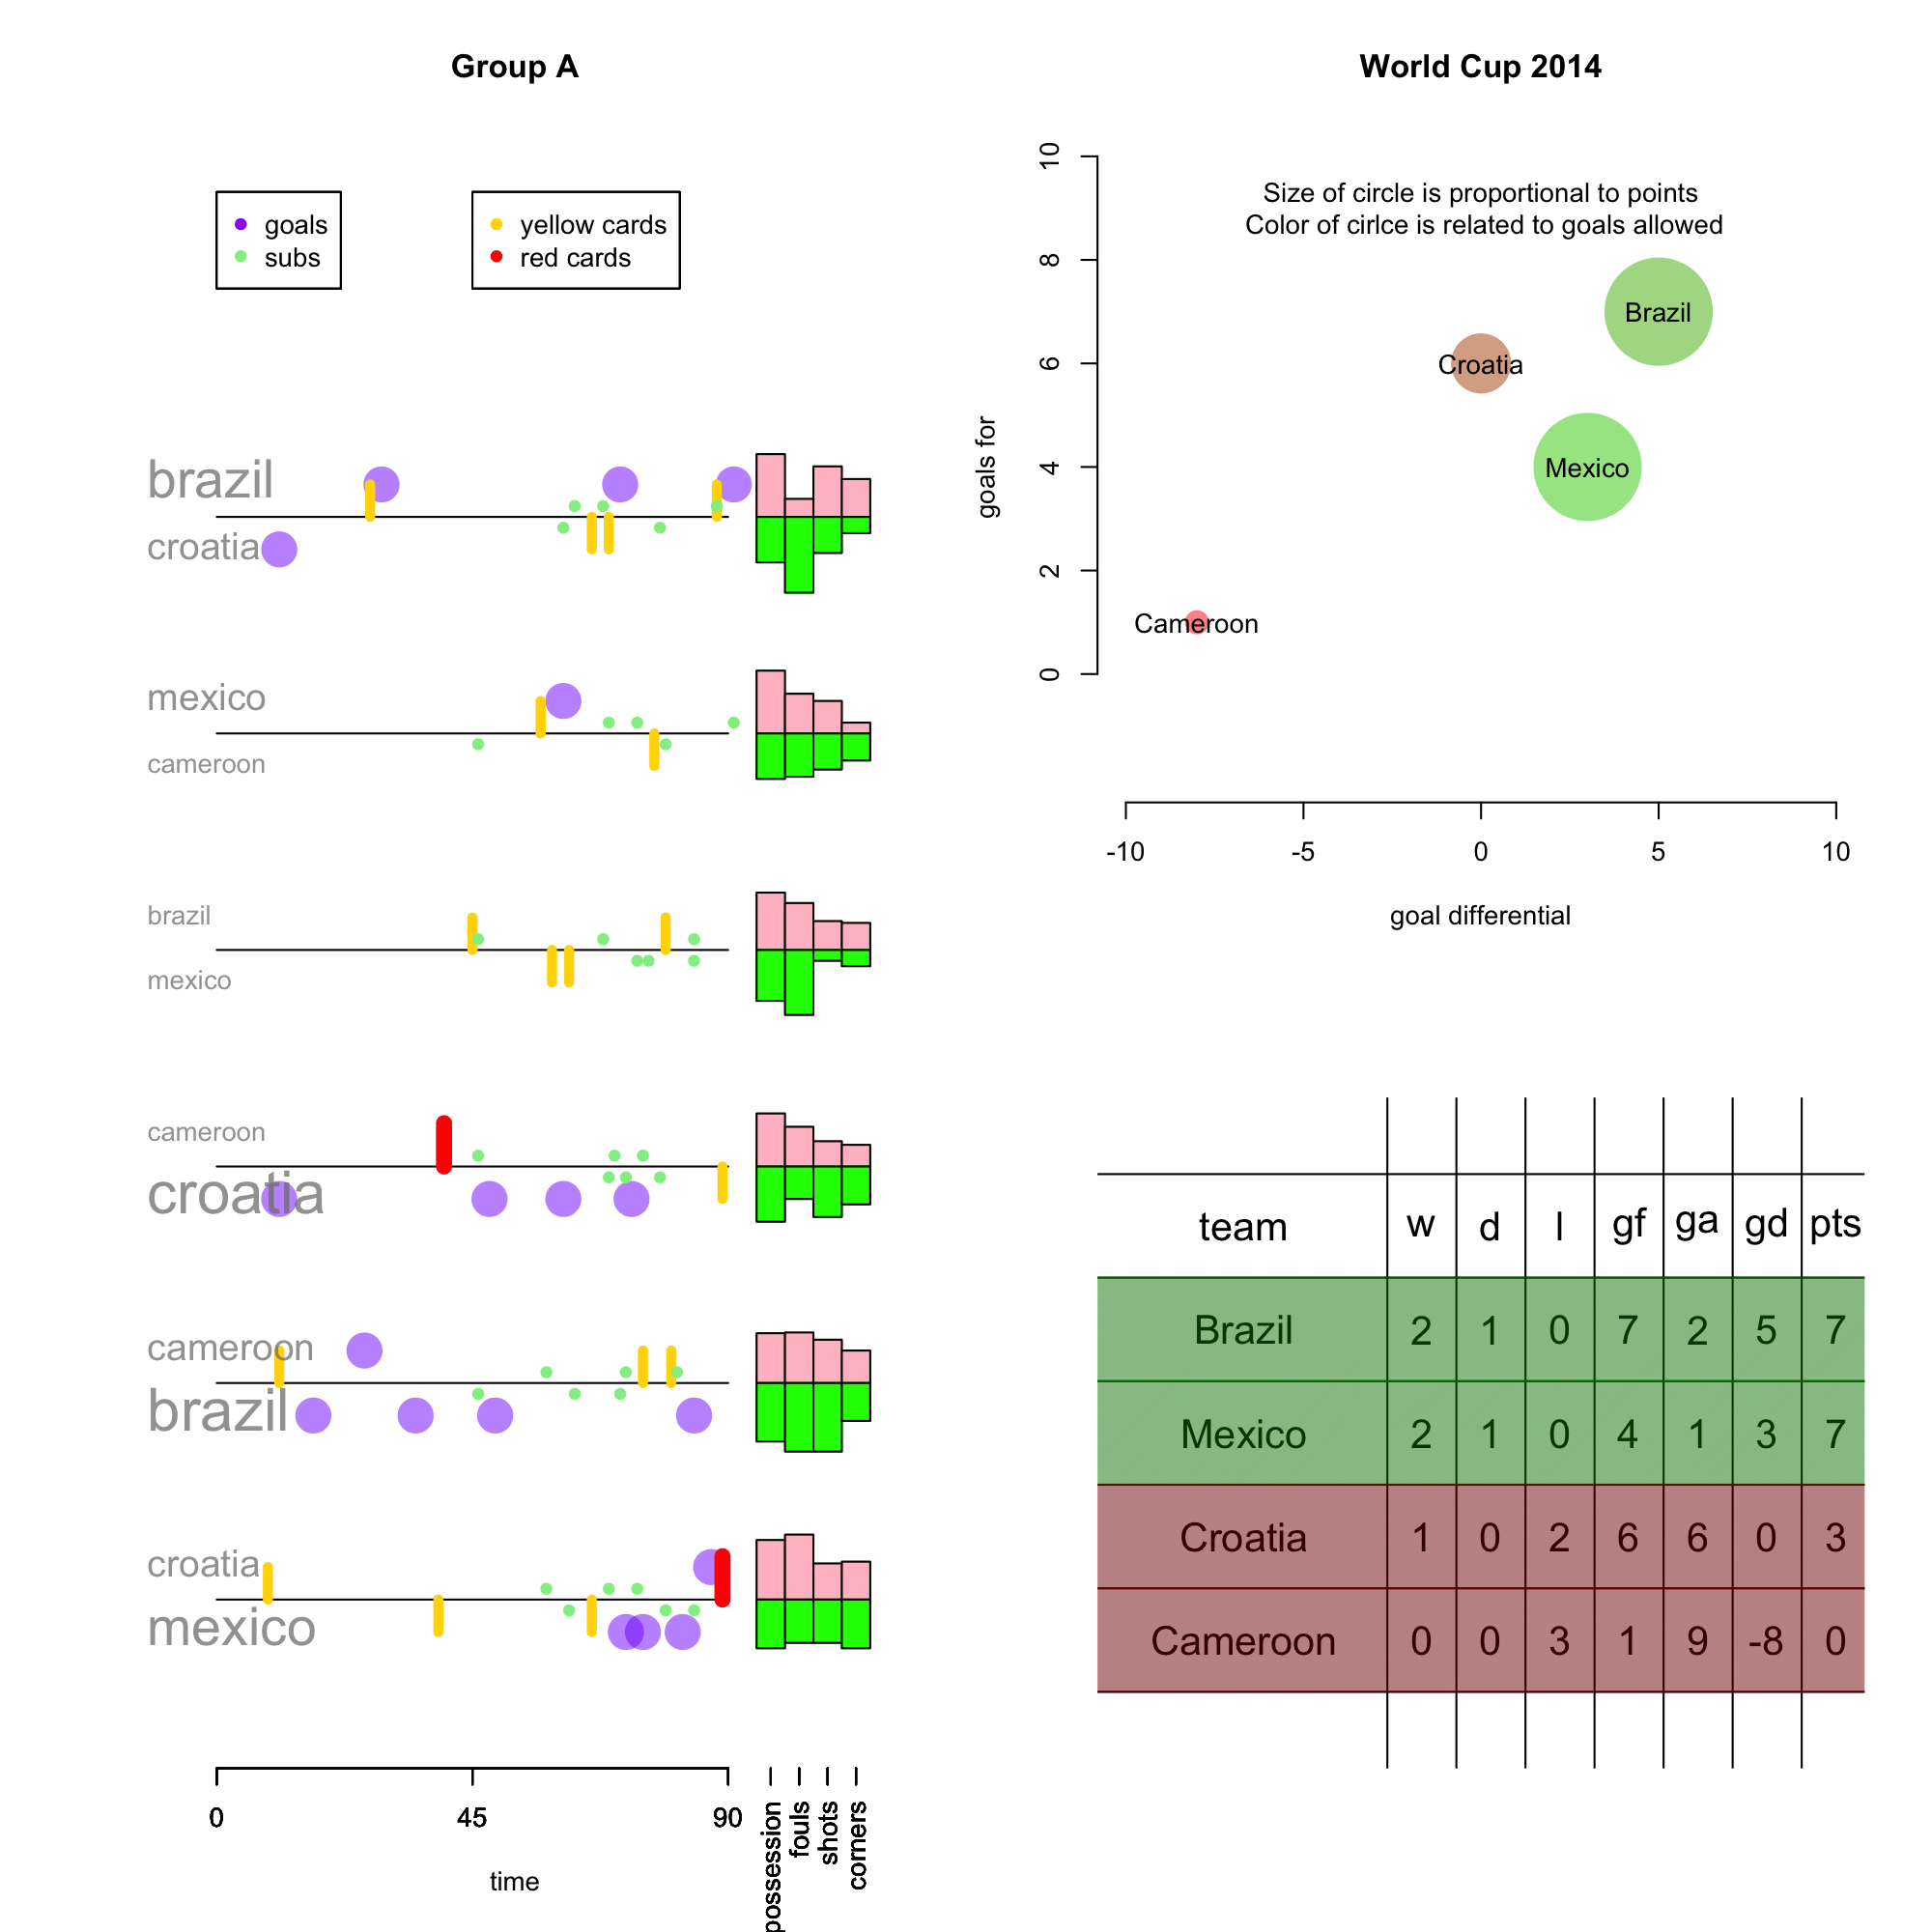
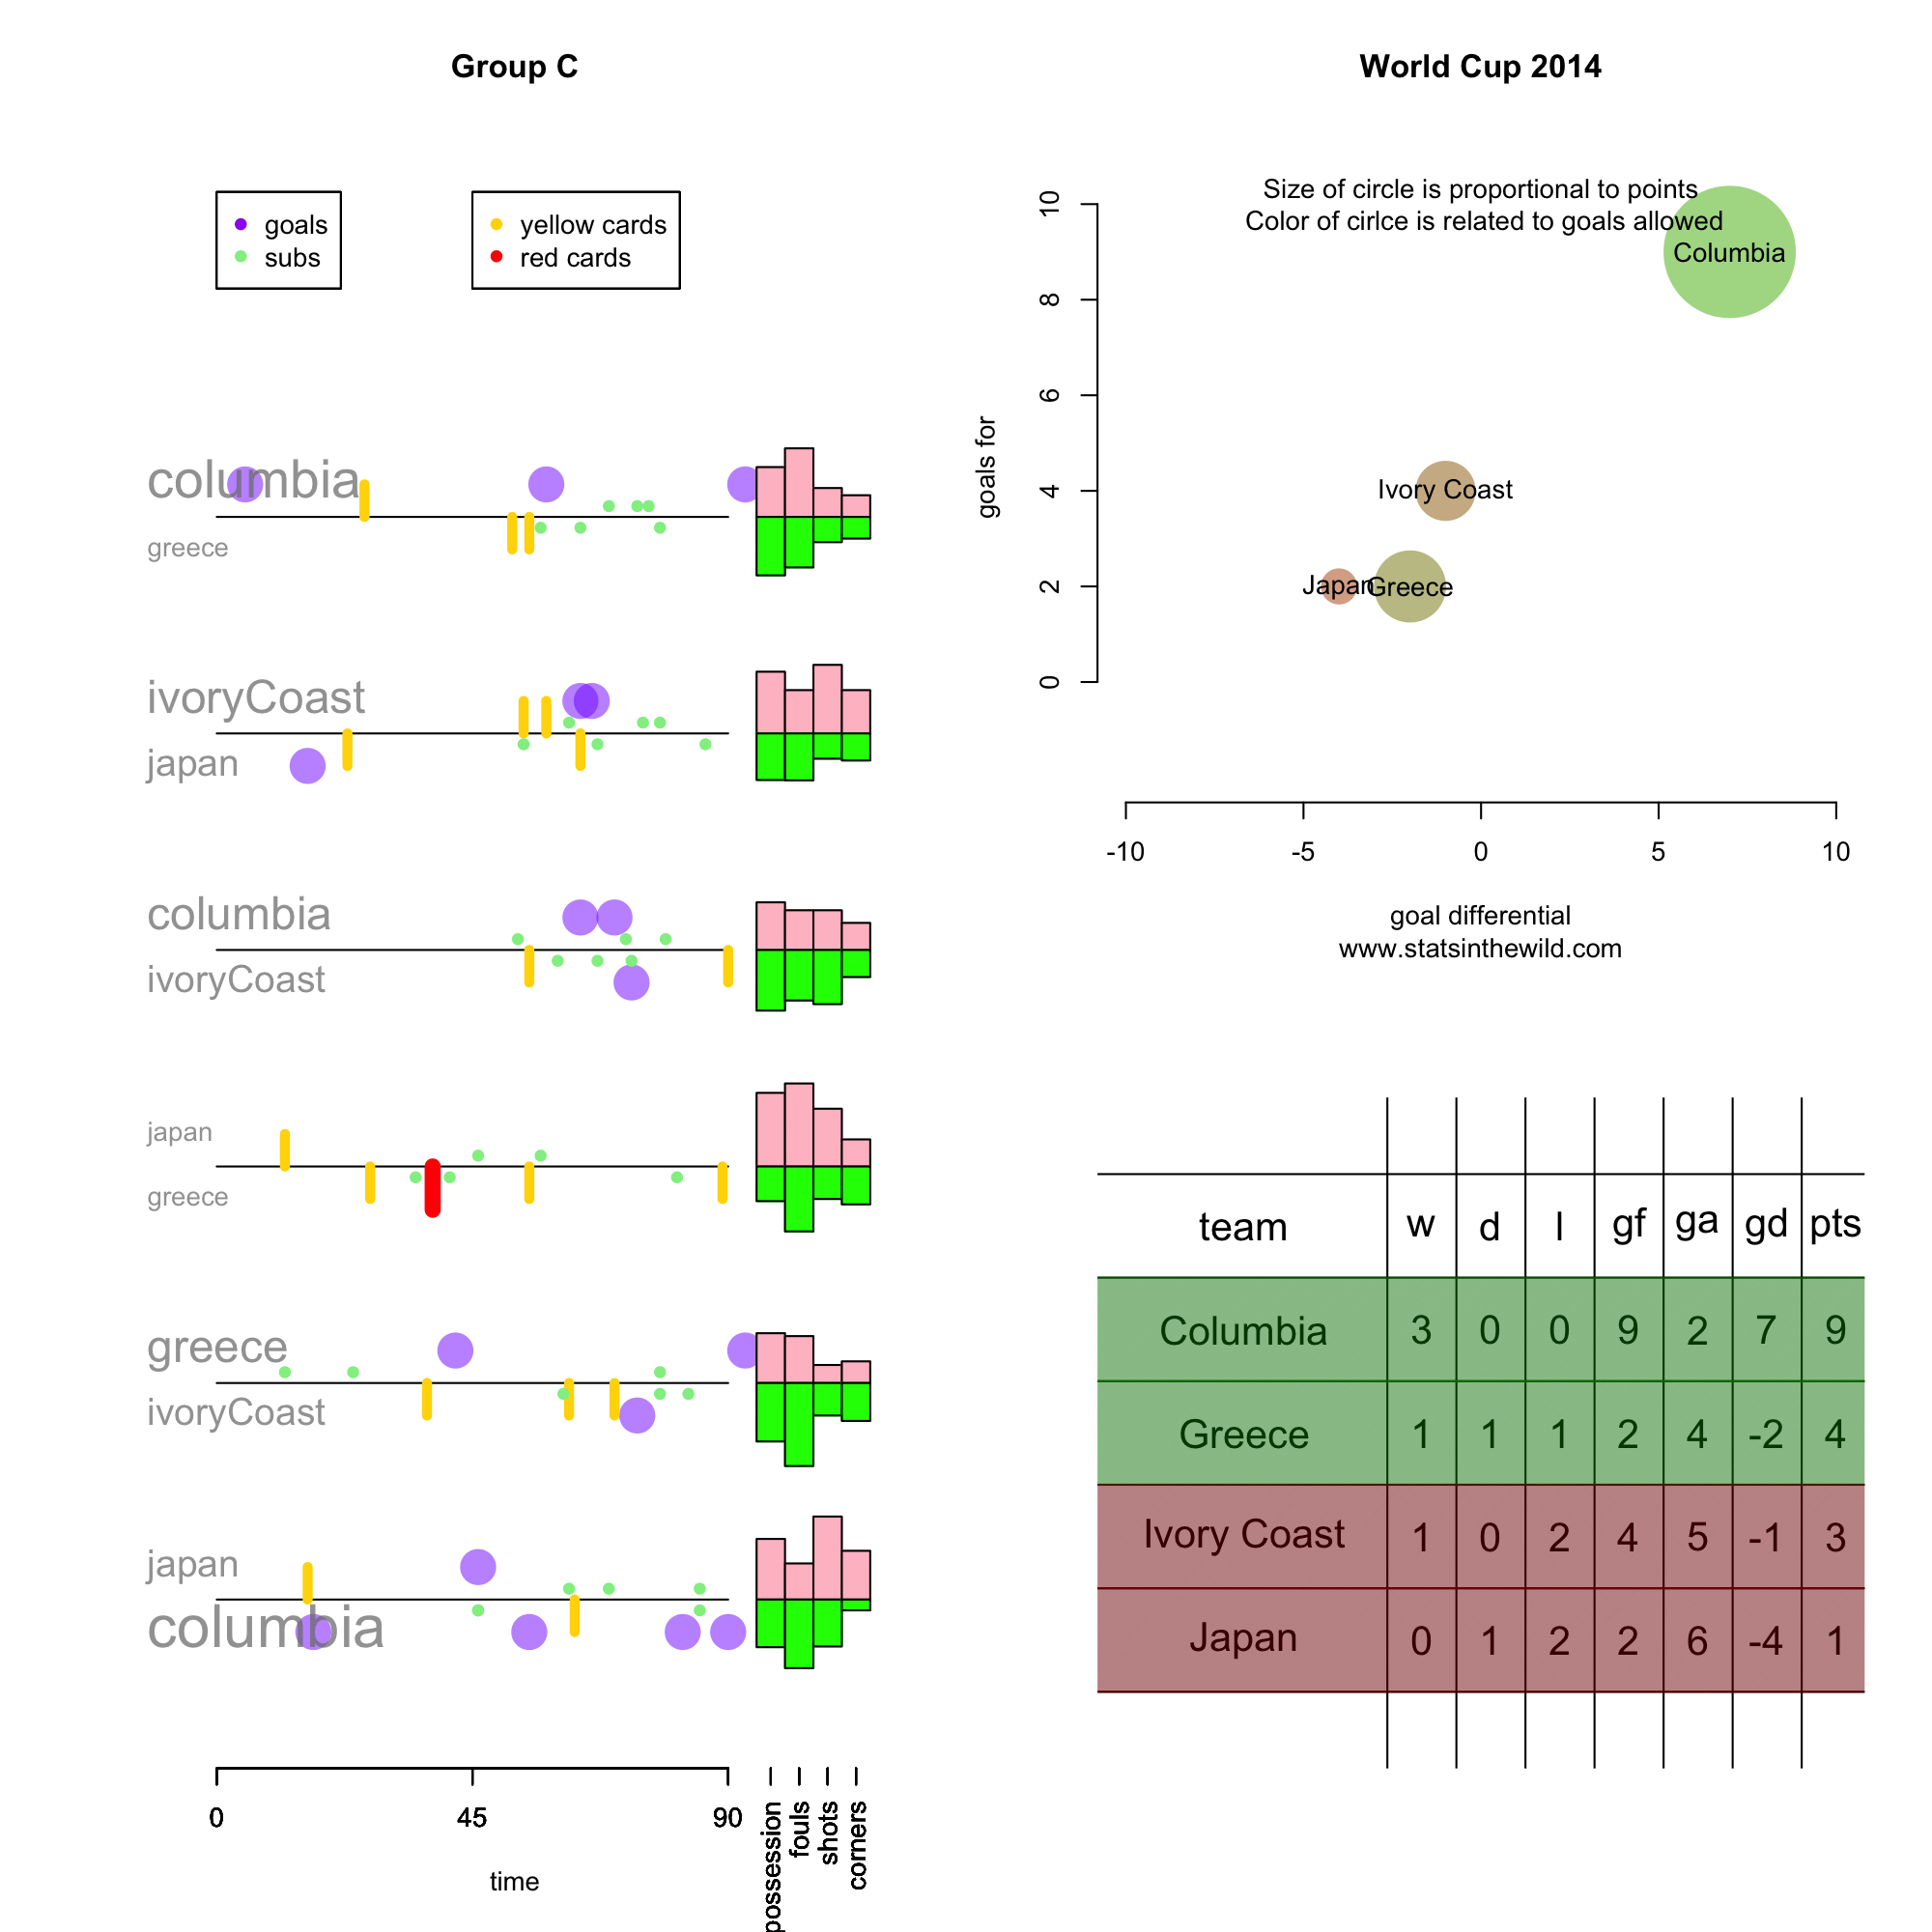
- Greece scored only 2 goals and still advanced out of the group stage. They were also the only team to advance to the knock-out stage with a negative goal differential.
- Switzerland allowed 6 goals and still made it out of the group stage.
- Cameroon, Australia, and Honduras were the only teams that did not score a point. Cameroon was -8 in goal differential, which was the worst in the group stages.
- Croatia scored 6 goals and did not advance.
- Italy, Ecuador, and Russia allowed only 3 goals in the group stage, but none of them managed to advance to the knock-out round.
- Every team with a positive goal differential advanced to the knock-out stage. Uruguay, Nigeria, and the USA advanced with goal differentials of 0.
- Ecuador and Portugal both scored 4 points, but neither advanced.
- The Netherlands scored 10 goals in the group stage.
- Teams averaged 1.42 goals per game in the group stage.
- Teams scored 0.8 goals less in regulation in the knock-out stages compared to the group stage.
- Belgium was the only to team to win their group without scoring the most goals in their group.


So fix it…
Here is the third to last paragraph of the article How the Portugal Draw Boosts the U.S.’s World Cup Advancement Odds from FiveThirtyEight (emphasis added):
So, why I do I say that our 76 percent figure might slightly underestimate the Americans’ chances? One reason is technical rather than soccer-related: Our simulation was programmed to resolve ties beyond goals scored and goal differential randomly, rather than looking at head-to-head results, because the head-to-head tiebreaker so rarely comes into play. But if a Ghanaian win in Brasilia and an American loss in Recife come by exactly the same scoreline — e.g. Ghana 3, Portugal 2, and Germany 3, U.S. 2 — that would trigger the head-to-head tiebreaker. The probability of such an outcome is low, but it means the simulator has slightly underestimated the U.S.’s advancement prospects, perhaps by 1 or 2 percent.
I understand that this rarely occurs, but why not add the one or two lines of code needed to add this? If they really believe that their probabilities are off and could be easily fixed, why not do it?
Cheers.
What a jerk!
First of all, what you’re about to read has almost nothing to do with statistics, but it really made my day. Go ahead and check out these next two pictures from facebook. Make sure to pay attention to the captions!


Now look at that “jerk who thinks he’s writing the next Pulitzer”. What a jerk right? It’s me!
So someone took a picture in Starbucks that I happened to be in the background of and posted it to facebook. Someone who was friends with the person who took the picture and recognized me and showed me the pictures. I got a little bit of a kick out of this. But then the comments. Pure gold:
 Several things here:
1) It took me 6 months to grow this “beard”.
2) He’s dead on with the year of the shorts, but even if my shorts were “ill-fitting”, how could that be concluded from these pictures.
3.) I literally didn’t say a word to the person in the picture.
4.) I was writing R code. (Which I guess is pretentious? I’m not really good with words, which I guess is gonna make it hard to “win the next Pulitzer”.)
5.) If you know western Mass, it probably wouldn’t surprise you that this was in Longmeadow.
Cheers!
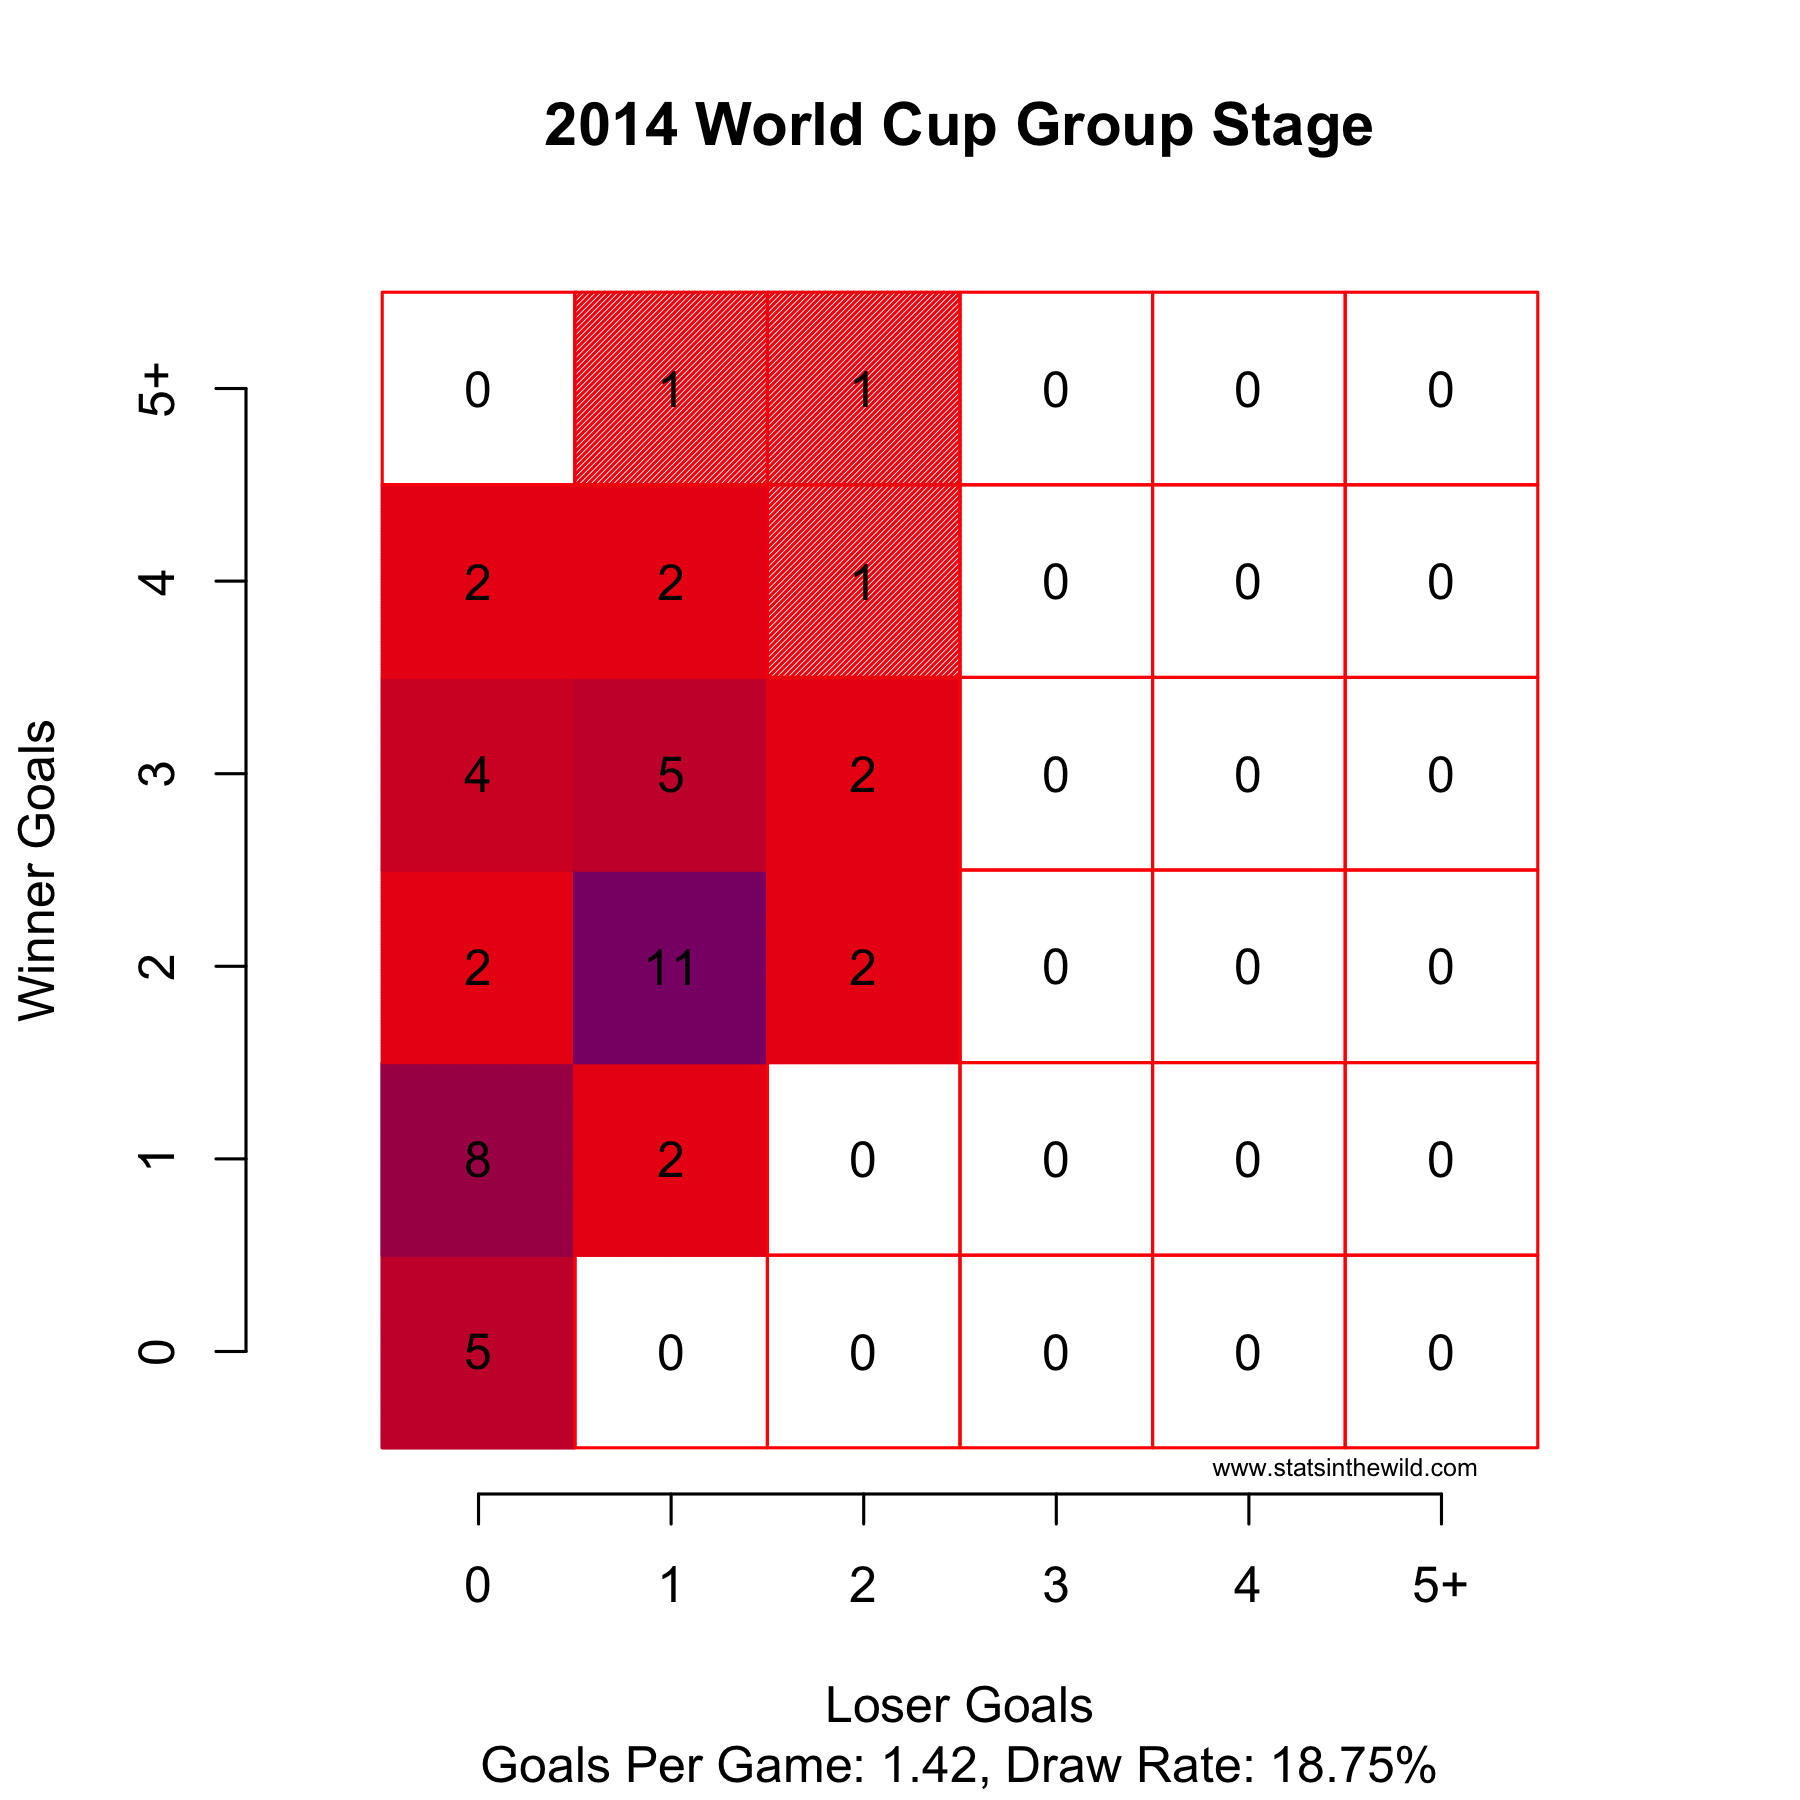
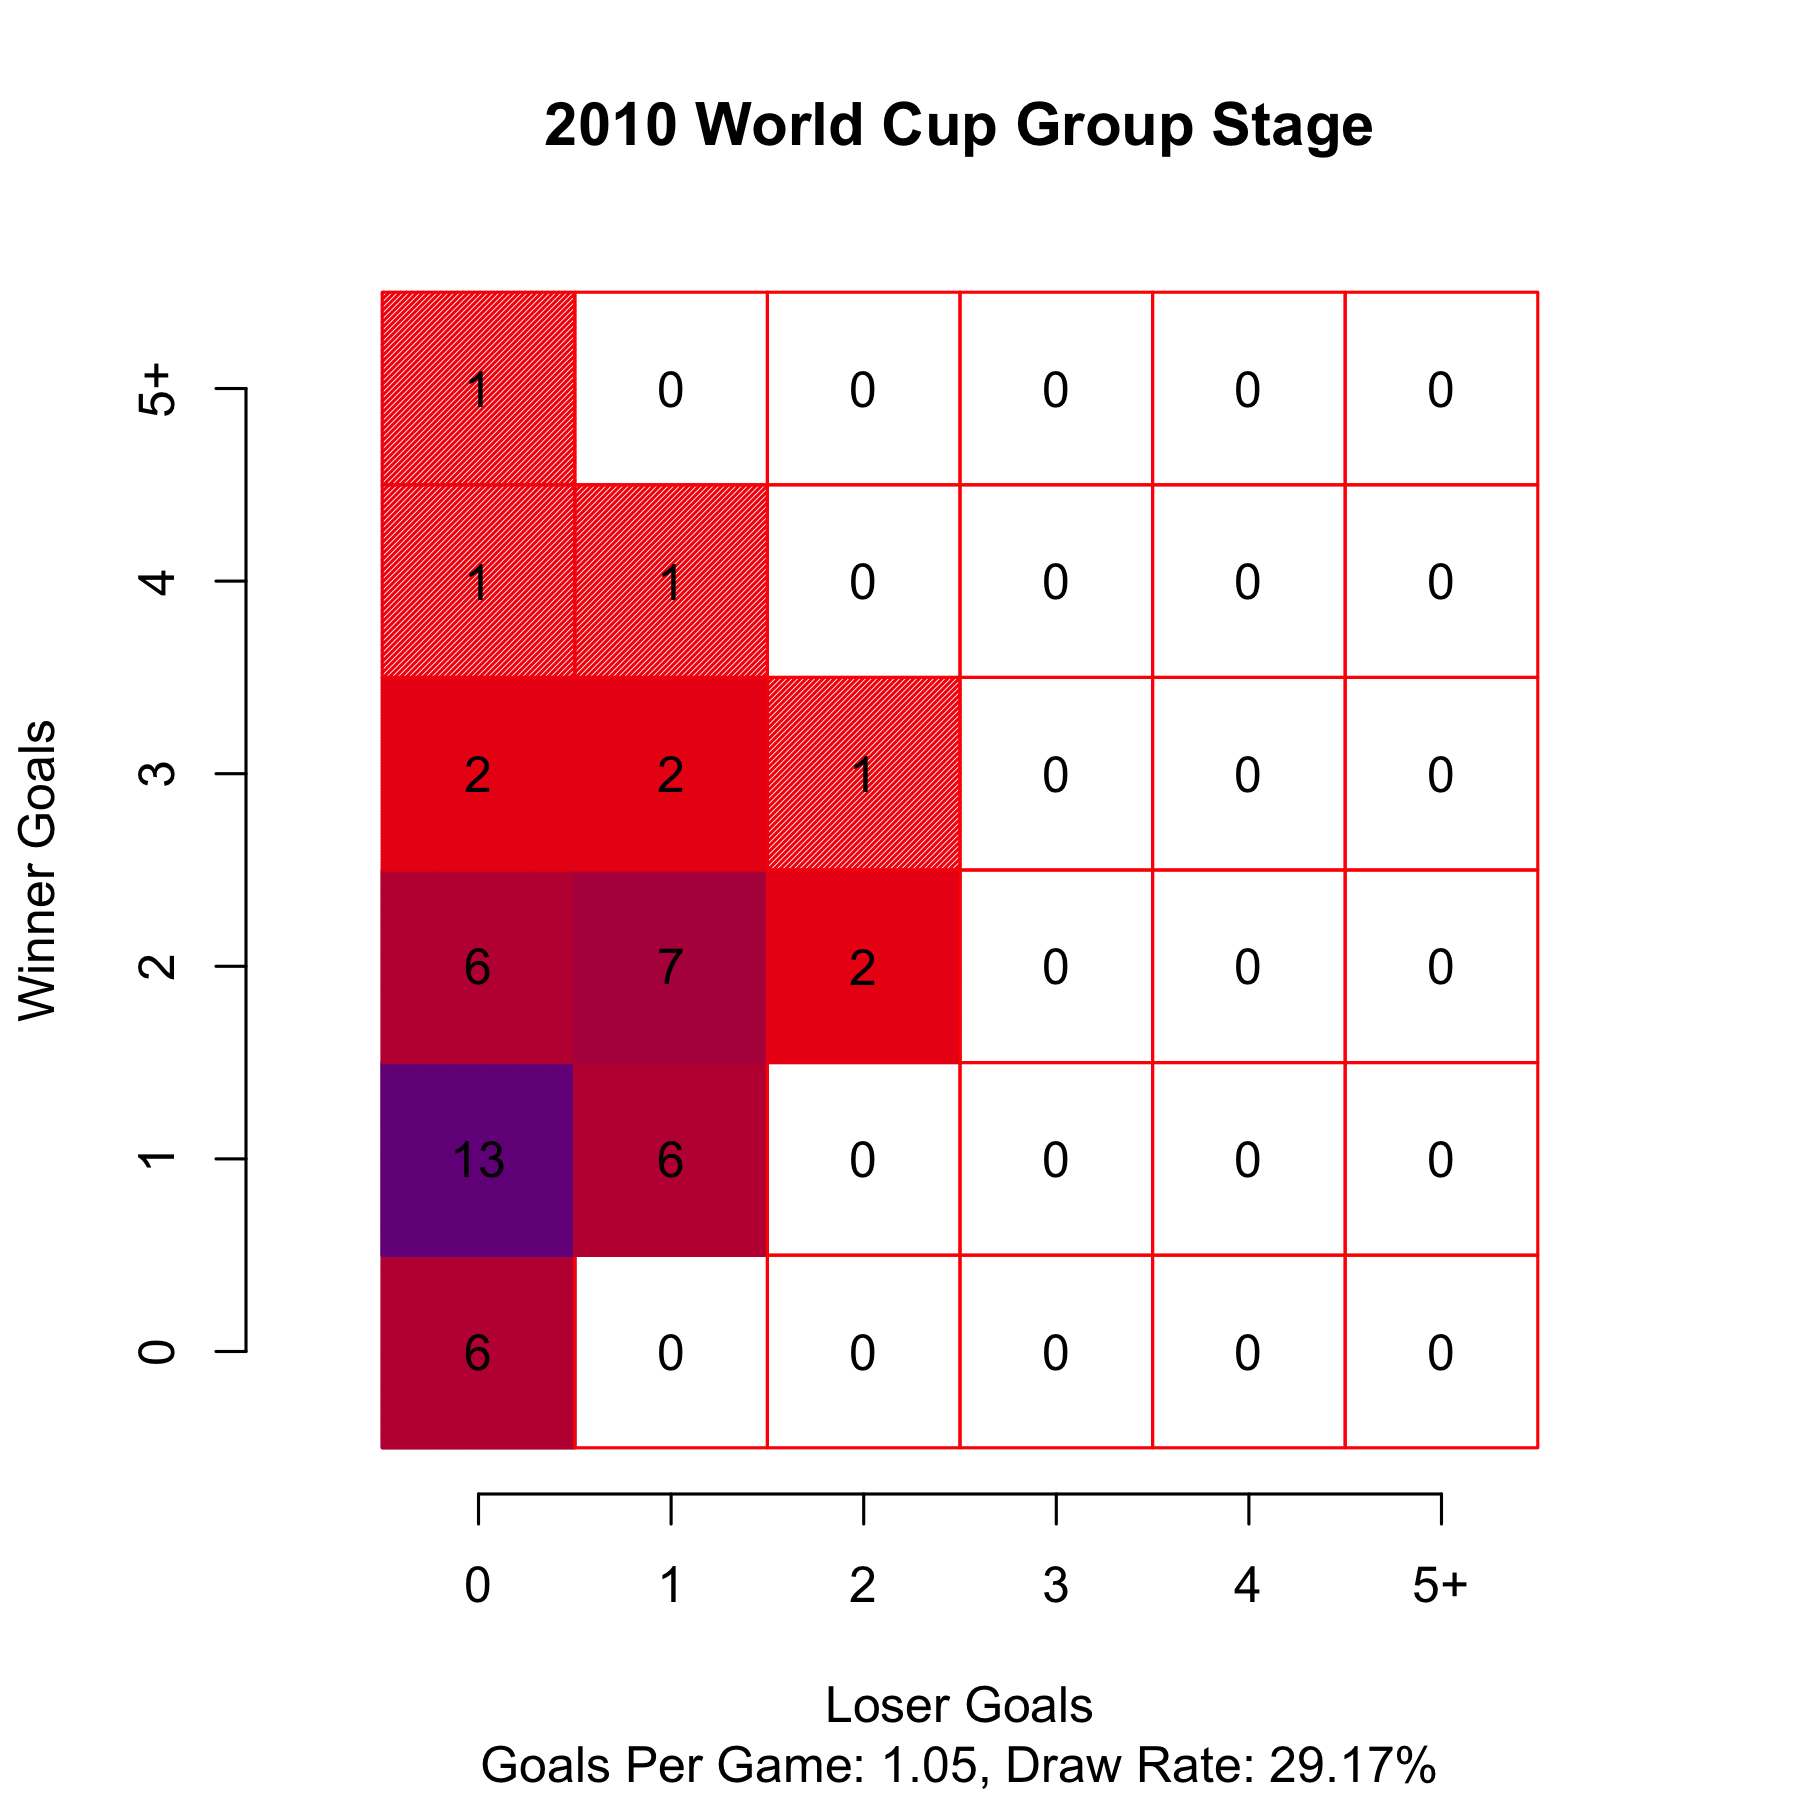
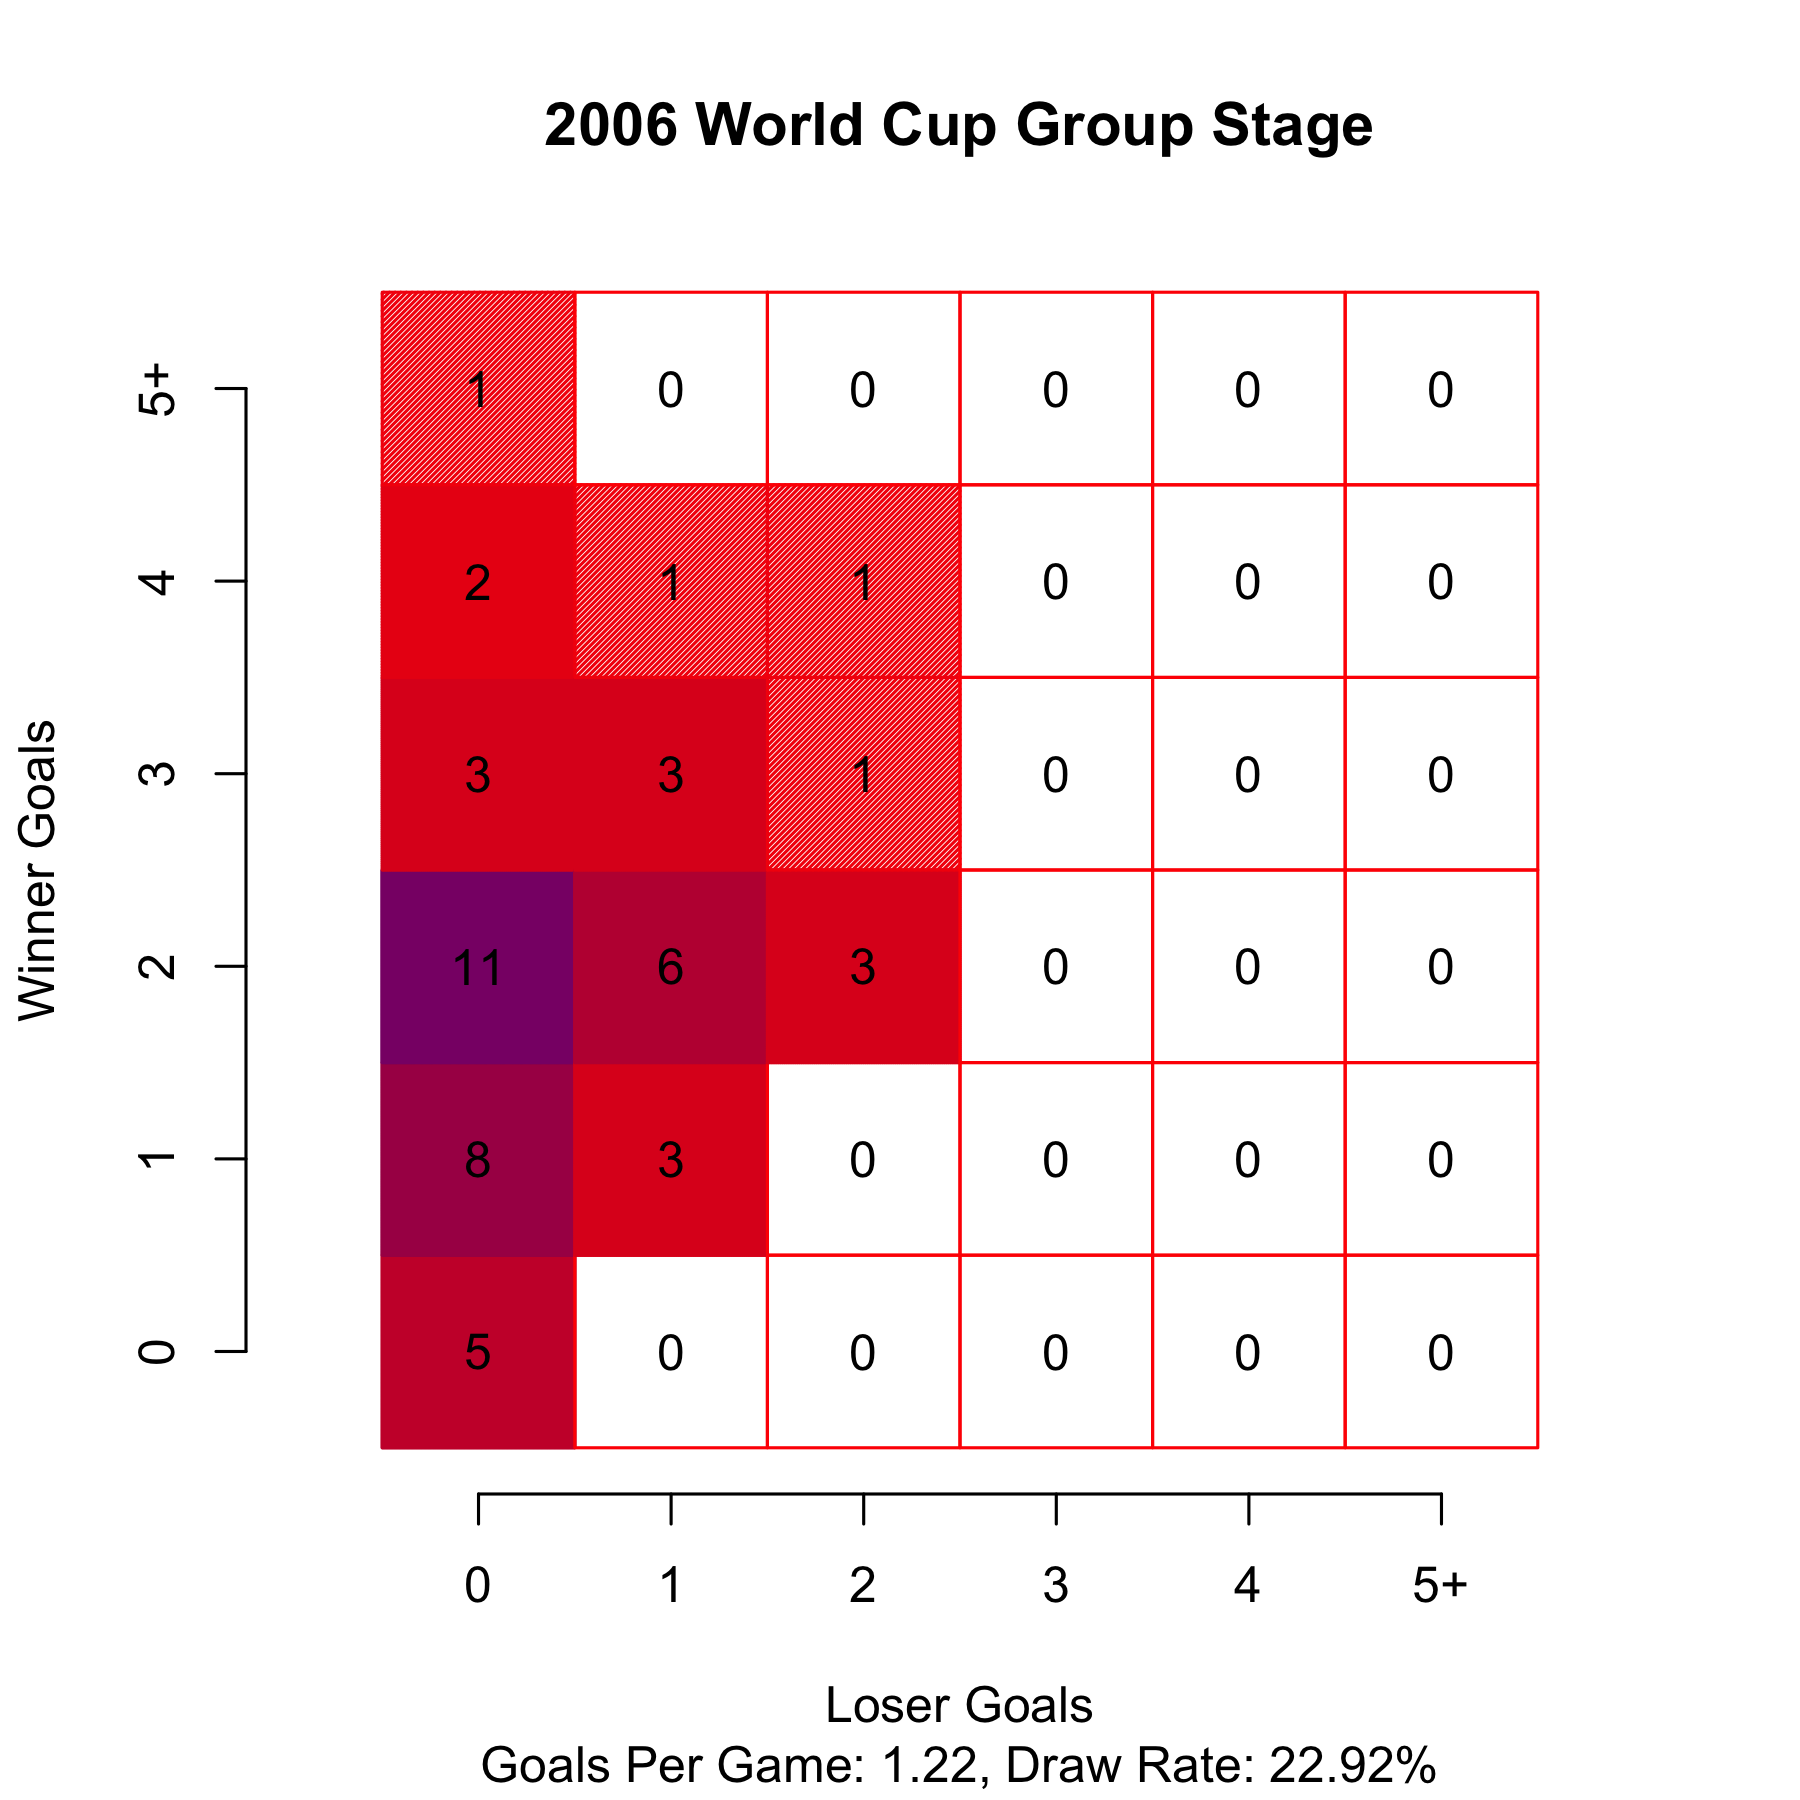
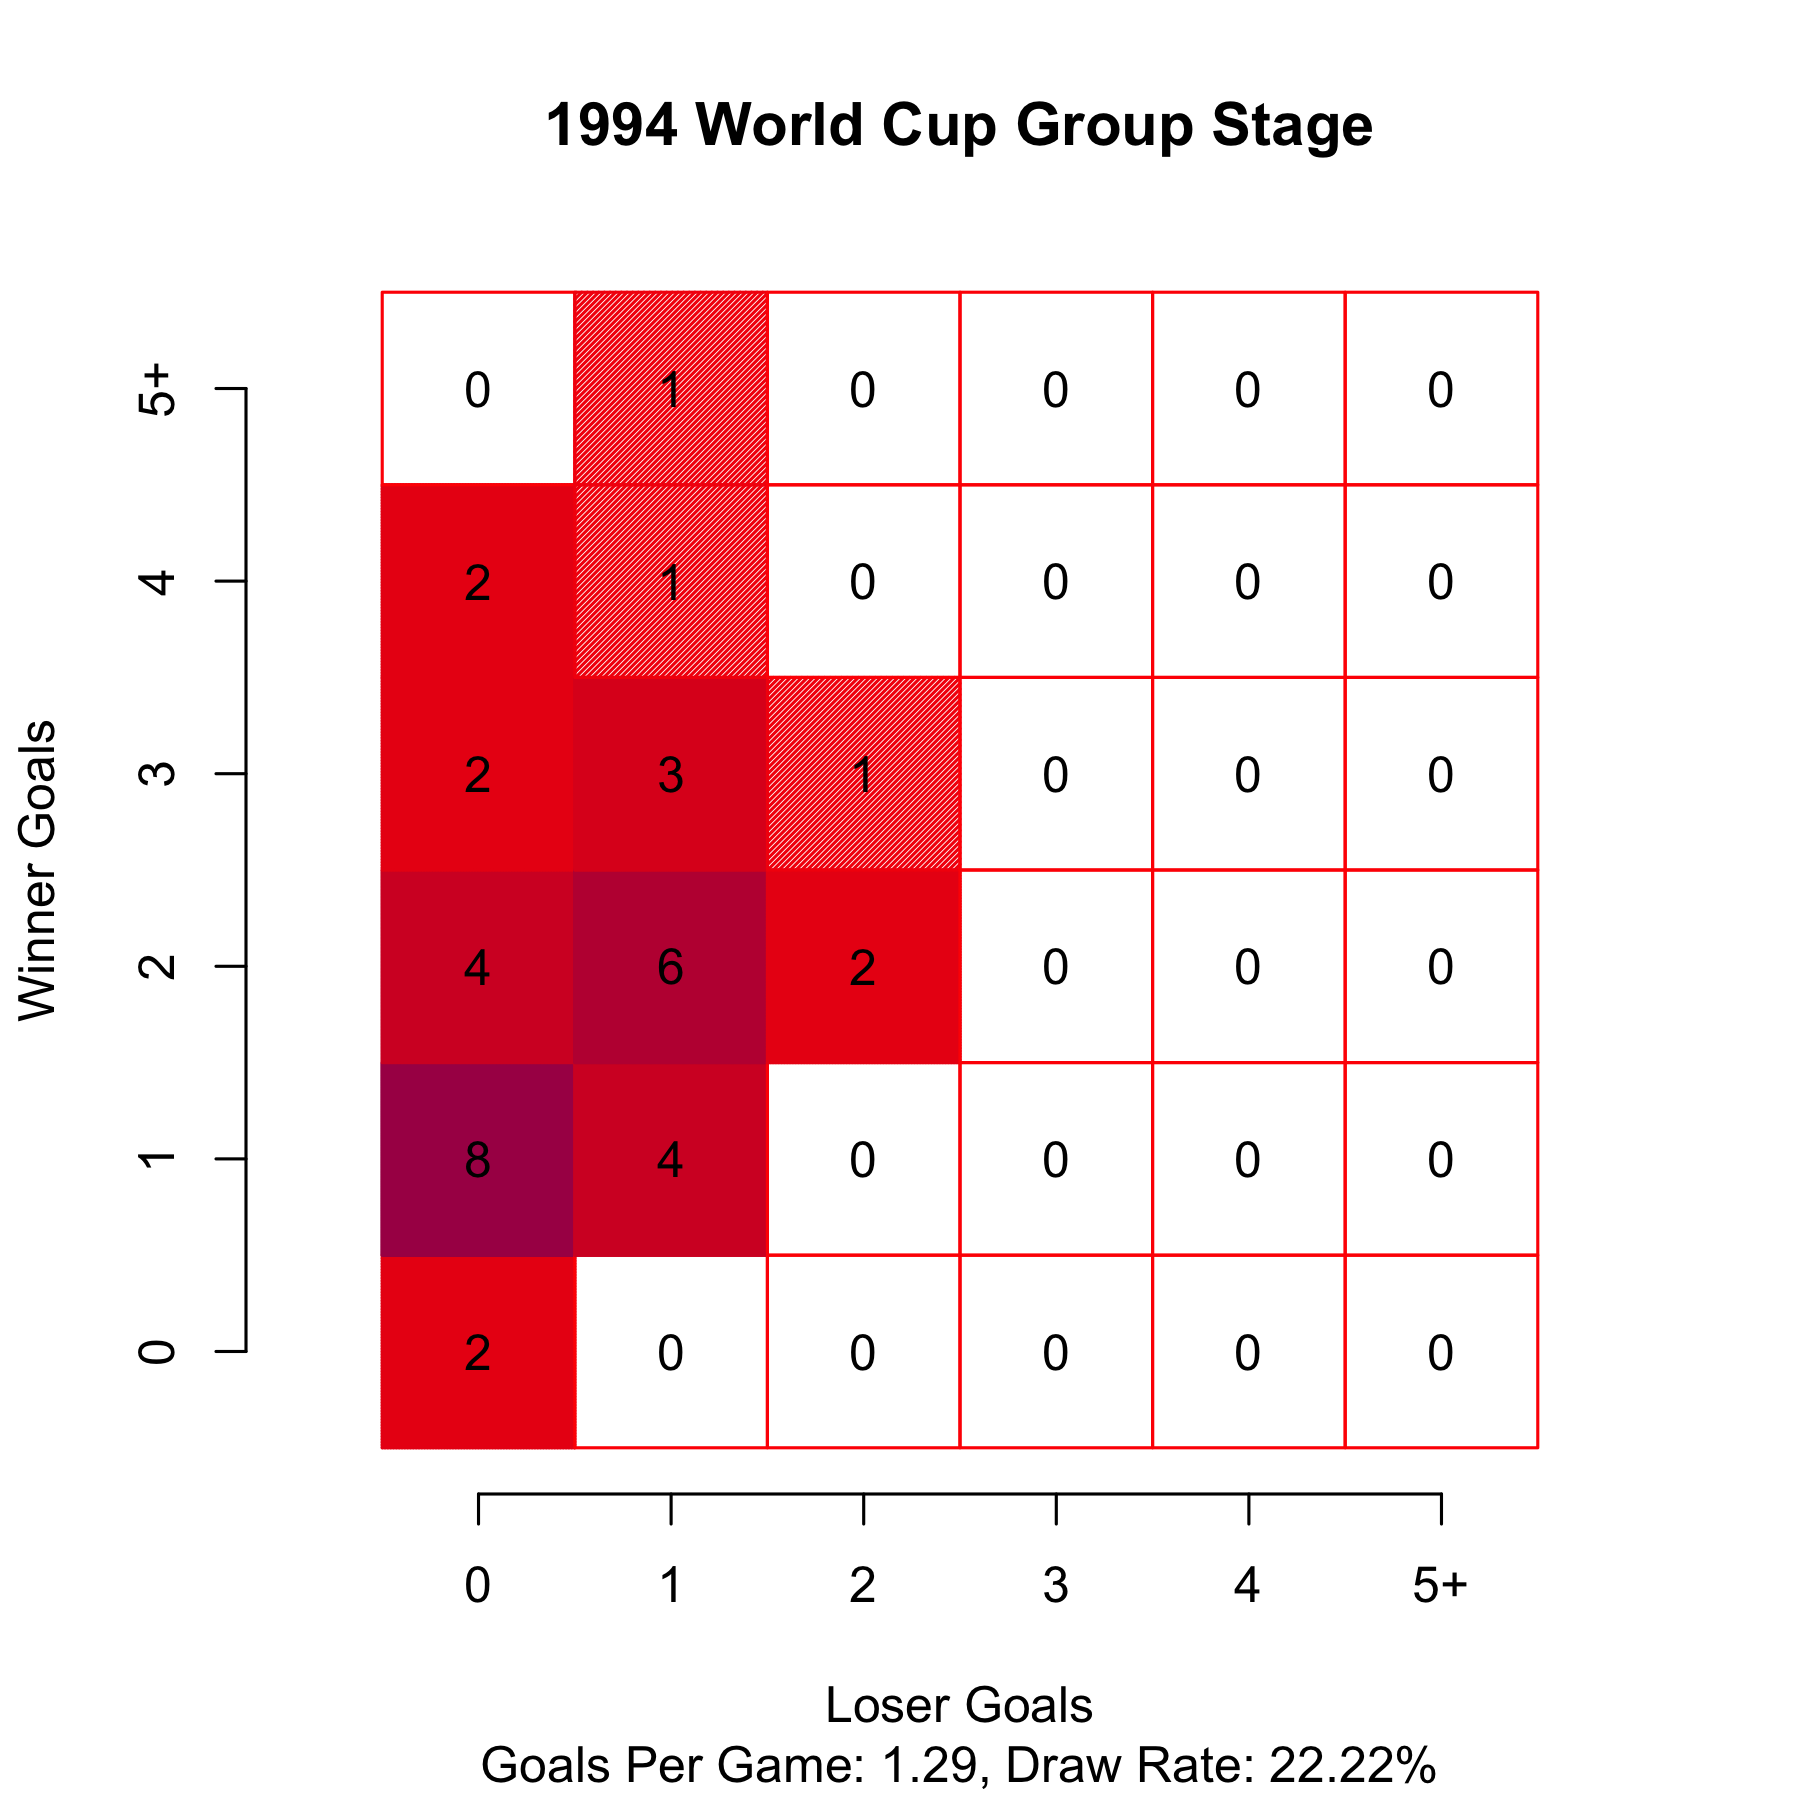
Tons of goals; very few draws (Updated)
I previously posted about how many goals were being scored in this World Cup, and now I’ve updated it through todays games. I’ve also expanded the grid to 5 x 5 per request.
As an American, I can tell you that there are two big complaints that Americans have about soccer: 1) Not enough goals are scored and 2) Every game is a draw. Well fellow Americans those complaints simply don’t work for this World Cup. Since 1994, the group stage has seen a low draw rate of 22.22% in 1994 and a high of 33.33% in 1998. This year however, only 16.67% of games have ended in a draw. (And at least two of those draws were spectacular games.)
As for not scoring goals, teams are averaging 1.43 goals per game in the group stage. Past group stages have produced averages of 1.05, 1.22, 1.31, and 1.29. As a point of reference for American’s, hockey teams averaged 1.37 goals per game this past season. So if you like hockey and hate soccer I don’t want to hear your “they don’t score enough” argument. (Your “all they do is flop and complain” argument is good here though.)
As to why more goals are being score, does anyone have any theories as to why? Is it just a small sample size? Or is there actually something going on here? I’ve heard someone suggest that the ball is different and that the climate may be playing a role. Any thoughts?
Cheers.

