Category Archives: Uncategorized
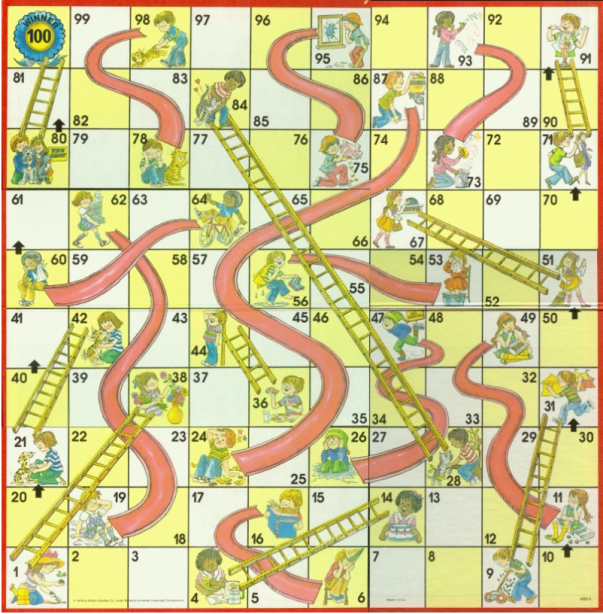
Chutes and Ladders
So my 4 year old daughter was sick yesterday and I spent part of the afternoon playing chutes and ladders with her. (She won every game because there is apparently a law in my house that the sick child always wins the game).
So I got to thinking about how many turns is the typical game of chutes and ladders. And also what’s the least amount of spins you need to finish the game.
So like every good father, I wrote a simulation!
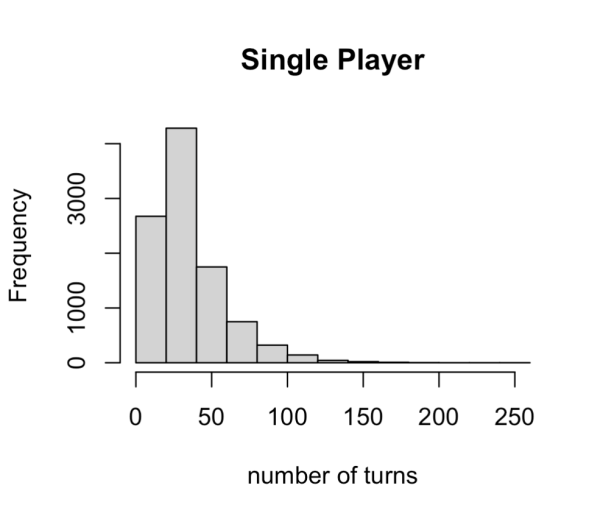
So first, I wanted to know the distribution of the number of turns it takes a single player to complete the game. I simulated the game 10000 times and found a median of 30 spins with an average of 35.84 spins. In the 10000 simulations I performed the largest number of spins was 243 (I would have quit at about 50 spins) and the lowest number was 7 spins, which happened 21 times in the 10000 simulations.
You can see a histogram of the distribution of the the number of turns it would take a single player to complete the game.
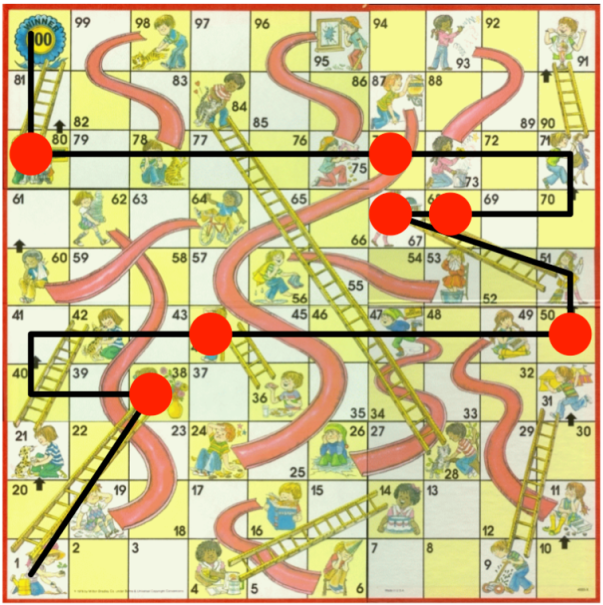
And for fun, here is one way to win the game in 7 moves. The spins in the game below are 1, 6, 6, 1, 1, 6, 6. (Some other ways to do it include: (4, 6, 2, 6, 6, 6, >3) and (4, 6, 3, 5, 6, 5, 6), with this second one actually including the player hitting a slide!)
But most people don’t play chutes and ladders by themselves. So how long will the game take before anyone you are playing with wins the game? If you have two people the average number of turns is 24.1 with a median of 21 turns. Three players will last an average of 19.9 turns with a median of 18. and four players will average 17.66 turns with a median of 54.

So, that it’s. Really important summer stuff that I’ve been doing.
If you are interested, here is another article about chutes and ladders and here is a link to my code is here on github.
Cheers.
Madness of march: Fun facts!
Some fun facts about the Sweet 16 in the 2021 NCAA tournament:
- The average seed of a team in the Sweet 16 this year is 5.875.
- The only seeds not represented in the Sweet Sixteen are 9, 10, 13, 14, and 16.
- This means there are 11 unique seeds represented in the Sweet Sixteen. There have only been 11 unique seeds in the Sweet Sixteen twice before: 1986 and 1990. In 1990, the Sweet Sixteen was missing the 9 seed and 13, 14, 15, and 16. In 1986, the 9, 10, 13, 15 and 16 seeds were missing.
- The seeds 1-8 are represented in this years Sweet Sixteen. That has only happened five times before in 1986, 1990, 2000, 2004 and 2008. In 2004, the seeds 1 through 10 were all represented.

- There are 9 teams in the Sweet Sixteen with a seed of 5 or higher (i.e. teams that “shouldn’t have made it”). This has happened only 4 times before in 2018, 2000, 1990, and 1996.
- There has NEVER been a Sweet Sixteen (going back to 1985) with 4 teams seeded 11 or higher. This year we have two 11’s, a 12, and a 15. Three teams with a seed of 11 or higher have made the Sweet Sixteen (1985, 1986, 2011, 2013).
- In 1999, there were 5 teams with a double digit seed in the Sweet Sixteen , the most ever. This year there are 4.
- The sum of the seeds in the Round of 32 was 210 this year. That is tied for the second highest ever (in 2016 the sum was 215 (TEN double digit seeds won their first round game!) and in 2012 the sum was 210).

- The sum of the seeds in the Sweet 16 is 94. The second highest ever was in 1986 at 89. The lowest sum of the seed in a Sweet Sixteen was 49 in 2009. (Note the lowest possible is 40).

- Here is a density of the seeds in the Sweet 16. The black line is 2021. The flatter this estimate the more “madness”. A high peak on the left with a heavy right skew would indicate a very “chalky” year tournament.

- Finally, here are the empirical CDFs of past tournaments with 2021 in red. The more “madness” the lower this curve will be. (I think the area under this curve would be an interesting way to measure the “madness” of a tournament.

Buy my NFTs. Or buy an actual print if you are still into owning physical things.
Cheers.
Nolan Arenado
The Rockies just traded Nolan Arenado to the Cardinals for pitcher Austin Gomber, Tony Locey, and Jake Sommers and infielders Mateo Gil and Elehuris Montero. And the Rockies will CONTINUE TO PAY Arenado even though he’s playing in St. Louis.
So this trade is…..to put it bluntly….fucking stupid. Nolan Arenado is one of the best players in baseball. I know this. You know this. But I didn’t realize and maybe you didn’t realize how fucking good he is. So I got out the Lahman database (shoutout to Sean Lahman) and check for myself how good he is.
Turns out Nolan Arenado is even better than I though he was.
Let’s play a little game: In the last 5 full seasons (2015-2019) what player had the most hits?
The answer is Charlie Blackmon with 940 hits. The next three players with the most hits are Jose Altuve (938), Mookie Betts (910), and…..Nolan Arenado (906). No other player has more than 900 hits in the last 5 full seasons. Altuve and Betts are the 2017 and 2018 AL MVPs, respectively. And, more importantly, Charlie Blackmon has a dope ass beard. (Compared to my beard which you can think of as some sort of reference level).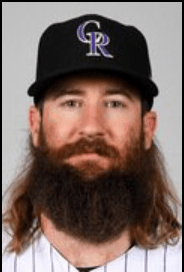

Ok. Next question. Who has the most HR in the last 5 complete seasons?
If you guessed Nolan Arenado, you’re an idiot. It’s Nelson Cruz with 204, you absolute complete incompetent. Actually, Arenado isn’t a bad guess. BECAUSE HE WAS SECOND! He had 199 HR over this period (including 8 in the 2020 Covid shortened season).
Let’s do it again with runs. Arenado is 4th with 519 runs. The three players ahead of him: Betts, Blackmon, Trout.
How about doubles? Arenado is 4th with 190. Behind Betta, Boegaerts, and Castellanos.
Ok. Last one: Who has the most RBI in the last 5 complete seasons? Number 10 is Albert Pujols with 472. From 9 through 2 is goes: Khris Davis (474), Bryce Harper (486), Jose Abreu (504), Paul Goldschmidt (505), J.D. Martinez (509), Anthony Rizzo, Nelson Cruz (522), Edwin Encarnacion (538). Guess who is number 1, motherfucker: Nolan Goddam Arenado. With 621 RBI! That’s 83 (EIGHTY THREE!!!!) more than the next closest. That’s 16.6 more RBI on average per year than the guy who is number 2!
Arenado’s RBI numbers are bonkers. From 2015 through 2019 he had 130, 133, 130, 110, 118 (with 26 in 2020).
Holy. Shit. The Rockies aren’t even pretending to try to win. This trade sucks. Sucks. Sucks.
You can find my code, as always, here.
Cheers.
2020 Presidential Election as Field Goals
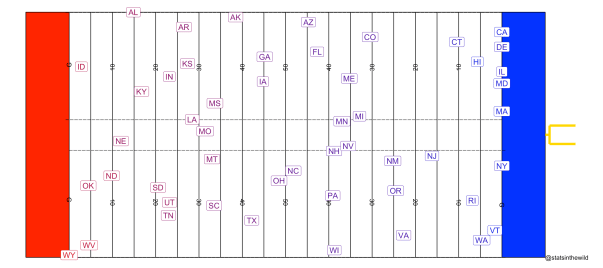
Yesterday I posted the probabilities of Biden winning each state in terms of a field goal distance. But I only did it for a few swing states, and I think this idea deserves more. So with the help of Mike Lopez’s post from last May, I put the field goal distances for each state on a football field. The distance in the plot is in terms of Biden winning the state and he is kicking towards the bottom of the plot into Trump’s end zone. The horizontal location of the state name is roughly alphabetical order with a few manual tweaks to make it look pretty. And the color of the state abbreviation is the projected vote share for that state.
So let’s look at an example of how to interpret this. Let’s take Ohio. According to fivethirtyeight, Biden has a 37.9% chance to win Ohio. The probability that an NFL kicker makes a 61.5 yard field goal is about 37.9% so Ohio is plotted just beyond the 50 yard line (51.5 yards + 10 for the end zone).

Here is the table of win probabilities and the corresponding field goal distances for each state.

Let’s hope Biden doesn’t double doink this election.
Code is available here.
UPDATE: Based on some suggestions that I have received from Ron Yurko.

Also, you can only post stuff related to politics on Thursdays?!?! That’s the strangest rule I have ever hear. 
UPDATE: Based on suggestions from @alargewop.

UPDATE: Based on final suggestion by Ron Yurko.
The state of the presidential election in field goal yardage
I’ve converted FiveThirtyEight win probabilities into field goal yardages.
So for example Arizona – 54.75 means that the probability that Biden wins Arizona is about the same as a kicker in the NFL making a 54.75 yard field goal. Let’s look at the swing states in terms of how likely Biden is to win the state
- Arizona – 54.8
- Colorado – 40.5
- Florida – 52.8
- Georgia – 63.6
- Iowa – 65.4
- Maine (Statewide) – 45.5
- Michigan – 43.2
- Minnesota – 47.0
- Nevada – 45.5
- New Hampshire – 48.9
- New Mexico – 35.29
- North Carolina – 57.9
- Ohio – 61.5
- Pennsylvania – 49.4
- Virginia – 33.0
- Wisconsin – 48.9
The longest field goal in NFL history was 64 yards.
Biden winning Oregon is a 35.3 yard field goal
To put this in perspective, Biden winning California and Oregon are about 12 and 35.3 yard field goals respectively. Biden winning Indiana and Wyoming are about 85.4 and 102 yard field goals, respectively.
Finally, overall Biden’s chances of winning right now are about a 48.9 yard field goal. Sometimes kickers miss 48.9 yard field goals!
Cheers.
Rabbit Hole – Episode 1 : Tideglusib
So, a while ago I tweeted out asking for podcast ideas. Didn’t really think I’d get anything too interesting back, but David Hess had a great suggestion: I go to a random wikipedia page and then just see where it goes. I think this is a brilliant idea, and I’m stealing it for myself. I’m calling this “Rabbit Hole” and it will be broadcast live on Twitch. It’s perfect for me because it takes absolutely no planning and I can just do it whenever. I did it for the first time last night. (Full video is here). Here is a recap of last nights episode.
We started here: Tideglusib
Tideglusib is a GSK-3 inhibitor. Which apparently has something to do with Bipolar disorder. This made me looks up why they changed the name from “manic depression” to “bipolar disorder”
That page led me to…..the Animaniacs.

Where I watched the 50 state capitals video and the Nations of the World video. In that second video they sing the lyric “both Yemens”. Apparently from 1967 to 1990 there were two Yemens! I had no idea!
Note: Animaniacs aired from 1993 to 1998. So the song was WRONG.
I then wondered who did the voice of Yakko. It’s a guy named Rob Paulsen. He was also the voice of the Teenage Mutant Ninja Turtle Raphael! He also the guy from this classic “Got Milk” commercial! (He was a Hamilton fan before it was cool……)
Then this picture happened and I needed to look up Anthrocon.

Here is the Fursuit parade from Anthrocon 2019. It’s…..something.
So then I started reading about furries, as one does…..and apparently, there is some actual academic work being done studying furry culture. I found and started reading this paper from the journal Animals and Society. Which led me here when I was trying to figure out the difference between pan-sexual and omni-sexual.
In that furry study, they were doing some statistical tests to see if there were differences in proportions of gay, straight, and bisexual people who are involved in furry culture. What they tested was if all the proportions were the same. I didn’t think that made sense and it would have been better to compare to the proportions in the general population. So I went and looked up what the proportions are in the general population. Interestingly, Americans tend to over estimate the size of the U.S. gay population. (Guess what it is an see how close you are. I wasn’t too far off, but I did over estimate it).
This led me to thinking about how you estimate the size of hard to reach populations and I remembered seeing work done in the past about leveraging social networks to estimate population size. Here is some work by Tyler McCormick on this exact topic: Network-Based Methods for Accessing Hard-to-Reach Populations Using Standard Surveys.
Then the baby started crying. I’m definitely doing this again. I had a lot of fun doing it. I don’t even care if you watch. But I’d prefer if you did.
Cheers.
Let’s check in on how full of shit Clay Travis is
Is Clay Travis still full of shit? Yes.
On March 18, 2020 Clay Travis, notable for being NOT an epidemiologist, posted an article with this headline:
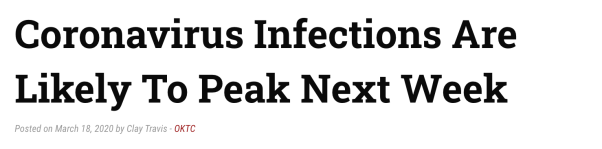
In that article he said this:
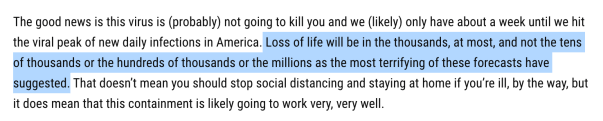
Well, we are currently nearing 80,000 deaths.

So, from the bottom of my heart: Fuck you, Clay Travis.
Cheers.
