
What will the electoral map look like according to PredictIt markets?
Based on @predictit markets of each state right now (noon on November 5, 2016) Clinton has a 78.77% chance of winning assuming state vote outcomes are independent, which is not a reasonable assumption. Accounting for correlation between the states in their voting patterns and using the derived prices from the market, Clinton has a 66.98% chance to win the election. Below you can see how these probabilities have evolved over time since August and below that you can see a plot of the distribution of electoral votes for each candidate predicted by the markets based on different assumptions about the correlation between states.


Based on these distribution of electoral votes, let’s take a look at some electoral maps that this model is predicting are the most likely.
But first, let’s talk about correlation between states voting habits so that these maps will make a bit more sense when we look at them. As mentioned before, the assumption of independence between the states is not a reasonable assumption. Below is a corrplot of the percentages of Democratic vote for each state going back to the 1972 presidential election. You can see that states’ vote percentages are highly correlated with each other:

If we look only at swing states we get this: 
States like Arizona, Nevada, Colorado and New Hampshire are highly correlated with each other as are Florida and Ohio. Generally, as you get a higher percentage in Florida, you get a higher percentage in Ohio. Based on these correlation matrices, I thought it would be interesting to look at a principal component analysis of this correlation matrix. Below is the plot of the loadings for each of the 50 states. It appears that the first dimension is explained by blue vs red state where you have states like California, Vermont, and Connecticut to the far left and states like West Virginia, Kentucky, and Alaska on the far right. The second dimension is less clear to me, but I’m going to say that it has to do with regional differences. States that show up large on the second component are states like South Dakota, North Dakota, Montana, Utah, Idaho, Wyoming, Nebraska, and Alabama. Most of these states, with the exception of Alabama are sort of the northern red states. The other side of the second components contains states like Mississippi, South Carolina, Georgia, Florida, Virginia, Maryland, Tennessee, and Alaska. With the exception of Alaska, these are all southern mostly red states.

What all of this means is that the assumption of independence between states is very unreasonable and that winning one state like Florida makes it more likely to win a state like Ohio. So I’m going to look at the most likely maps based on my correlation model. (I should not that I’m not dealing with the nuances of Maine or Nebraska. I’m assuming whoever wins the states gets all the electoral votes, which isn’t the case.)
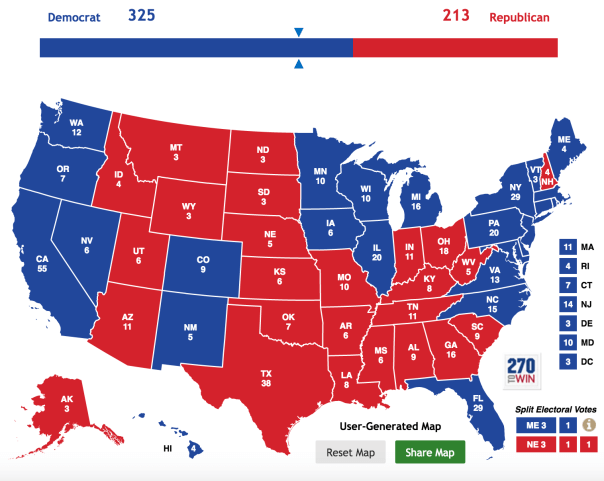
The most likely map according to the PredictIt markets and my model gives Clinton 358 electoral votes and has about a 7.13% chance of occurring. That map looks like this: 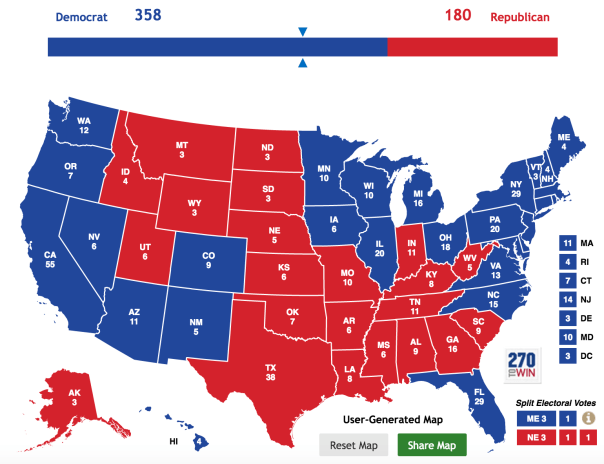
Now you might say, “Wait a second Greg, Trump is winning in Ohio.” And I would agree with that. However, Ohio is solidly in the category of swing state and is highly correlated with places like Pennsylvania and Florida which Clinton is winning and (probably) winning. Basically in a generic race (which this is not), a candidate who gets Pennsylvania and Florida will likely also get Ohio. Let’s keep going and look at a whole bunch of other plausible maps that my model predicts as the most likely.
This next map has about a 5.55% chance of happening. This map is the same as before, except that Clinton loses Arizona and Ohio and gets to 323 electoral votes.

The next most likely map gets Clinton to 352 electoral votes and has about a 3.16% chance of occurring. Here are two different ways for Clinton to get to 352 electoral votes with the second map being a bit more plausible:


After this you get a map with 279 electoral votes for Clinton which has about a 2.8% chance of occurring. In this scenario, Clinton loses Ohio, Florida, AND North Carolina and STILL WINS. This map is a really good illustration of how Trump can basically have a ton go right for him on election day and still lose this election.

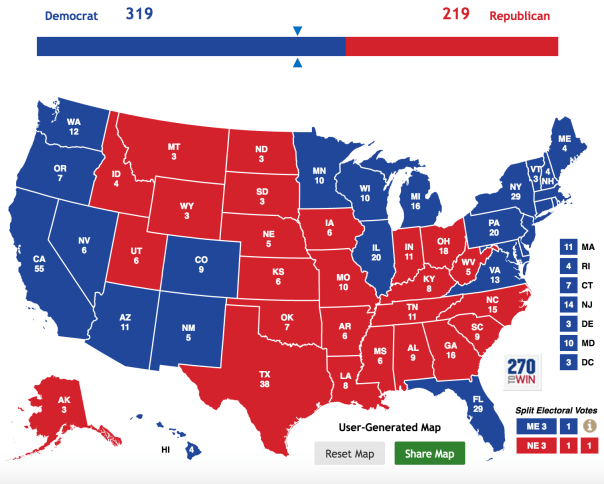
Next we have a map with 319 electoral votes for Clinton which has a 2.24% chance of occurring. That looks like this:
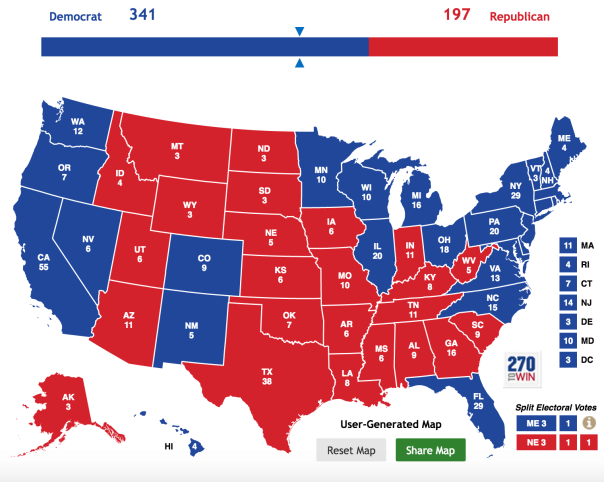
The next most plausible map at about 1.94% is with Clinton at 341 electoral votes. That would look like this:
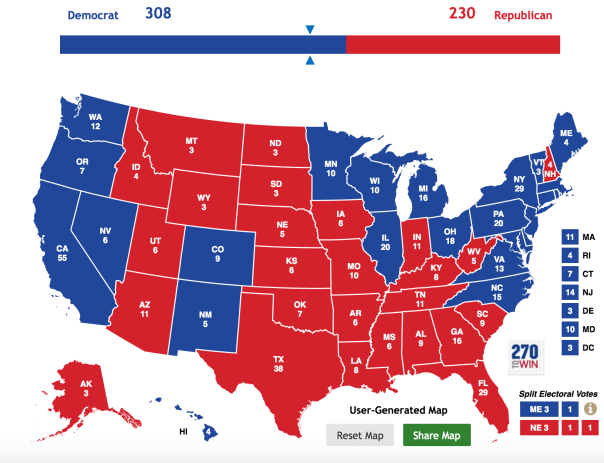
The next three most likely maps have Clinton at 308, 329, and 325 with a 1.86%, 1.56%, and 1.31% chance of occurring, respectively. Those maps look like this.

There is about a 27.6% chance that one of these vote totals hit according to my model and the PredictIt markets. The next most plausible map get’s Clinton to only 259 electoral votes and is the most likely path to a Trump victory. This map has about a 1.31% chance of occurring. In this scenario, Trump wins Ohio, Florida, North Carolina, AND Pennsylvania. This seems unlikely at this point, but it’s still a real possibility. That map looks like this:

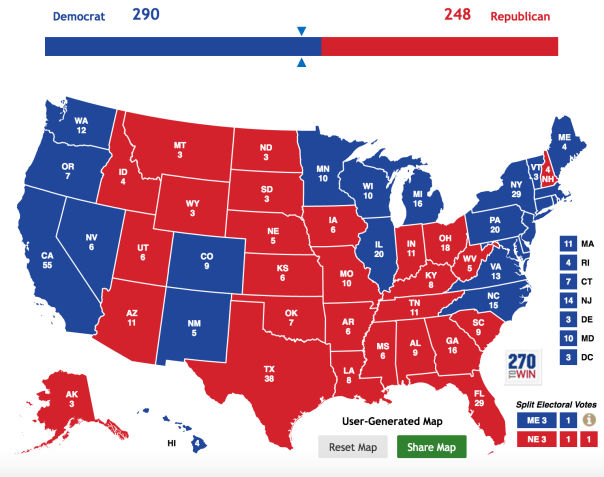
Let’s look at 3 more plausible maps. The next two most likely would look like this with Clinton getting 290 and 343 electoral votes, respectively.

The next most likely vote total has Clinton at 182, good for a Trump win, with about 1.19% chance of occurring. This map represents Trumps best chance at a blowout win where he wins Florida, North Carolina, Ohio, Virginia, Pennsylvania, New Hampshire, Wisconsin, Minnesota, Michigan, Nevada, Arizona, and, just for the sake of it, Maine, too. While this map does seem unlikely, if Trump does manage to win one of Michigan ,Wisconsin, or Minnesota, those states tend to vote similarly and he could end up winning or losing all of them together. That map would look like this:

So far we have looked at 14 of the most plausible electoral vote totals. If we add up these probabilities we see that there is about a 32.67% chance that one of these vote totals is correct.
To end this, I wanted to look at some totally implausible maps that still occurred in my simulations. I simulated the election 50,000 times and these maps occurred exactly once in the simulation:


Cheers.
NFL Rankings – Week 8
|
Playoff Probabilities – Week 8
|
NFL Picks – Week 8
Green Bay at Atlanta
Prediction: Packers 25-24 (54.3%)
Pick: Packers +3
Total: Under 52
New England at Buffalo
Prediction: Patriots 24-22 (55.0%)
Pick: Bills +6
Total: Under 47
Arizona at Carolina
Prediction: Panthers 23-21 (55.5%)
Pick: Cardinals +3
Total: Under 47.5
Minnesota at Chicago
Prediction: Vikings 21-20 (51.0%)
Pick: Bears +4.5
Total: Over 41
Washington at Cincinnati
Prediction: Bengals 25-20 (63.5%)
Pick: Bengals -3
Total: Under 49.5
NY Jets at Cleveland
Prediction: Jets 22-21 (54.1%)
Pick: Browns +3 PUSH
Total: Under 43.5
Philadelphia at Dallas
Prediction: Cowboys 24-22 (55.0%)
Pick: Eagles +5
Total: Over 43
San Diego at Denver
Prediction: Broncos 25-20 (64.6%)
Pick: Broncos -4.5
Total: Over 43.5
Detroit at Houston
Prediction: Texans 22-20 (56.0%)
Pick: Lions +2.5
Total: Under 46
Kansas City at Indianapolis
Prediction: Chiefs 23-22 (50.2%)
Pick: Colts +3
Total: Under 50
Seattle at New Orleans
Prediction: Seahawks 25-23 (56.5%)
Pick: Saints +2.5
Total: Over 48
Oakland at Tampa Bay
Prediction: Buccaneers 23-21 (55.2%)
Pick: Buccaneers EVEN
Total: Under 49
Jacksonville at Tennessee
Prediction: Titans 23-20 (57.8%)
Pick: Jaguars +3.5
Total: Under 44
Is it November 9 yet? Nope.
Below is a plot of the two major presidential candidates probability of winning over the course of time. Clinton has plummeted in the past few days thanks in part to, and you can’t make this up, the FBI investigating Mark Weiner. Clinton is still a heavy favorite to win the election, however. (In fact, I guarantee it). This plot is based on state electoral markets on predictit.org. 
Some of the state markets, however, I think are probably priced incorrectly. For instance, California isn’t at a dollar. We can all be sure that California is going Democrat. Likewise, Oklahoma isn’t going Democrat. There isn’t even a 3% chance of it. So I re-did the plot and left only toss up states with win probabilities that weren’t either 0 or 1. I gave Hawaii, Maryland, Vermont, California, Massachusetts, New York, Rhode Island, Delaware, Illinois, New Jersey, Connecticut, Oregon, Virginia, New Mexico, and Minnesota to Clinto with probability 1 and Nebraska, Wyoming, West Virginia, Oklahoma, Kentucky, Alabama, North Dakota, South Dakota, Arkansas, Kansas, Tennessee, Montana, Louisiana, Utah, Alaska, Mississippi, Texas, and South Carolina to Trump with probability 1 (though I think I’m being generous here). All other win probabilities were based on the state markets. That plot looks like this:

Clinton’s chances of winning are only improved by about half a percent by modeling the election this way. The plot based entirely on the state electoral markets looks like this: 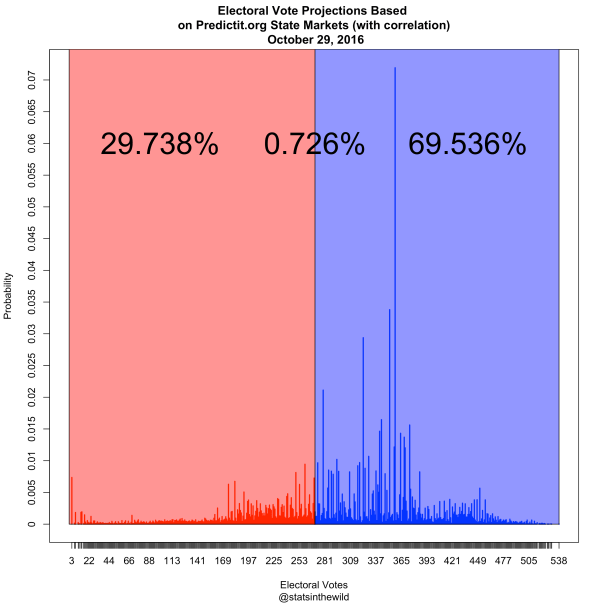
On a sort of unrelated note, it really is bizarre how we elect our president. There are like 3-5 states that actually matter and like 75% of people in those states have already made up their mind which party they will vote for before we even know who the candidates are. So the president is really elected by a small group of people from a small group of states to represent all Americans. Very bizarre.
Cheers.
The Cleveland Indians’ playoff run just saved America from Donald Trump.
Back on September 15, I told you that I had a model that has accurately predicted 16 out of the last 17 presidential elections. (That’s only 1 miss since 1948!!!! And 1948 was a long time ago!!!) Anyway, as you know that model was based on three simple tests:
1. The Phillies win less than 92.
2. The Indians win less than 97 games.
3. The Red Sox win at least 75 games.
If all of these are true then the Republican wins. Well, The Phillies ended with 71 wins, Cleveland ended with 94 wins, and the Red Sox ended with 93 wins. Check. Check. And Check. Good bye America. Hello Donald Trump.
But wait!!!! The Indians have won an additional 9 games in the playoffs bringing their season win total to 106 wins!!! Hillary is going to win. America has been saved by the Cleveland Indians!!
Cheers.
NFL Picks – Week 7
Seattle at Arizona
Prediction: Seahawks 22-20 (57.7%)
Pick: Seattle +1
Total: Under 43.5
San Diego at Atlanta
Prediction: Falcons 25-23 (53.7%)
Pick: Chargers +5.5
Total: Under 53
Cleveland at Cincinnati
Prediction: Bengals 25-18 (68.1%)
Pick: Browns +11
Total: Under 46.5
Houston at Denver
Prediction: Broncos 24-19 (64.9%)
Pick: Texans +8.5
Total: Over 40.5
Washington at Detroit
Prediction: Lions 25-20 (61.6%)
Pick: Lions +1
Total: Under 50
Chicago at Green Bay
Prediction: Packers 26-20 (67.8%)
Pick: Bears +9.5
Total: Under 47
Oakland at Jacksonville
Prediction: Raiders 21-20 (50.1%)
Pick: Raiders +2
Total: Under 47.5
New Orleans at Kansas City
Prediction: Chiefs 26-23 (57.8%)
Pick: Saints +6.5
Total: Under 51.5
Buffalo at Miami
Prediction: Dolphins 22-21 (52.8%)
Pick: Dolphins +2.5
Total: Under 45.5
Baltimore at New York Jets
Prediction: Jets 21-20 (54.0%)
Pick: Ravens +2
Total: Over 40 PUSH
Minnesota at Philadelphia
Prediction: Eagles 24-23 (53.8%)
Pick: Eagles +3
Total: Over 39
New England at Pittsburgh
Prediction: Patriots 25-24 (50.7%)
Pick: Steelers +7.5
Total: Over 48.5
Tampa Bay at San Francisco
Prediction: 49ers 22-19 (60.4%)
Pick: 49ers -1
Total: Under 45.5
New York Giants at Los Angeles (nee St. Louis)
Prediction: Rams 22-21 (54.0%)
Pick: Rams +3
Total: Under 45.5
Indianapolis at Tennessee
Prediction: Colts 23-21 (54.1%)
Pick: Colts +4
Total: Under 48.5
NFL Rankings – Week 7
|
Predicted NFL Standings – Week 6
Projected Standings
AFC
AFC East
New England: 10-6 (4-1) 10.074
Buffalo: 8-8 (3-2) 8.391
NY Jets: 7-9 (1-4) 6.941
Miami: 5-11 (1-4) 5.033
AFC North
Pittsburgh: 10-6 (4-1) 10.316
Cincinnati: 8-8 (2-3) 8.394
Baltimore: 7-9 (3-2) 7.145
Cleveland: 3-13 (0-5) 2.936
AFC South
Houston: 8-8 (3-2) 7.881
Indianapolis: 7-9 (2-3) 7.295
Tennessee: 6-10 (2-3) 5.996
Jacksonville: 4-12 (1-3) 4.211
AFC West
Denver: 10-6 (4-1) 10.347
Kansas City: 8-8 (2-2) 8.140
Oakland: 7-9 (4-1) 7.012
San Diego: 7-9 (2-4) 6.923
NFC
NFC East
Dallas: 9-7 (4-1) 9.426
Philadelphia: 8-8 (3-1) 8.183
Washington: 6-10 (3-2) 6.421
NY Giants: 6-10 (2-3) 6.267
NFC North
Green Bay: 11-5 (3-1) 10.787
Minnesota: 10-6 (5-0) 9.893
Detroit: 7-9 (2-3) 6.982
Chicago: 6-10 (1-4) 5.910
NFC South
Atlanta: 9-7 (4-1) 9.059
Carolina: 9-7 (1-4) 8.512
New Orleans: 7-9 (1-3) 6.596
Tampa Bay: 5-11 (2-3) 4.813
NFC West
Seattle: 11-5 (3-1) 11.037
Arizona: 8-8 (2-3) 8.355
Los Angeles (nee St. Louis): 7-9 (3-2) 6.758
San Francisco: 4-12 (1-4) 3.966
Team – Median Predicted Record (Actual Record) Expected Wins
Italics: Projected playoff team
Projected Playoffs
AFC
- Denver
- Pittsburgh
- New England
- Houston
- Cincinnati
- Buffalo
NFC
- Seattle
- Green Bay
- Dallas
- Atlanta
- Minnesota
- Carolina3
NFL Picks – Week 6
Denver at San Diego
Prediction: Broncos 24-22 (67.8%)
Pick: Chargers +3
Total: Over 45.5
San Francisco at Buffalo
Prediction: Bills 21-19 (68.4%)
Pick: 49ers +8
Total: Under 44.5
Jacksonville at Chicago
Prediction: Bears 24-20 (81.4%)
Pick: Bears -2
Total: Under 44.5
Los Angeles at Detroit
Prediction: Lions 23-20 (77.2%)
Pick: Rams +3.5
Total: Under 43.5
Indianapolis at Houston
Prediction: Texans 23-21 (62.8%)
Pick: Colts +3 PUSH
Total: Under 46
Pittsburgh at Miami
Prediction: Steelers 24-22 (66.1%)
Pick: Dolphins +7.5
Total: Under 47.5
Cincinnati at New England
Prediction: Patriots 25-22 (74.6%)
Pick: Bengals +8.5
Total: Under 47
Carolina at New Orleans
Prediction: Saints 25-24 (51.8%)
Pick: Saints +3.5
Total: Under 53
Dallas at Green Bay
Prediction: Packets 25-21
Pick: Packers -4
Total: Under 47
Baltimore at NY Giants
Prediction: Giants 22-21 (56.4%)
Pick: Ravens +3
Total: Under 44.5
Kansas City at Oakland
Prediction: Chiefs 22-21 (62.0%)
Pick: Chiefs +1
Total: Under 47
Atlanta at Seattle
Prediction: Seahawks 26-20 (88.7%)
Pick: Seahawks -6
Total: Under 46
Cleveland at Tennessee
Prediction: Titans 22-21 (62.4%)
Pick: Browns +7
Total: Under 45.5
Philadelphia at Washington
Prediction: Eagles 24-23 (60.6%)
Pick: Washington Football Team +2
Total: Over 45
NY Jets at Arizona
Prediction: Cardinals 23-20 (77.7%)
Pick: Jets +7.5
Total: Under 47
