My NCAA Top 25
2014 NCAA Football Standings
Updated September 29, 2014
|
Language Log on “specificity” and “sensitivity”
I can finally say that I no longer need to look these two thins up. #progress #experience
Language Log on “specificity” and “sensitivity” as (poorly chosen words for) properties of medical tests. Mark Liberman asks: why not just call them true positive rate and true negative rate. With the classic “what’s the probability that you got the disease, given that you tested positive?” problem thrown in; you’ve seen this if you ever learned Bayes’ theorem.
NFL Picks – Week 4
Total (weeks 1-3) – SU: 39-22-0 ATS: 32-27-2 O/U: 36-25-0
Week 1 – SU: 10-6-0 ATS: 8-8-0 O/U: 13-3-0
Week 2 – SU: 10-6-0 ATS: 10-6-0 O/U: 10-6-0
Week 3 – SU: 12-4-0 ATS: 9-6-1 O/U: 8-8-0
Week 4 – SU: 7-6-0 ATS: 5-7-1 O/U: 5-8-0
NY Giants at Washington
Prediction: Washington Football Team 23-21 (55.4%)
Pick: Giants +3.5 (54.6%)
Total: Under 46.5
Carolina at Baltimore
Prediction: Ravens 23-20 (56.4%)
Pick: Panthers +3 (51.2%)
Total: Over 41
Green Bay at Chicago
Prediction: Bears 23-22 (52.9%)
Pick: Bears +1.5 (57.1%)
Total: Under 50.5
Buffalo at Houston
Prediction: Texans 24-19 (63.3%)
Pick: Texans -3 (55.0%)
Total: Over 41.5
Tennessee at Indianapolis
Prediction: Colts 24-21 (57.7%)
Pick: Titans +7.5 (63.4%)
Total: Under 46
Atlanta at Minnesota
Prediction: Falcons 23-22 (53.3%)
Pick: Vikings +3 (55.2%)
Total: Under 47
Detroit at NY Jets
Prediction: Lions 22-21 (52.5%)
Pick: Jets +2 (53.15%)
Total: Under 45
Miami at Oakland
Prediction: Dolphins 21-20 (52.6%)
Pick: Raiders +4 (58.8%)
Total: Over 40.5
Tampa Bay at Pittsburgh
Prediction: Steelers 23-18 (52.9%)
Pick: Buccaneers +7.5 (57.2%)
Total: Under 45.5
Jacksonville at San Diego
Prediction: Chargers 26-17 (73.8%)
Pick: Jaguars +13.5 (62.9%)
Total: Under 45
Philadelphia at San Francisco
Prediction: 49ers 25-20 (63.3%)
Pick: Eagles +5 (50.7%) PUSH
Total: Under 51
New Orleans at Dallas
Prediction: Saints 26-25 (51.5%)
Pick: Cowboys +3 (57.0%)
Total: Under 53.5
New England at Kansas City
Prediction: Patriots 25-21 (60.5%)
Pick: Patriots -3.5 (50.6%)
Total: Over 46
How the 538 model works
Here’s a explanation by Nate Silver of how his Senate prediction model works. 10,000 words, and denser than the typical FiveThirtyEight post, but it’s food for thought if you’ve been curious about what’s going on under the hood of FiveThirtyEight’s flagship product.
Make sure to click through to the footnotes – lots of links to subsidiary analyses from the past that explicate some of the interesting tidbits Silver and co. have built up over time.
Which sport?
I went the the Cubs game today against the Dodgers. I got to see Clayton Kershaw pitch (Awesome) and watch the Cubs get destroyed (Expected). It was 14-3 going into the 9th inning and some people were joking that a touchdown would get the Cubs right back in the game. (The Cubs “rallied” for two in the 9th to ultimately lose 14-5.)
But, this got me thinking. 14-3 does look like a football score, but 14-5 is clearly not. On the train back to school, I came up with this question: If all you knew about a game was the score, which sport would you guess generated that score?
To answer this question, I scraped the scores of (almost) all of the baseball and hockey games from 2000-2014, and I found a table of all NFL scores all-time. (I haven’t exhaustively scraped every single NHL and MLB game ever because 1) I don’t think the results will change much and 2) what I did was good enough for Friday night.) I then counted how often a specific score occurred each of the three sports (I did consider basketball, but it’s not really that interesting here) and converted that count to a percentage. Then for each score, I assigned the sport with the highest percentage of that score. The graphic below shows the results of this. If you click on the image, you can zoom in on it for more detail. 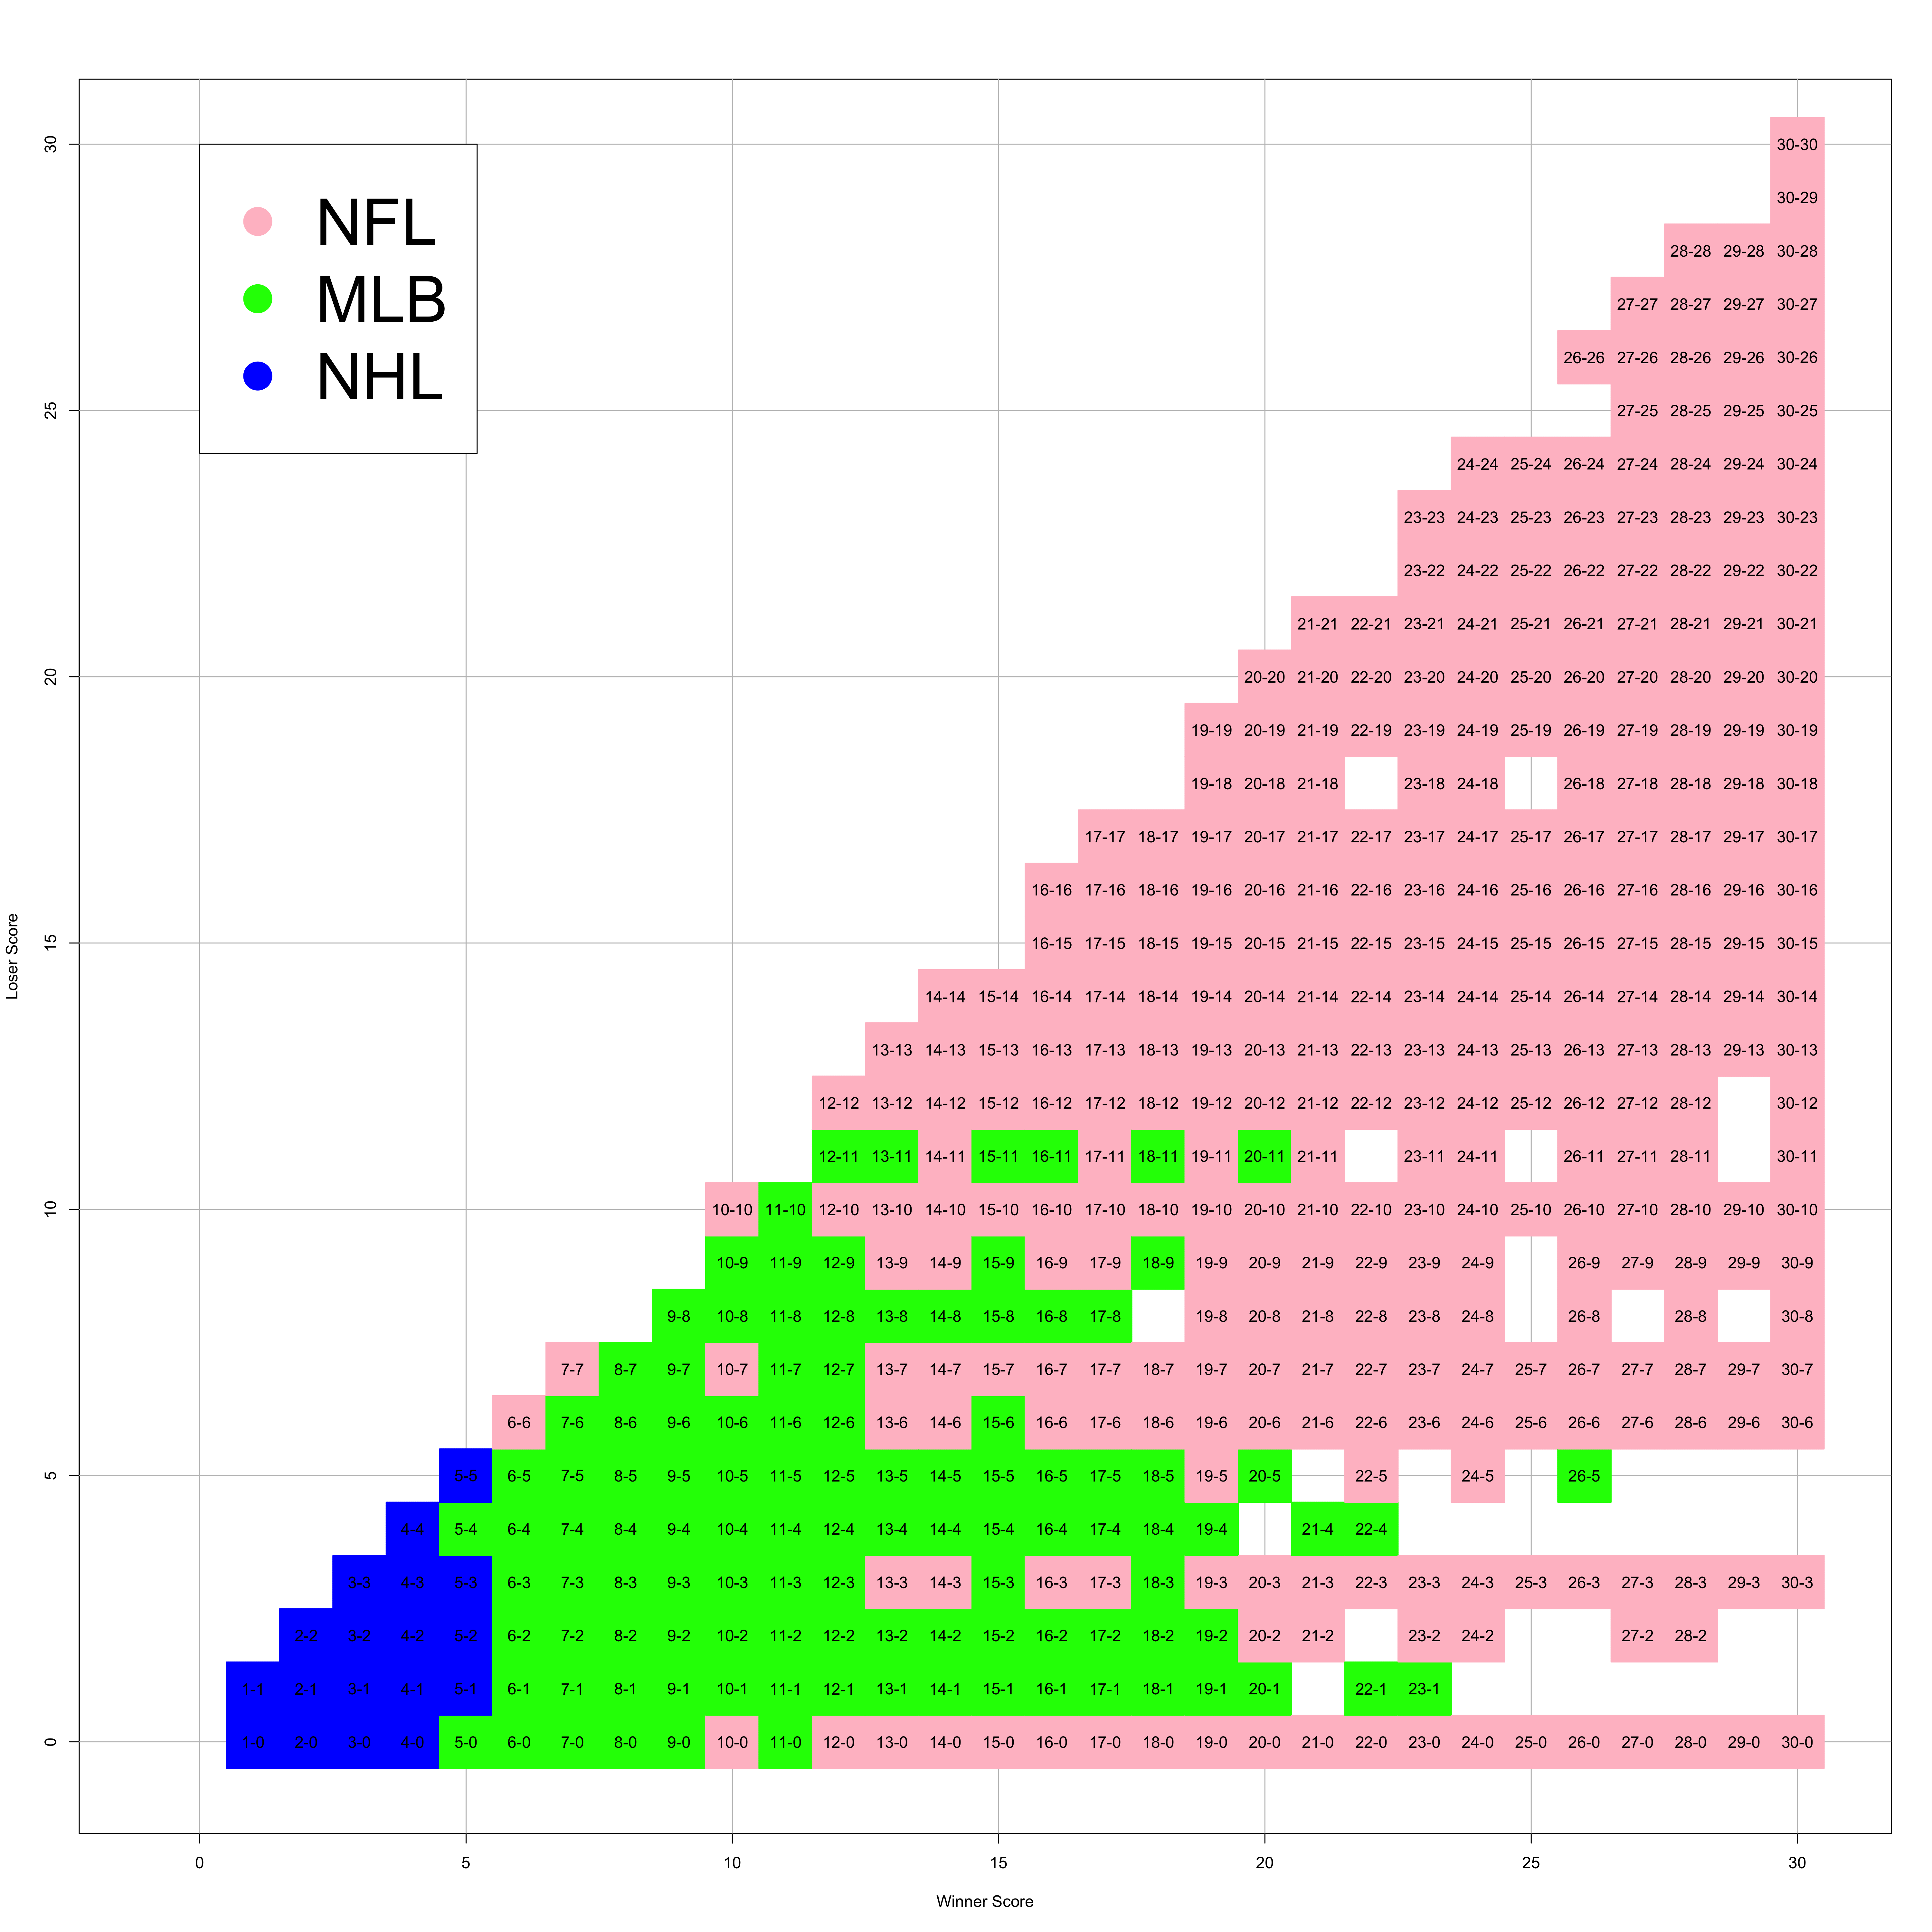
Some interesting things:
- If the winner scores 4 or fewer goals, those games belong to hockey.
- Additionally hockey gets 5-1, 5-2, 5-3, and 5-5. 5-0 and 5-4 are baseball scores though.
- If the winner scores between 6 and 9 runs, those games all belong to baseball. (With 6-6 and 7-7 ties belonging to football.
- Every shut out where the winner scores 12 or more (12-0, 13-0, etc.) belongs to football. Football also gets 10-0, but 11-0 belongs to baseball.
- In fact, any game where the winner scores 11 belongs to baseball.
- 18-8 is the lowest score combination to not be in my data set. This means that this score has never occurred in the NFL and has (likely) not occurred in the NHL or MLB since 2000.
- If the losing team score 10 points, the game belongs to football EXCEPT if the score is 11-10.
- If the losing team scores 12 or more points, it’s always football.
Cheers!
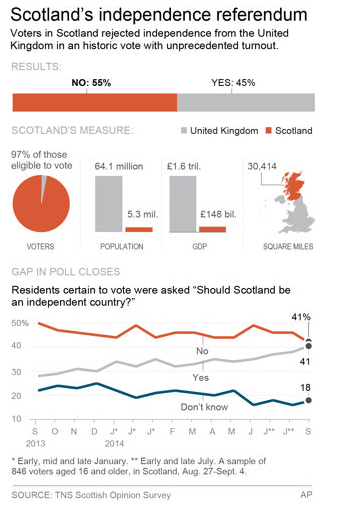
Confusing Scotland pie chart
In the graphic below (from this article), the orange represent Scotland and the gray represents the United Kingdom. So in the result bar this make sense: 55% voted for Scotland to be independent and 45% voted to stay in the United Kingdom.
For population and GDP, I think this also makes sense. For instance, the United Kingdom has a population of 64.1 million and Scotland has a mere 5.3 million.
The map of the UK get’s a little bit more confusing. The way this is colored Scotland is clearly the orange here, but it looks like to United Kingdom is only the gray part when, in fact, the UK is both the gray and the orange. I would have made Scotland orange and gray striped to indicate that Scotland is both Scotland AND part of the UK.
Finally, the pie chart. This is a puzzle to me. I’m not really sure what they are trying to say here. Maybe I’m missing something, but it looks like what this is saying is that Scotland, who has a small fraction of the total population of the United Kingdom has a full 97% of the eligible voters and the United Kingdom has only 3%. That’s clearly not true. So what is that pie chart trying to say exactly? I really have no idea. (Please let me know if you know what it is trying to say. I really have no idea.)
But no matter what the answer is, can’t we all agree we shouldn’t be using pie charts at all?
Cheers.
Analyzing the SuperContest
This fall, the Westgate Las Vegas Hotel Casino is hosting the prestigious SuperContest, in which entrants pony up $1500 to pick 5 games a week against the spread. At season’s end, standings are judged by which entrants have the highest number of correctly picked games.
Last year’s winner was David Frohardt-Lane, who took home about $550k for first place. Perhaps not surprisingly, Frohardt-Lane is a statistician!
One of the neat aspects about the SuperContest is that the picks of all 1,403 of the 2014 entrants are posted immediately after the games begin (here). Even better, the data is fairly clean and easy to play with (at least so far).
That said, there are some very intriguing and potentially difficult questions to answer from a statistical perspective: How to account for the fact that people only pick 5 games per week? What about bye weeks? Do entrants pick each week seemingly…
View original post 323 more words
NFL Picks – Week 3
Total – SU: 32-16-0 (66.67%) ATS: 27-20-1 (57.29% +5 Units) O/U: 31-17-0 (64.58% +12.3 Units)
Week 1 – SU: 10-6-0 ATS: 8-8-0 O/U: 13-3-0
Week 2 – SU: 10-6-0 ATS: 10-6-0 O/U: 10-6-0
Week 3 – SU: 12-4-0 ATS: 9-6-1 O/U: 8-8
Tampa Bay at Atlanta
Prediction: Falcons 24-20 (62.5%)
Pick: Buccaneers +6.5 (55.8%)
Total: Under 45
San Francisco at Arizona
Prediction: 49ers 22-20 (55.9%)
Pick: Cardinals +3 (52.7%)
Total: Under 42.5
San Diego at Buffalo
Prediction: Bills 23-22 (51.8%)
Pick: Chargers +2.5 (55.3%)
Total: Over 44.5
Tennessee at Cincinnati
Prediction: Bengals 24-19 (64.5%)
Pick: Titans +7 (55.1%)
Total: Under 43.5
Baltimore at Cleveland
Prediction: Ravens 22-21 (53.5%)
Pick: Browns +2 (52.2%) PUSH
Total: Over 42
Green Bay at Detroit
Prediction: Lions 25-24 (53.4%)
Pick: Lions -1 (50.5%)
Total: Under 52.5
Indianapolis at Jacksonville
Prediction: Colts 23-20 (57.4%)
Pick: Jaguars +7 (62.3%)
Total: Under 45.5
Kansas City at Miami
Prediction: Dolphins 21-19 (55.9%)
Pick: Chiefs +5 (58.2%)
Total: Under 41.5
Oakland at New England
Prediction: Patriots 29-19 (77.2%)
Pick: Raiders +14.5 (61.5%)
Total: Over 47
Minnesota at New Orleans
Prediction: Saints 27-20 (68.3%)
Pick: Vikings +9.5 (58.0%)
Total: Under 51
Houston at NY Giants
Prediction: Giants 22-21 (51.1%)
Pick: Giants +2.5 (58.2%)
Total: Over 42
Washington at Philadelphia
Prediction: Eagles 25-22 (59.8%)
Pick: Washington Football Team +6.5 (58.6%)
Total: Under 50
Denver at Seattle
Prediction: Seahawks 24-22 (54.6%)
Pick: Broncos +4.5 (58.2%)
Total: Under 49
Dallas at St. Louis
Prediction: Cowboys 23-22 (53.0%)
Pick: Rams +2 (52.7%)
Total: Under 45.5
Pittsburgh at Carolina
Prediction: Panthers 23-20 (59.4%)
Pick: Steelers +3.5 (50.5%)
Total: Over 41.5
Chicago at NY Jets
Prediction: Bears 21-20
Pick: Bears +2.5 (60.1%)
Total: Under 45.5
538 is six months old…where does it stand?
Wednesday marks the six-month anniversary of Nate Silver’s FiveThirtyEight launch with ESPN.
As the site mixes statistics, sports, data visualization, and academic research, it’s been a must-read on nearly a daily basis for me.
Here’s my unsolicited and slightly ambiguous view of where things stand:
It’s really, really hard to do what FiveThirtyEight is trying to do and to do it well.
Here’s why:
FiveThirtyEight’s business model is primarily based on advertising, and advertisers generally don’t flock to sites that only spit out content once a week. As a result, Silver and colleagues are forced to put out articles at a frenetic pace. As one example, I estimated that FiveThirtyEight wrote 2.5 articles per day covering the 2014 World Cup, posts which were generally written by only one or two full time writers. That’s an incredible pace.
But here’s the catch; while the judging of a data journalism website should be based on content alone, and…
View original post 1,199 more words
