Super Bowl Squares
Last year I wrote a post about super bowl squares:
I received an email this morning from a friend: “Is there any sort of a statistical breakdown for which are the best numbers to have in a Super Bowl squares pool (for entertainment purposes only)?”
Now, if my friend were going to use this information to gamble, it would be highly unethical. However, since he clearly stated that it was for “entertainment purposes only,” I feel that I can conduct a study with a clear conscience.
If he had wanted to gamble on it, here is a quick explanation of how that usually takes place. (According to that website: “Basically, if you are at a party where you don’t have betting squares you are a Communist.”)
Anyway, using data from football-reference.com I created a ten by ten frequency table (using R, of course) of exactly how many times each outcome has occurred in the history of the NFL.
Well, here is the updated graph, though it’s not really that much different than last years graph. (It looks to me like football-reference.com only has the scores page with counts updated through week 1 of the 2012 NFL regular season. )

Somethings to note:
- 2-2 is still the worst square by far. It’s only happened 5 times in the history of the league. The fair odds for this square are over 2800-to-1.
- The best squares are, no surprise, 7-0 and 0-7, occurring 582 and 577 times, respectively.
- The other great squares to have are in order, 0-3, 0-4, 4-7, and 7-4. All of these have occurred over 480 times each.
- These 6 outcomes (7-0, 0-7, 0-3, 0-4, 4-7, and 7-4) account for almost 23% of all the NFL games ever played.
The six (the count data from football-reference isn’t complete so the table says 5) games that ended in the 2-2 square all-time are:
- Toledo Maroons tie Milwaukee Badgers, 12-12. October 8, 1922.
- Green Bay Packers tie Chicago Bears, 12-12. September 30, 1928.
- Buffalo Bills over Houston Oilers, 22-12. October 8, 1961.
- Kansas City Chiefs over Cincinnati Bengals, 42-22. October 26, 1969.
- Buffalo Bills over Miami Dolphins, 42-32. December 5, 2004.
- Tampa Bay Buccaneers over Oakland Raiders, 42-32. November 4, 2012.
Cheers.
NCAA Basketball Rankings – 1/28/2013
Updated 1/28/2013 at 12:34pm
|
NFL Rankings – 1/28/2013
Updated 1/28/2012 at 12:34pm
| Team | Rank | Change | Record | ESPN | TeamRankings.com | SOS |
| San Francisco | 1 | ↑1 | 13-4-1 | 3 | 1 | 25 |
| New England | 2 | ↓1 | 13-5 | 4 | 6 | 17 |
| Seattle | 3 | – | 12-6 | 5 | 2 | 23 |
| Green Bay | 4 | ↑2 | 12-6 | 6 | 5 | 20 |
| Denver | 5 | – | 13-4 | 1 | 3 | 32 |
| Baltimore | 6 | ↑5 | 13-6 | 10 | 4 | 26 |
| Atlanta | 7 | ↓3 | 14-4 | 2 | 9 | 27 |
| NY Giants | 8 | ↑2 | 9-7 | 14 | 11 | 10 |
| Houston | 9 | ↓2 | 13-5 | 9 | 15 | 19 |
| Chicago | 10 | ↓2 | 10-6 | 13 | 13 | 8 |
| Minnesota | 11 | ↓1 | 10-7 | 12 | 7 | 13 |
| New Orleans | 12 | ↑4 | 7-9 | 19 | 16 | 29 |
| Cincinnati | 13 | – | 10-7 | 11 | 10 | 11 |
| Washington | 14 | ↓2 | 10-7 | 8 | 8 | 16 |
| Pittsburgh | 15 | ↑3 | 8-8 | 17 | 20 | 31 |
| St. Louis | 16 | ↑1 | 7-8-1 | 16 | 14 | 14 |
| Carolina | 17 | ↓3 | 7-9 | 18 | 12 | 2 |
| Tampa Bay | 18 | ↑2 | 7-9 | 21 | 19 | 28 |
| San Diego | 19 | ↑2 | 7-9 | 22 | 21 | 9 |
| Indianapolis | 20 | ↓5 | 11-6 | 7 | 17 | 4 |
| Dallas | 21 | ↓2 | 8-8 | 15 | 18 | 30 |
| Miami | 22 | – | 7-9 | 20 | 22 | 24 |
| Arizona | 23 | – | 5-11 | 27 | 26 | 3 |
| NY Jets | 24 | – | 6-10 | 25 | 27 | 22 |
| Buffalo | 25 | – | 6-10 | 23 | 24 | 1 |
| Detroit | 26 | – | 4-12 | 28 | 28 | 6 |
| Tennessee | 27 | – | 6-10 | 26 | 25 | 7 |
| Cleveland | 28 | – | 5-11 | 24 | 23 | 18 |
| Philadelphia | 29 | – | 4-12 | 29 | 29 | 12 |
| Oakland | 30 | – | 4-12 | 30 | 30 | 21 |
| Jacksonville | 31 | – | 2-14 | 31 | 32 | 15 |
| Kansas City | 32 | – | 2-14 | 32 | 31 | 5 |
Cheers.
NFL Predictions – Super Bowl
Overall Records for 2012
SU: 165-97-1
ATS: 143-119-1 (54.56%)
O/U: 129-127-3
Super Bowl
Baltimore Ravens at San Francisco 49ers
Prediction: 49ers win 23-20
Pick: Ravens +4.5
O/U: Under 48.5
NFL Predictions – Conference Championship Games
Playoffs – Conference Championship
Baltimore Ravens at New England Patriots
Prediction: Patriots win 30-24
Pick: Ravens +9.5
O/U: Over 51.5
San Francisco 49ers at Atlanta Falcons
Prediction: 49ers win 23-20
Pick: Atlanta +4.5
O/U: Under 48.5
NFL Rankings – 1/15/2013
Updated 1/15/2012 at 12:34pm
| Team | Rank | Change | Record | Projected Record | ESPN | TeamRankings.com | SOS | Prob Make Playoffs |
| New England | 1 | – | 13-4 | 13-4 | 4 | 2 | 25 | 100% |
| San Francisco | 2 | – | 12-4-1 | 12-4-1 | 3 | 1 | 17 | 100% |
| Seattle | 3 | – | 12-6 | 12-6 | 5 | 3 | 23 | 100% |
| Atlanta | 4 | ↑1 | 14-3 | 14-3 | 2 | 7 | 20 | 100% |
| Denver | 5 | ↓1 | 13-4 | 13-4 | 1 | 4 | 32 | 100% |
| Green Bay | 6 | – | 12-6 | 12-6 | 6 | 5 | 26 | 100% |
| Houston | 7 | – | 13-5 | 13-5 | 9 | 14 | 27 | 100% |
| Chicago | 8 | – | 10-6 | 10-6 | 13 | 10 | 10 | 0% |
| NY Giants | 9 | – | 9-7 | 9-7 | 14 | 11 | 19 | 0% |
| Minnesota | 10 | ↑1 | 10-7 | 10-7 | 12 | 6 | 8 | 100% |
| Baltimore | 11 | ↓1 | 12-6 | 12-6 | 10 | 8 | 13 | 100% |
| Washington | 12 | ↑1 | 10-7 | 10-7 | 8 | 9 | 29 | 100% |
| Cincinnati | 13 | ↑1 | 10-7 | 10-7 | 11 | 15 | 11 | 0% |
| Carolina | 14 | ↑3 | 7-9 | 7-9 | 18 | 12 | 16 | 100% |
| Indianapolis | 15 | ↑5 | 11-6 | 11-6 | 7 | 16 | 31 | 100% |
| New Orleans | 16 | ↓4 | 7-9 | 7-9 | 19 | 17 | 14 | 0% |
| St. Louis | 17 | ↓2 | 7-8-1 | 7-8-1 | 16 | 13 | 2 | 0% |
| Pittsburgh | 18 | ↓2 | 8-8 | 8-8 | 17 | 21 | 28 | 0% |
| Dallas | 19 | ↓1 | 8-8 | 8-8 | 15 | 18 | 9 | 0% |
| Tampa Bay | 20 | ↓1 | 7-9 | 7-9 | 21 | 19 | 4 | 0% |
| San Diego | 21 | – | 7-9 | 7-9 | 22 | 22 | 30 | 0% |
| Miami | 22 | – | 7-9 | 7-9 | 20 | 20 | 24 | 0% |
| Arizona | 23 | – | 5-11 | 5-11 | 27 | 26 | 3 | 0% |
| NY Jets | 24 | – | 6-10 | 6-10 | 25 | 27 | 22 | 0% |
| Buffalo | 25 | – | 6-10 | 6-10 | 23 | 23 | 1 | 0% |
| Detroit | 26 | – | 4-12 | 4-12 | 28 | 28 | 6 | 0% |
| Tennessee | 27 | – | 6-10 | 6-10 | 26 | 25 | 7 | 0% |
| Cleveland | 28 | – | 5-11 | 5-11 | 24 | 24 | 18 | 0% |
| Philadelphia | 29 | – | 4-12 | 4-12 | 29 | 29 | 12 | 0% |
| Oakland | 30 | – | 4-12 | 4-12 | 30 | 30 | 21 | 0% |
| Jacksonville | 31 | – | 2-14 | 2-14 | 31 | 32 | 15 | 0% |
| Kansas City | 32 | – | 2-14 | 2-14 | 32 | 31 | 5 | 0% |
Cheers.
NCAA Basketball Top 25 – 1/14/2012
|
Cheers.
Major League Baseball Hall of Fame Voting and Dimension Reduction
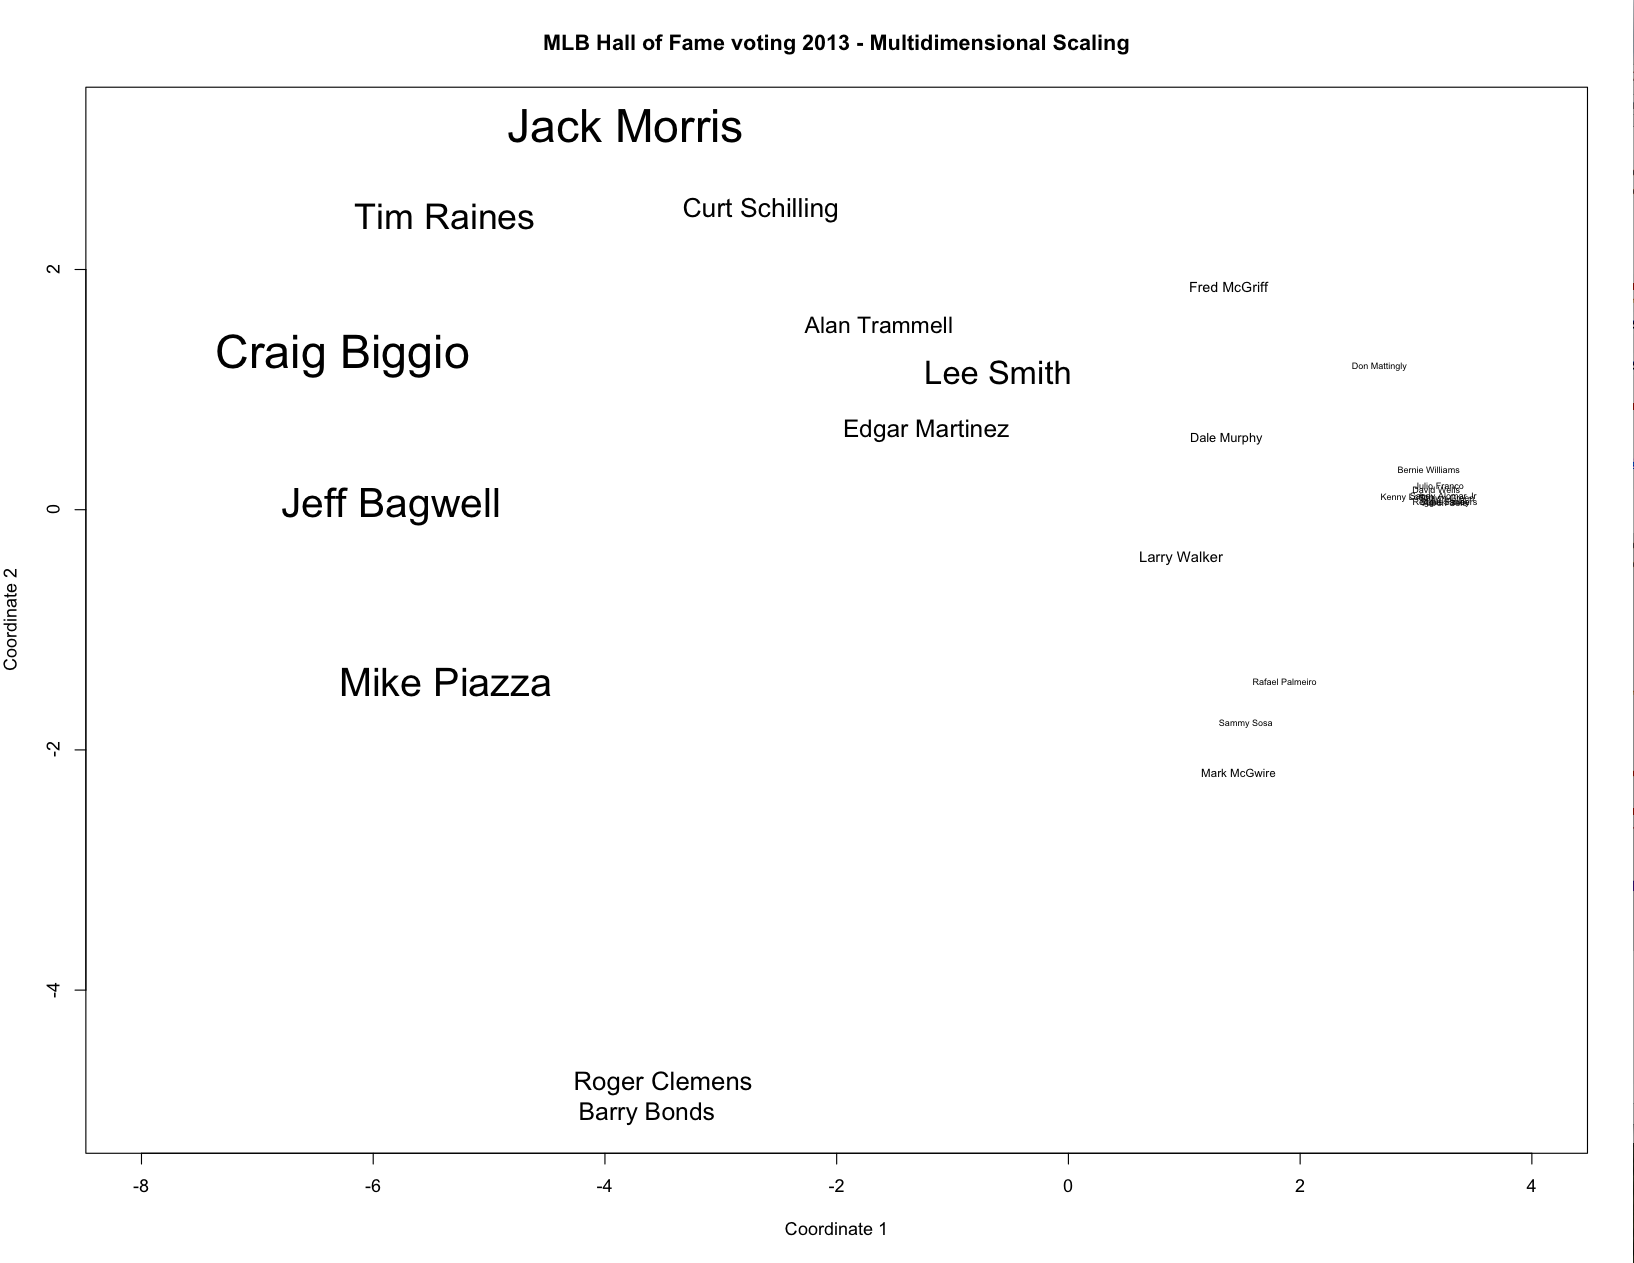
The major league baseball hall of fame votes came out yesterday. No one got in. The big issue that everyone is talking about is how to vote for players from the steroids era. Some voters don’t care and other voters are taking moral stands against players like Clemens and Bonds. Essentially, a vote for Bond was a vote for Clemens and can be visualized nicely in this heatmap. Just about everyone who voted for Clemens voted for Bonds. I wanted to look into this a little more. Using data from the ballots that are public (collected here (Thank you for collecting this)), I used some dimension reduction techniques to visualize both the variability between players and voters.
First, using the votes received by each player as a vector of ones and zeroes, the distance between each player can be calculated using a distance metric. The multidimensional scaling will project these distances onto a two dimensional surface so that the distances are preserved as well as possible. The image below shows the results, with the size of the players name relative to the number of votes they received on public ballots. The axes here don’t really have any clear interpretation, all we are interested in is how far apart two names are. You’ll immediately notice that Clemens and Bonds are right next to each other. In fact, I had to manually move Clemens name up slightly since Clemens name was literally on top of Bonds. The other manual adjustment I had to make was for the Lee Smith, Alan Trammell, Edgar Martinez cluster. These names were all right on top of each other, also. Overall, this seems to be display two separate issue in voting this year: how good you were and are you tainted by steroids. The closer a player is to the Bonds/Clemens group, the greater the smell of steroids and PEDs. The closest players to Bonds/Clemens are Piazza and Bagwell to the left and McGwire, Sosa, and Palmeiro on the right. The difference between Bagwell and Piazza vs McGwire, Sosa, and Palmeiro is the first group received more votes than the latter. So, generally speaking it looks like better players are further to the left and players associated with steroids and PEDs are closer to the bottom. Also, totally unrelated to anything, doesn’t this plot sort of resemble a heart? I’m not sure what that means. But I definitely see it.
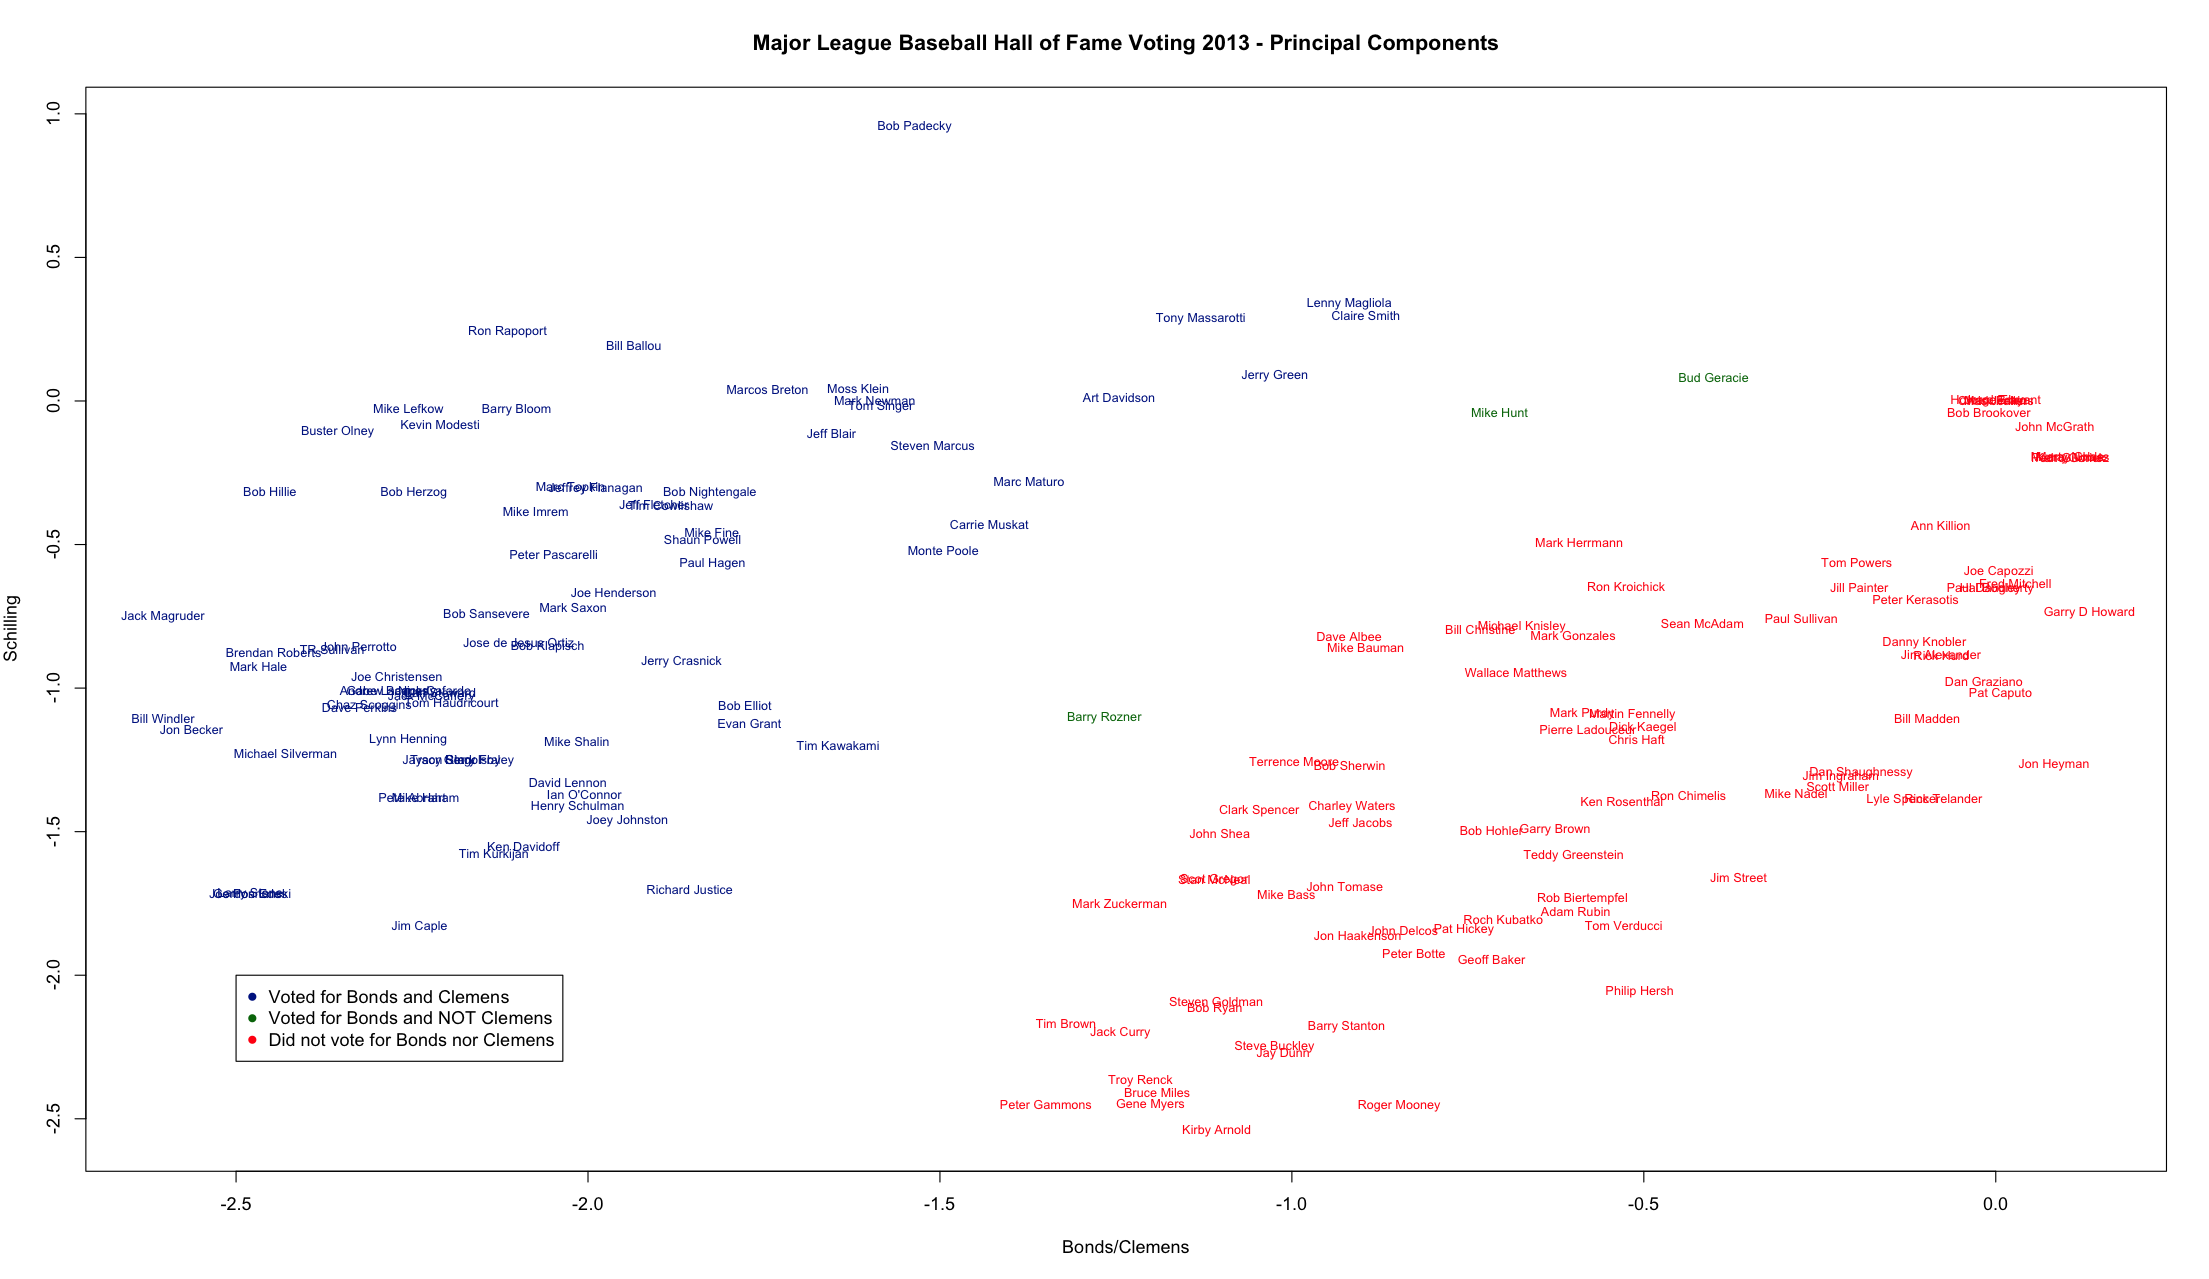
Probably more interesting than looking at the players is breaking down the voters. To do this, I used principal component analysis and then plotted one PC against another. It’s immediately evident that the voters fall into two main groups, and I have added some colors to highlight these differences. The red group in this first plot are the voters who did not vote for either Bonds nor Clemens, and the blue group voted for both Clemens and Bonds. Only three voters on public ballots, highlighted in green, voted for Bonds and not Clemens, and no public ballot had a vote for Clemens and not Bonds. Some interesting ballots standout on this plot immediately, like Bob Padecky. He seems to be very far away from the other voters and a quick look at his ballot tells you why. He voted for Clemens, Bonds, McGwire, Sosa, and Palmeiro and no one else. Not many other voters voted this way. At the other end of the steroids spectrum you have guys like Peter Gammons and Kirby Arnold. Gammons and Arnold both voted for Bagwell, Biggio, Edgar Martinez, Morris, Piazza, Raines, Schilling, and Trammell while Arnold additionally voted for McGriff and Lee Smith and Gammons added Larry Walker.
While the first principal component is mostly driven by voters opinions on steroids, the second principal component is not so obvious. It turns out that Curt Shilling does a pretty good job explaining it though. The plot below if that same as the previous, but the Schilling voters are highlighted with orange and purple. So you can see that voters towards the bottom of the graph tended to vote for Schilling and the voters towards the top did not. So what we have he is the upper right in red consist of voters who did not vote for Bonds no Schilling and the lower left in purple is voters who voted for both Schilling and Bonds. Then voters in the upper left tended to vote for Bonds and not Schilling wheres voters in the lower right voted for Schilling and not Bonds. This is why I have labeled the x-axis “Bonds/Clemens” and the y-axis “Schilling”.

The first and second principal components explain about 34% of the variability of the voters, and the first 4 explain almsot exactly 50% of the variability. The plot below plots the third principal component against the fourth. The divisions aren’t as clear as the previous plot, but there is still some groups that can be discerned. It seems that the third and fourth PC are being driven by Jack Morris and Alan Trammell, respectively. 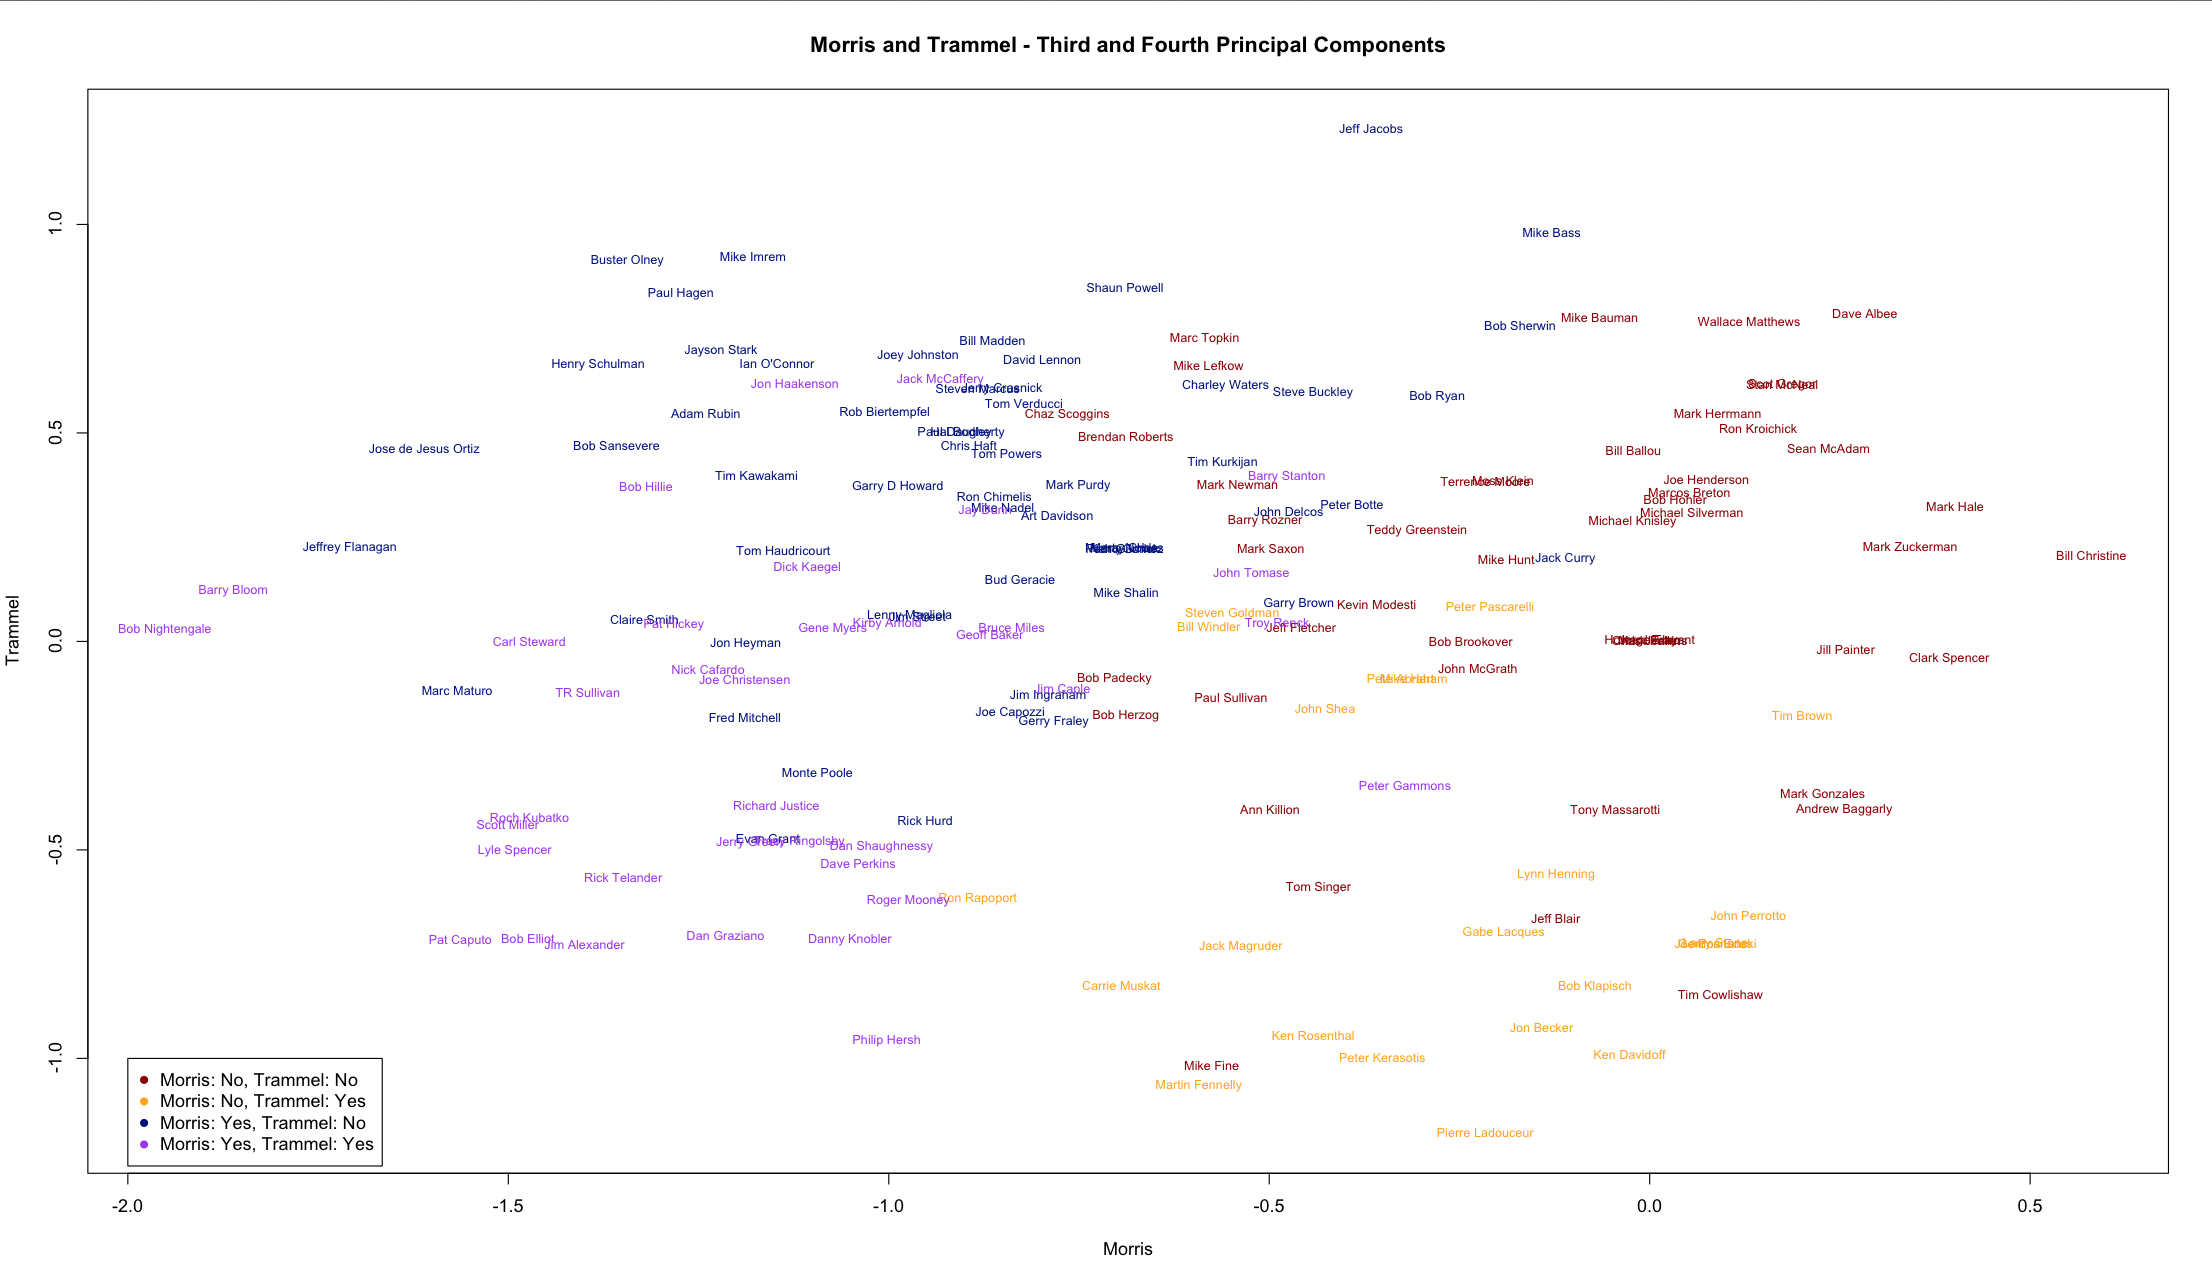 Finally, remember what we are looking at. Principal components seek to explain variability, in this case, between voters, so the principal components are going to align with those dimensions that explain the most variability. In other words, the PC are highlighting the controversial candidates where there is substantial disagreement, and most of the disagreement, seen in the first PC, can be explained players associated with steroids such as Bonds and Clemens. These are highly polarize characters in general and especially when it comes to Hall of Fame voting. Following these guys, the next largest sources of variability loosely are associated with Schilling, Morris, and Trammell all of whom seem to be highly debated candidates for the Hall of Fame.
Cheers.
NFL Rankings – 1/10/2012
Updated 1/10/2012 at 12:34pm
| Team | Rank | Change | Record | Projected Record | ESPN | TeamRankings.com | SOS | Prob Make Playoffs |
| New England | 1 | – | 12-4 | 12-4 | 4 | 3 | 18 | 100% |
| San Francisco | 2 | ↑2 | 11-4-1 | 11-4-1 | 3 | 5 | 3 | 100% |
| Seattle | 3 | ↓1 | 12-5 | 12-5 | 5 | 1 | 5 | 100% |
| Denver | 4 | ↓1 | 13-3 | 13-3 | 1 | 2 | 29 | 100% |
| Atlanta | 5 | – | 13-3 | 13-3 | 2 | 11 | 26 | 100% |
| Green Bay | 6 | – | 12-5 | 12-5 | 6 | 4 | 6 | 100% |
| Houston | 7 | – | 13-4 | 13-4 | 9 | 9 | 16 | 100% |
| Chicago | 8 | – | 10-6 | 10-6 | 13 | 8 | 9 | 0% |
| NY Giants | 9 | – | 9-7 | 9-7 | 14 | 15 | 15 | 0% |
| Baltimore | 10 | ↑1 | 11-6 | 11-6 | 10 | 12 | 23 | 100% |
| Minnesota | 11 | ↓1 | 10-7 | 10-7 | 12 | 6 | 7 | 100% |
| New Orleans | 12 | ↑6 | 7-9 | 7-9 | 19 | 17 | 12 | 0% |
| Washington | 13 | ↓1 | 10-7 | 10-7 | 8 | 7 | 13 | 100% |
| Cincinnati | 14 | ↓1 | 10-7 | 10-7 | 11 | 14 | 30 | 100% |
| St. Louis | 15 | ↓1 | 7-8-1 | 7-8-1 | 16 | 10 | 2 | 0% |
| Pittsburgh | 16 | ↑3 | 8-8 | 8-8 | 17 | 21 | 31 | 0% |
| Carolina | 17 | ↓1 | 7-9 | 7-9 | 18 | 13 | 11 | 0% |
| Dallas | 18 | ↓1 | 8-8 | 8-8 | 15 | 18 | 8 | 0% |
| Tampa Bay | 19 | ↑6 | 6-10 | 6-10 | 21 | 19 | 20 | 0% |
| Indianapolis | 20 | ↓5 | 11-6 | 11-6 | 7 | 16 | 27 | 100% |
| San Diego | 21 | ↑1 | 7-9 | 7-9 | 22 | 22 | 32 | 0% |
| Miami | 22 | ↓1 | 7-9 | 7-9 | 20 | 20 | 19 | 0% |
| Arizona | 23 | – | 5-11 | 5-11 | 27 | 26 | 1 | 0% |
| NY Jets | 24 | – | 6-10 | 6-10 | 25 | 27 | 10 | 0% |
| Buffalo | 25 | – | 6-10 | 6-10 | 23 | 23 | 22 | 0% |
| Detroit | 26 | – | 4-12 | 4-12 | 28 | 28 | 4 | 0% |
| Tennessee | 27 | – | 6-10 | 6-10 | 26 | 24 | 21 | 0% |
| Cleveland | 28 | – | 5-11 | 5-11 | 24 | 25 | 25 | 0% |
| Philadelphia | 29 | – | 4-12 | 4-12 | 29 | 29 | 14 | 0% |
| Oakland | 30 | – | 4-12 | 4-12 | 30 | 30 | 28 | 0% |
| Jacksonville | 31 | – | 2-14 | 2-14 | 31 | 32 | 17 | 0% |
| Kansas City | 32 | – | 2-14 | 2-14 | 32 | 31 | 24 | 0% |
Cheers.

