College Football and Money
How can this be a serious statement?
Iowa State football coach Paul Rhoads received about $2 million, which included a performance bonus for taking his 6-7 team to the AutoZone Liberty Bowl and additional retention pay.
http://collegefootball.ap.org/article/coaches-academics-top-list-state-salaries
He got a bonus for going 6-7!
Cheers.
Against the Spread Woes: Part 2
This post was written jointly by Michael Lopez (@StatsByLopez) and Gregory J. Matthews (@StatsInTheWild).
In last week’s post, we showed that several of the larger statistically-inclined websites which offer NFL picks have had a rough go of it to start the season, at least as far as their picks against the spread. More surprisingly, these results come on top of a string of several successful seasons in which each site consistently posted winning (>50%) results.
Today, we dive in to explore why the sites may have fallen behind the 8-ball.
First, we allocated picks from Football Outsiders, numberFire, Team Rankings, and Prediction Machine, four of the websites that we discussed last week. While there are several other competing analytics sites worth mentioning (including Statsational, CFBMatrix, and Massey-Peabody, who have had decent seasons), we stuck with these four because they had readily available for several seasons going back in time, and/or because they pick all NFL games each weekend.
First, let’s see how often each site picks the home team to cover, and how often each picks the favorite to cover
|
Site |
Home team (%) |
Favorite (%) |
|
Football Outsiders |
52.1 |
43.6 |
|
numberFire |
42.1 |
42.7 |
|
Prediction Machine |
45.4 |
40.2 |
|
Team Rankings |
29.7 |
33.3 |
These results aren’t totally surprising; the public often backs favorites and home teams, leaving skilled betters to often choose underdogs or road teams. In fact, over at ESPN Insider, Dave Tuley touts a “dogs or pass” philosophy. Still, it’s noticeable that all four prediction sites tend to back underdogs, and most tend to favor the road team, at least through week 8.
Perhaps these numbers explain the poor performance through week 8, as home teams (55% ATS) and favorites (54% ATS) have cleaned up.
Next, we consider if the sites are similar with respect to their picks. The following cells indicate the percentage of picks in which the two sites (one on the row, the other on the column) have agreed on. Surprisingly, the websites appear to be using methods or algorithms which are independent of one another, with percentages around 50 indicating that whether or not each pair of sites agrees on a pick is more or less a coin flip.
|
Football Outsiders |
numberFire |
Prediction Machine |
Team Rankings |
|
|
Football Outsiders |
X |
58.7 |
55.3 |
47.9 |
|
numberFire |
58.7 |
X |
50.4 |
53.7 |
|
Prediction Machine |
55.3 |
50.4 |
X |
51.2 |
|
Team Rankings |
47.9 |
53.7 |
51.2 |
X |
Better yet, what if all four sites agree? Here are the frequencies, and cover percentages, based on the number of websites which backed the home team.
Number of sites picking the home team
|
4 |
3 |
2 |
1 |
0 |
|
|
Frequency (%) |
21 |
25 |
49 |
22 |
4 |
|
Home record (ATS) |
12-7-2 |
15-10 |
26-23 |
9-13 |
2-2 |
This suggests the sites are in complete harmony with respect to picking the road team, home picks are a healthy 12-7-2. Of course, those numbers are too small a sample to yield any statistically significant results.
Let’s now take a look at all the individual teams and see how the group as a whole has done for each. The table below show the total record against the spread for all four sites broken out for games involving that team. For instance, the four sites are 15-17-0 ATS when picking games involving the Chicago Bears while their picks are 17-11-0 ATS for the games with the Atlanta Falcons. It looks like these sites are having particular trouble with the Bears, Packers, Saints, 49ers and Titans. Most of the other records for each team are at or very near .500 with very few teams having a winning record. In fact, there are only 5 teams that these four sites in total have a winning record for so far this season: Falcons (17-11), Bills (18-14), Vikings (18-10), Patriots (18-14), and the Raiders (14-10-4). Is there any obvious common thread between these teams? Please leave serious and sarcastic suggestions in the comments.
|
Next let’s separate out each site and look at winning percentages. The graph below shows a summary of winning percentages (ATS) for each site. Each wedge represents a team and the larger the wedge the higher the winning percentage. Each group of four plots represents a site. The divisions are labeled and the conferences are represented by blue and red wedges for the NFC and AFC, respectively. So, for instance, Number Fire is doing a really good job picking games against the spread involving NFC North opponents whereas there are not doing so well against the AFC North.

Finally, below are the results from each site that were used to generate the above image. No site has a perfect record with any team this year, but Football Outsiders is getting killed by Chicago (0-6-1) and the Saints (0-7). Though they aren’t the only ones being scorched by the Saints. White NumberFire is 4-3 with the Saints, TeamRankings and Prediction Machine are 1-6 and 3-4 respectively.
|
|
|
|
Cheers.
Week 8 NFL Playoff Probabilities
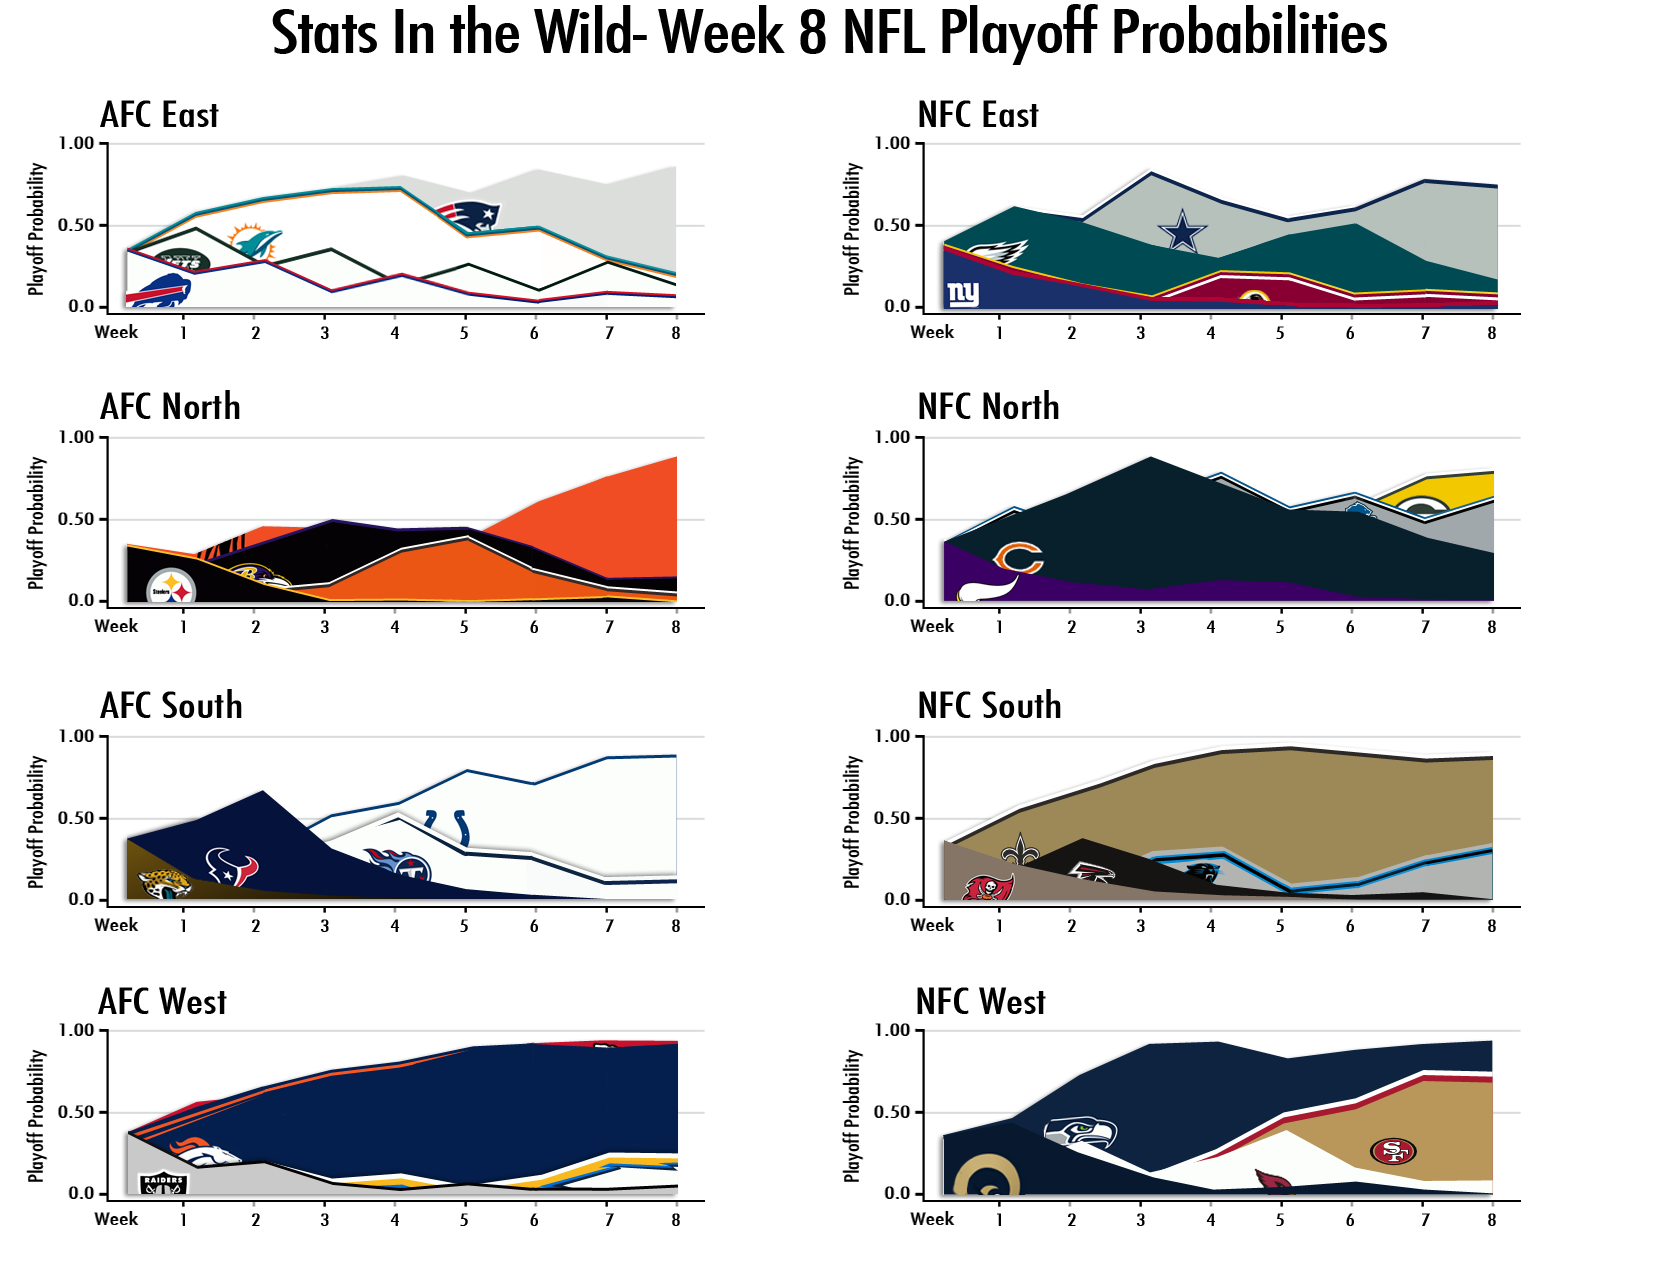
Unless something nutty happens in the next eight weeks, we’re looking at exactly the NFC North and MAYBE if Carolina puts together some big games (that’s with games against the Saints and Pats, who both are in but are also tough teams…). But wait! Count those AFC teams that are hovering near 1.00 and you only find five teams (KC is hiding there just behind the Broncos.) So who will get the sixth playoff spot for the AFC? While it looks like a race to the bottom for the AFC East teams that aren’t the Pats, the Fins along with the Chargers, Titans, Ravens and Browns all have punchers’ chances at that last spot. This Sunday’s Browns vs Ravens match up and the Week 11 SD vs Miami game could both loom large.
I feel stupid for even saying this, but I think the second Wild Card will actually be a bit interesting. The probabilities in chart take into consideration remaining strength of schedule, but clearly it’s worth looking at it in some detail. The Chargers have two games against Denver and one against KC, but KC is week 17, and they get to play the Giants and Raiders. The Dolphins schedule isn’t too bad, they play the Bengals this week, and the Patriots again, but not until week 15 (though we know Belichick doesn’t let off the gas pedal), plus Carolina and SD. The rest of their schedule is light, with two games against the Jets (who have a nice saw-tooth win/loss/win pattern going, and if that pattern holds, they’d lose both games against the Dolphins*) , plus the BIlls, Steelers and Bucs. Baltimore has two left against Cincy (though one in week 17) plus the Bears, Lions, Pats with only the Vikings and the Steelers as absolute terrible opponent. The Browns have only one left against the Bengals, the Pats plus the Bears, while they have two against Pittsburgh and one against Jacksonville. They both play the Jets, so who know what will happen there.
* I do not think there is some magic pattern leading the Jets to an 8-8 season. I think it’s that they’re not a very good team.
I personally would think the the smart money is on the Titans. They have two games against the Colts and one against the Broncos, but they also have two against the Jags, and one each versus the Rams, the Raiders, the Texans, and the Cardinals, four teams who are demonstrably terrible.
Stick with us to see how the playoff picture unfolds. Do not stick with certain other sites, who (no lie) actually seem to think the Bengals week 7 49-9 win over the Jets is somehow going to make it harder for them to beat the Dolphins. Um…. sure.
NCAA Football Top 25 – 10/27/2013
|
NFL Week 7 Playoff Probablities

The Broncos’ loss to the Colts appears caused some changes, though not as much as one might think. The loss allowed the 7-0 Chiefs to take the lead in the AFC West, but only just. Meanwhile, the Colts’ win puts the screws to the the rest of the AFC South. The Cowboys win over the Eagles boosts them quite a ways over the rest of the NFC East, the Bengals can hit cruise control. Thankfully, the NFC North and West exist, otherwise, their would be no drama whatsoever.
If you’ve used statistics websites for your NFL picks, you’ve been doing it wrong
It’s true. I am doing terrible in the NFL this year. But so is basically everyone else.
It’s still relatively early in the NFL season, but signs point to this being one of the worst seasons ever for simulation & statistics based predictors of game results. In fact, having followed several websites for the last few years, this is by far the worst I can remember each one doing as far as accuracy is concerned.
Here, I summarize results through week 7.
Football Outsiders (FO) : These guys have pretty much set the standard for NFL statistical analyses, as demonstrated by their preseason almanacs, appearances across the media, and downloadable spreadsheets with all sorts of good information. In their first five years of picking games against the spread (ATS), from 2008 to 2012, FO finished with yearly success rates of 53.7%, 51.2%, 56.1%, 52.0%, and 57.8%, respectively. There’s no public access for historical picks, but I’ve followed along and these numbers are 100% trustworthy.
This Fall, however…
View original post 606 more words
NFL rankings – October 24, 2013
Updated: October 24, 2013
Pro: The rankings are based on how a team performs and accounts for how many points they would be expected to score based on their statistical output such as rushing yards, passing yards, etc. This ranking considers past seasons statistics with heavier weights placed on games that are more recent. This ranking is the more predictive of the two.
Retro: This ranking only considers strength of schedule and the actual outcome of games in 2013. This is a ranking of who actually has had the best season.
SOS: Is strength of schedule.
|
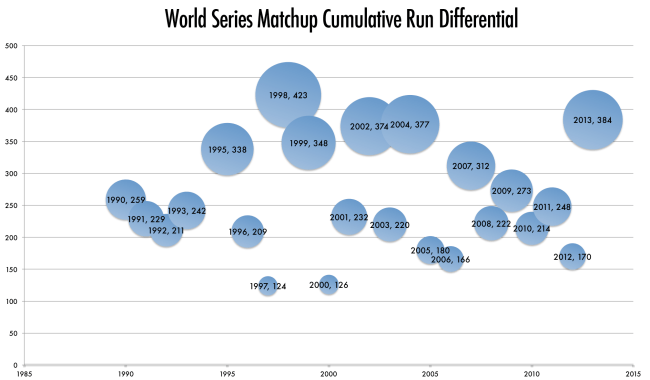
Fun with World Series Run Differentials
The Red Sox and Cardinals meeting in the Fall Classic represents the top run differentials in each league squaring off. Baseball statheads should feel the warm glow of empiricism peeking through, especially after last year when we had to hear from some about the overrating of run differential. Why is it at all controversial to say that the team largest difference between runs scored and runs allowed over 162 games? Is that a radical notion? I think part of it is the basic notion that most people don’t understand randomness (or “luck” or “fortuosity” or “midichlorians” or whatever you want to call it) and that even in a large sample of 162 games, you can have smaller sub-samples (like the Orioles’ 38 one-run games last season, in which they went an insane 29-9) where randomness can take over, and then the whole sample ends up a bit screwy.


* One fact that always seems to be left out when narratives are being created about the 2004 Red Sox is that they led the AL in run differential and it was about as close as Reagan vs Mondale. The Red Sox scored 181 more runs than they allowed. The second place AL team was the Angels, at +102, third was the Yankees at +89. The Red Sox’ expected record was 98 wins, same as their actual record. It was the 2004 Yankees whose record was grossly out of tune with their expected win-loss, as they won 101 games but were expected to win only 89 (which actually would have placed them behind the A’s for the Wild Card). It wasn’t that the Red Sox were scrappy and overcame obstacles, it was more that they were the much better team, best in the AL, and the Yankees’ magic dust finally wore out. It’s not as fun of a narrative, but it’s got a better empirical basis. Of course, it still doesn’t explain why the Yankees never bunted on Curt Schilling and his bloody sock, but that’s strategy, not empiricism.
Sports “Journalism”
I really enjoyed the below comment from this Deadspin article:
This sir, is exactly how I feel. I’m a journalism student and my professors hate Bill Simmons. Not because he isn’t a talent journalist, but he hasn’t been a journalist for the last 5 years and yet writes douchebag seriousness on his “Grantland” website that many take as gospel. I like Katie Baker and some of the others on Grantland, but Simmons and O’Reilly just need to get locked in a room by themselves and see who’s ego wins. At least then, we would only have one profound douche in sports media.
Cheers!
