Category Archives: Uncategorized
Are smaller spreads predictive of more exciting games?
Last weeks wild card games were, on the whole, a very entertaining group of football games. Most of the lines from the games reflected this (1.5, 3, 3, 7) with an average underdog getting 3.625 points . But this week the lines are on the whole much larger. According sports betting online, the average underdog this week is getting 6.125 points (0, 7, 8, 9.5), which is 2.5 points more on average than last week. This got me to wondering if the larger spreads might mean that these games would be less entertaining.
Formally, I would pose this question: is the excitement level of a game at all related to the spread. My hypothesis is that games with smaller spreads should be more exciting games than those with larger spreads. Of course, in order to test this you’d need to have a formal quantification of excitement. Luckily, the people at Advanced NFL Stats have done this already. It’s basically the sum of the movements of win probability throughout the game.
In order to do this I need to get excitement index scores and spreads for games from the past few years. Getting the spreads is easy, but I’m not sure is Advanced NFL Stats has an easily accessible downloadable database of games with excitement scores available for public use. (If that is available and you know where I can get it, please let me know.)
So while I try to figure out how I can get my hands on the data that I need to investigate this, I’ll just hope my hypothesis isn’t true because I’d like to see more exciting games this weekend like the bananas Kansas City Chiefs vs Indianapolis Colts game. Though as a fan of the New England Patriots, I’m hoping that Andrew Luck is on the other end of it this week.
Divisional Round Preview
The underdogs were 3-0-1 against the spread in the Wild Card round, which left me 2-1-1 ATS. In fact, not only did all of the underdogs cover (or tie) last week, 3 out of 4 of the underdogs won their games outright. Once again, I’m going to be all over the underdogs this week (as will the people at SportsBettingDime.com) in the Divisional round. While I’m picking all four of the home teams to win this week, I think they’ll all be close games.
New Orleans Saints at Seattle Seahawks
I’ve got the Saints gaining about 50 more total yards than the Seahawks and out passing them by 75 yards. However, the Saints will turn the ball over too many time to come away with the win here. My game prediction for this one is 22-19 with Seattle winning at home, like they usually do, but I like both the Saints +7.5 and +270 on the money line.
Indianapolis Colts at New England Patriots
I’ll admit it, I’m a Patriots fan. I picked them to win the Superbowl at the beginning of the season (over the 49ers who are still very much alive). But I’m worried about this game. I would have rather seen the Pats play the Chiefs or the Bengals (no one is afraid of the Bengals). Rules are rules though and the Colts will come into a hopefully warmer Foxboro riding high off of their great comeback win in the Wild Card round. The model says the Patriots have a 54.8% chance to win this game with a predicted score of 27-25. So I’m taking the Colts +7 and +250. And I’m going under 53.5 with a gun to my head.
San Francisco 49ers at Carolina Panthers
This is the game I’m most excited for this weekend. No matter who wins, I expect this to be a low scoring battle (like their “exciting” 10-9 game earlier this season) with the Panthers coming out on top. Though I’m only picking them because I have to pick a team. My predicted score based on my model is Panthers 19-17 with a median margin of victory of 1 for the Panthers. So I’ll take Carolina +2 because I have to and I’ll go under 42.5. I won’t be surprised if I win both of these, and I won’t be surprised if I lose both.
San Diego Chargers at Denver Broncos
I’ve got the Broncos winning this game with probability near 60%, and if San Diego were to pull out the win in this one, it would certainly be the most surprising upset of the weekend. I think Manning is going to have a good game with 325+ passing yards, and the Broncos will out gain the Chargers both in the air and on the ground. But I don’t think the Chargers will get dominated here. They certainly won’t be scared of the Broncos high flying offense. In fact, the Chargers we’re the last team to beat the Broncos 27-20 in week 15. (Interesting fact about the Broncos: They lost 3 games this year. Those three losses were to the Colts (39-33) in week 7, New England (34-31) in week 12, and San Diego (27-20) in week 15. Those three teams just so happen to be the three teams left in the AFC…..). I’m predicting Broncos 31-27, and so I’m taking the Chargers +9.5 and +320. I’m also going to be on the over 55 in this game.
Cheers.
NFL Divisional Round Picks and Predictions
New Orleans Saints at Seattle Seahawks
Prediction: Seahawks 22-19
Win Probability: Seahawks 56.85%
SU: Saints +270
Pick: Saints +7.5
OU: Under 46.5
Indianapolis Colts at New England Patriots
Prediction: Patriots 27-25
Win Probability: Patriots 54.8%
ML: Colts +250
Pick: Colts +7
OU: Under 53.5
San Francisco 49ers at Carolina Panthers
Prediction: Panthers 19-17
Win Probability: Panthers 53.46%
ML: Panthers +115
Pick: Panthers +2
OU: Under 42.5
San Diego Chargers at Denver Broncos
Prediction: Broncos 31-27
Win Probability: Broncos 59.7%
ML: Chargers +320
Pick: Chargers +9.5
OU: Over 55
NFL Wild Card Picks and Predictions
Kansas City Chiefs at Indianapolis Colts
Prediction: Chiefs 24-20
Win Probability: Chiefs 57.93%
SU: Chiefs -125
Pick: Chiefs -1.5
OU: Under 46.5
New Orleans Saints at Philadelphia Eagles
Prediction: Saints 27-24
Win Probability: Saints 56.92%
ML: Saints +140
Pick: Saints +3 (Even)
OU: Under 53.5
San Diego Chargers at Cincinnati Bengals
Prediction: Bengals 24-22
Win Probability: Chargers 45.86%
ML: Chargers +230
Pick: Chargers +7
OU: Over 46
San Francisco 49ers at Green Bay Packers
Prediction: 49ers 27-19
Win Probability: 49ers 69.54%
ML: 49ers -140
Pick: 49ers -3 (-105) PUSH
OU: Over 45.5
Fully open-source, transparent implementation of Wins Above Replacement: Results from 2013
Over the past year, I’ve been involved in a project with Ben Baumer (buy his book!) and Shane Jensen in developing an open source, completely transparent version of the (rather opaque) baseball statistic Wins Above Replacement that we’re calling openWAR. We presented our preliminary results this past summer in a talk at JSM and this fall in a poster at NESSIS, but now our full paper is available on ArXiV. (Below you can see the chalkboard that resulted from our initial discussion….I assume this will be historic someday.)

As part of our open source proposal, we’ve also developed an R package, also called openWAR, that allows the user to scrape play by play data from the web and then, if they choose, compute our version of openWAR. The package is currently available on Ben’s github and should be available on CRAN soon. (Jim Albert (!) mentioned this package in his recent book , which you should probably buy even if it didn’t have my name in it. You should buy it twice, since my name is in it.)
Quick story about Jim Albert: When I was deciding where to go to grad school I applied to Bowling Green specifically because Jim Albert was there. I got in and even had an email address and was all set to go, but they couldn’t give me an answer about funding. UConn came along and offered me full funding, and the rest is history. So it’s a pretty big honor for me to be mentioned in Jim Albert’s book.
So what are our results? Below you’ll find out top 20 players for 2013. One interesting thing to note is that according to our openWAR, Trout actually had a better year in 2013 than in 2012 and he still didn’t win the MVP award.
 Here is a comparison of our top 10 players from 2013 versus Fangraph’s top 10 players. Both methods agree that Mike Trout was the best player in 2013, and both methods had Josh Donaldson, Miguel Cabrera, Chris Davis, and Paul Goldschmidt in the top 10.

Next is a table of the ten best and worst fielders of 2013. What you should notice about this is that Miguel Cabrera, according to openWAR, was the worst fielder in baseball in 2013. It’s really incredible that his offensive numbers are so good that they more than compensate for his poor fielding.

The best base runner of 2013 was Ian Kinsler with a RAA of 10.64 and the worst base runner was Victor Martinez. The ninth worst base runner in 2013 was….Miguel Cabrera. Again, think about how good Cabrera has to be as a hitter to overcome his weaknesses as a fielder AND a baserunner to have won TWO AL MVP awards in a row. 
Cheers.
The Hall of Fame Pitch for Curt Schilling
This is a guest post written by Ted.
Curt Schilling has always been a very polarizing figure to the fans and media that follow Major League Baseball. Outspoken and controversial, Schilling has never shied away from making his political, social, and baseball opinions public knowledge. In addition, the recent catastrophic failure of his video game company, 38 Studios, and their default on a $75 million loan to the state of Rhode Island have left many shaking their head at the very mention of Curt Schilling’s name. However, when it comes to Curt Schilling the baseball player, polarization should not exist.
Last January, Schilling was eligible for the Hall of Fame for the first time. He ironically received votes from 38.8% of Hall of Fame voters (Schilling’s uniform number for the majority of his career was 38) for induction. 75% is needed for induction into the Hall of Fame. Needless to say, Schilling was far off from being immortalized in Cooperstown. Was this right? Did the voters give Schilling fair consideration? I have no vote for the Baseball Hall of Fame, but I’ve studied Curt Schilling’s career at length, and I’m convinced that the Baseball Writers Association of America (BBWAA) who vote for the Hall of Fame inductees every year got this one very wrong.
In my opinion, there are two factors to analyze when considering any player for the Hall of Fame – qualitative and quantitative. I want to focus on the quantitative factors first and then discuss Curt Schilling’s qualitative Hall of Fame attributes.
Schilling finished his regular season career with a record of 216-146 and a 3.46 ERA in 569 games (436 starts). He also pitched 3,261 innings and had 22 saves. He walked 711 batters and struck out 3,116. His career WHIP was 1.137. In the postseason, he had a record of 11-2 in 19 games with an ERA of 2.23. He pitched in 133 1/3 postseason innings, walking 25 and striking out 120 with a WHIP of 0.968. He won World Series Championships with Arizona (2001) and Boston (2004 & 2007). This is the extent of many traditional voters’ analysis of Schilling’s career. Many of these voters looked at his regular season career ERA as being a little high and most importantly in their mind, his win total of 216 much too low.
In order to truly analyze Schilling’s career, it’s important to go much deeper. First, wins are an extremely flawed statistic. The pitcher can only control so much during a baseball game. Lack of run support or a bad bullpen can hurt the starting pitcher’s chances of picking up a win in any start. In addition, pitchers are often victimized by poorly positioned fielders, fielding errors, and just plain bad luck on batted balls in play. A pitcher should be judged on what he can control, namely allowing runners to reach base. In this regard, walks and strikeouts should be emphasized. The pitcher can prevent runners from getting on base via a walk, and he can take the risk out of batted balls in play by striking the batter out. When it comes to walks and strikeouts, Schilling was a master at his craft.
Schilling is 22nd all-time in strikeouts per 9 innings pitched at 8.6. He is 82nd all-time in walks per 9 innings pitched at 1.962. However, Schilling’s most telling statistic is he’s 2nd all-time with a strikeout/walk ratio of 4.383. Over a 20 year career as mostly a starting pitcher, this is truly remarkable. Schilling’s knack for being a power pitcher with excellent control consistently gave his team a great chance at winning his starts by limiting the amount of runners on base with a free pass and the chance of batted balls in play producing runs. He excelled at what he could control as a pitcher.
From an advanced statistical standpoint, Schilling belongs amongst the greats of the game. He is 62nd on the all-time Wins Above Replacement (WAR) list at 79.9 and 26th all-time on the WAR for Pitchers list at 80.7. There are several Hall of Fame pitchers on that list ranked behind Schilling including Old Hoss Radbourn, Don Sutton, Red Faber, Amos Rusie, Jim Palmer, Carl Hubbell, Bob Feller, Dennis Eckersley, Juan Marichal, and Don Drysdale. Schilling is equally impressive in the career rankings of various Hall of Fame advanced metrics. He’s 36th all time for pitchers in Baseball-Reference.com’s Black Ink and Gray Ink. He’s also 27th all time for pitchers in Jay Jaffe’s JAWS which measures Hall of Fame credentials based upon players already enshrined. It emphasizes the 7 best WAR seasons in a player’s career which demonstrates a player’s level of dominance during their prime. In short, Schilling is statistically right in the thick of some of the best pitchers the game has ever seen.
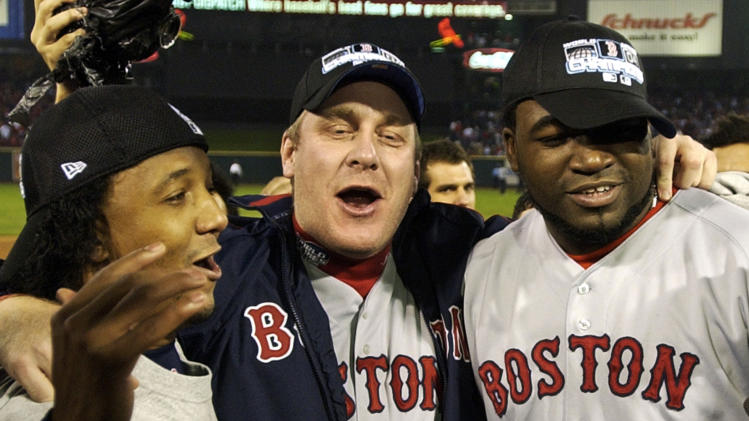
Qualitatively, Schilling has provided baseball with some of its greatest moments. Known as a big game pitcher, Schilling, along with Randy Johnson, was a rock for the 2001 Arizona Diamondbacks en route to the franchise’s first World Series Championship. He shared the 2001 World Series MVP award with Johnson and went 4-0 during those playoffs with a 1.12 ERA. In 2004, Schilling was crucial in the Red Sox’ first World Series Championship in 86 years. During that postseason, Schilling won Game 6 of the American League Championship Series while having a severely injured tendon sheath in his right ankle. This is famously referred to as the “bloody sock” game. Schilling went on to pitch successfully in the World Series against the Cardinals with that same injured ankle. In 2007, Schilling again played a major role in bringing another World Series Championship to the Boston Red Sox. For those writers who look at a player’s careers in terms of championships and how they perform on the big stage, it doesn’t get much better than Curt Schilling.

While I expect Schilling’s vote total for the Hall of Fame to increase this year, I don’t expect him to be inducted in 2014 as this year’s Hall of Fame ballot is exceptionally strong and many voters are known for limiting their ballots to only a few, select players even though they can vote for up to ten. First year players on the ballot include Tom Glavine, Mike Mussina, Frank Thomas, and Greg Maddux. In addition, second year eligible players that should see a boost in their vote totals include Craig Biggio, Mike Piazza, Roger Clemens, and Barry Bonds. However, I hope that many voters will look at their ballots more closely this year and really dig into the career numbers of Curt Schilling. If they do, they’ll find a pitcher who has more than enough quantitative and qualitative attributes to be immortalized in Cooperstown.
Week 16 Playoff Probabilities and WC Probs

(this was written before the games but apparently there was an upload error… sorry about) So those Lions eh? Basically, we have most of our playoffs clear, and we have a bunch teams that are leaning on a lot of other things to happen, so I made a graph of the teams on the bubble, to see where everything stands.

Basically, if the Chargers or Steelers make it, or the Saints don’t, something nutty happened. Don’t ask me why I included the Niners, they’re in no matter what…
Less pithy this week because of the holidays, but enjoy. I’ll do a season post-mortem after this week,
Git vs. Mercurial: Please Relax
MacGyver!
Everyone’s up in arms to embrace distributed version control as the new must-have tool for the developer in the know. Though many people have not yet migrated from Subversion, those that have almost invariably extoll the virtues of their particular choice. But though all of the major DVCS’s have features that set them above the previous generation of centralized systems, none stands head-and-shoulders above the others as Subversion does among the last generation: each of them was designed for a specific purpose, and each of them will serve those with different habits, workflows and development styles differently. Having used both git and Mercurial for the better part of a year, I’ve had the opportunity to compare the two. It saddened me to see a Twitter-based debate flamewar erupt over which is better, so I thought I’d do my best to try and ease the tension – with analogies!
Git…
View original post 1,699 more words
You can’t have it both ways
Last Friday, the blog Vegas Watch posted a piece calling out Football Outsiders for some seemingly outrageous basic math mistakes. Apparently, Aaron Schatz did not like the post.

Schatz’s response annoyed me. The entire FO brand is all about smart statistical analysis. So when you make so many outrageous basic statistical mistakes in one of your articles on a site like ESPN (behind a pay wall no less!) you’re going to get called out. And I don’t even think Vegas Watch was being that big of an “asshole”. Vegas Watch never said anything personal about the author, all of the criticism they delivered was entirely about the substance of the article and the editorial staff (or lack there of). Sure it was smug, but that’s what they do. As they say: “Vegas Watch: Blogging with an unearned smug sense of superiority.” (Which, as it turns out, is from a tweet by former FO/current Grantland writer Bill Barnwell. Weird?) So, FO doesn’t like it when people smugly call out their mistakes.
Well, I’ve tried to (tried to) point out some their mistakes in a non-smug manner. For instance, I wrote about their flawed “findings” about place kickers. I thought I was being polite, and I got this, what I would consider, smug response from Schatz:

Well, you can’t have it both ways. You can’t get all bent out of shape when someone smugly points out your mistakes on the one hand, and then smugly dismiss someone who politely points out your statistical errors. You also can’t tout yourselves as using advanced statistical methods in the analysis of football, and then make silly, simple, basic, statistical mistakes in an article that is going to be read by an enormous number of readers .
Cheers.
NFL Rankings – 12/22/2013
Pro: The rankings are based on how a team performs and accounts for how many points they would be expected to score based on their statistical output such as rushing yards, passing yards, etc. This ranking considers past seasons statistics with heavier weights placed on games that are more recent. This ranking is the more predictive of the two.
Retro: This ranking only considers strength of schedule and the actual outcome of games in 2013. This is a ranking of who actually has had the best season.
SOS: Is strength of schedule.
|
